Download Free Sample
Kindly complete the form below to receive a free sample of this Report
Chemical Packaging and Labeling Services Market Research Report: Size, Share, Trend Analysis By End Use Outlook (Industrial, Commercial, Residential, Institutional) By Application Outlook (Pharmaceuticals, Agriculture, Food and Beverage, Chemicals, Cosmetics) By Material Type Outlook (Plastic, Glass, Metal, Paper, Composite) By Packaging Type Outlook (Flexible Packaging, Rigid Packaging, Labeling Solutions, Bulk Packaging) By Regulatory Compliance Outlook (Hazardous Materials, Food Safety Standards, Environmental Regulations, Transportation Regulations) By Region (North America, Europe, APAC, South America, MEA) – Growth Outlook & Industry Forecast To 2035
As per MRFR analysis, the Chemical Packaging and Labeling Services Market Size was estimated at 25.0 USD Billion in 2024. The Chemical Packaging and Labeling Services industry is projected to grow from 25.78 USD Billion in 2025 to 35.0 USD Billion by 2035, exhibiting a compound annual growth rate (CAGR) of 3.11% during the forecast period 2025 - 2035.
The Chemical Packaging and Labeling Services market is experiencing a dynamic shift towards sustainability and technological innovation.
| 2024 Market Size | 25.0 (USD Billion) |
| 2035 Market Size | 35.0 (USD Billion) |
| CAGR (2025 - 2035) | 3.11% |
BASF SE (DE), Dow Inc. (US), SABIC (SA), Eastman Chemical Company (US), LyondellBasell Industries N.V. (US), Mitsubishi Chemical Corporation (JP), Huntsman Corporation (US), Solvay S.A. (BE), Clariant AG (CH)
Our Impact
Enabled $4.3B Revenue Impact for Fortune 500 and Leading Multinationals
Partnering with 2000+ Global Organizations Each Year
30K+ Citations by Top-Tier Firms in the Industry
The landscape of Chemical Packaging and Labeling Services is evolving, driven by various factors that shape industry dynamics. Companies are increasingly focusing on sustainability, which influences packaging materials and processes. This shift towards eco-friendly solutions is not merely a trend but appears to be a fundamental change in how businesses approach their operations. Additionally, regulatory compliance remains a critical aspect, as organizations must navigate complex guidelines to ensure safety and efficacy in their products. This necessity for adherence to regulations often leads to increased investment in labeling technologies and practices that enhance clarity and accuracy. Moreover, the rise of e-commerce has transformed the way Chemical Packaging and Labeling Services are delivered. As online sales continue to grow, the demand for efficient and secure packaging solutions intensifies. Companies are likely to adopt innovative packaging designs that not only protect products during transit but also enhance the consumer experience. This evolution suggests a future where packaging is not just functional but also serves as a vital marketing tool, reflecting brand values and engaging customers on multiple levels.
The emphasis on sustainable practices is reshaping the Chemical Packaging and Labeling Services sector. Companies are exploring biodegradable materials and recyclable options to minimize environmental impact. This trend indicates a broader commitment to corporate responsibility and aligns with consumer preferences for eco-friendly products.
Innovations in technology are significantly influencing Chemical Packaging and Labeling Services. Automation and smart labeling solutions are becoming more prevalent, enhancing efficiency and accuracy. These advancements suggest a potential for reduced operational costs and improved product traceability.
The expansion of e-commerce is driving changes in Chemical Packaging and Labeling Services. As online shopping becomes more common, the need for secure and appealing packaging solutions increases. This trend highlights the importance of packaging in enhancing customer satisfaction and brand loyalty.
The rapid expansion of e-commerce is significantly impacting the Chemical Packaging and Labeling Services Industry. As online shopping continues to grow, the demand for efficient and secure packaging solutions has intensified. Companies are increasingly focusing on developing packaging that not only protects products during transit but also enhances the unboxing experience for consumers. This trend is particularly relevant for chemical products, which require careful handling and labeling to ensure safety. The e-commerce sector is projected to grow at a CAGR of around 14% over the next few years, indicating a substantial opportunity for the Chemical Packaging and Labeling Services Industry to innovate and adapt to the changing landscape.
The Chemical Packaging and Labeling Services Industry is heavily influenced by stringent regulatory frameworks that govern the safe handling and transportation of chemicals. Compliance with regulations such as the Globally Harmonized System (GHS) and various local laws is paramount. These regulations ensure that packaging and labeling meet safety standards, thereby reducing risks associated with chemical exposure. As a result, companies in this industry must invest in compliance measures, which can drive demand for specialized packaging solutions. The increasing complexity of regulations may also lead to a rise in the need for expert consultation services, further propelling growth in the Chemical Packaging and Labeling Services Industry.
Sustainability has emerged as a pivotal driver in the Chemical Packaging and Labeling Services Industry. Companies are increasingly adopting eco-friendly packaging materials and practices to meet consumer demand for sustainable products. This shift is not only a response to regulatory pressures but also a strategic move to enhance brand reputation. The use of biodegradable materials and recyclable packaging is becoming more prevalent, as businesses aim to reduce their environmental footprint. Furthermore, the market for sustainable packaging is expected to grow significantly, with estimates suggesting a CAGR of around 5.7% in the coming years. This trend presents both challenges and opportunities for the Chemical Packaging and Labeling Services Industry as it adapts to evolving consumer preferences.
Technological advancements are reshaping the Chemical Packaging and Labeling Services Industry, driving efficiency and enhancing product safety. Innovations such as smart packaging, which incorporates sensors and QR codes, are gaining traction. These technologies not only improve traceability but also provide consumers with vital information about the product. Automation in packaging processes is also on the rise, leading to reduced labor costs and increased production speed. As companies seek to optimize their operations, the integration of advanced technologies is likely to become a key differentiator in the market. The ongoing investment in research and development within the Chemical Packaging and Labeling Services Industry suggests a promising future for these innovations.
The Chemical Packaging and Labeling Services Industry is experiencing a surge in demand for specialty chemicals, which are often used in niche applications across various sectors. This trend is driven by the growing need for customized solutions in industries such as pharmaceuticals, agriculture, and electronics. As specialty chemicals often require unique packaging and labeling solutions to ensure product integrity and compliance, this demand is likely to stimulate innovation within the industry. According to recent data, the specialty chemicals market is projected to grow at a compound annual growth rate (CAGR) of approximately 4.5% over the next few years, indicating a robust opportunity for the Chemical Packaging and Labeling Services Industry.
The 'Chemical Packaging and Labeling Services' market exhibits a diverse application landscape, with significant contributions from various sectors. Pharmaceuticals hold the largest market share due to stringent regulatory requirements and the growing demand for effective drug delivery systems. In contrast, the Food and Beverage sector is quickly gaining momentum, driven by consumer preferences for convenience and sustainable packaging solutions.
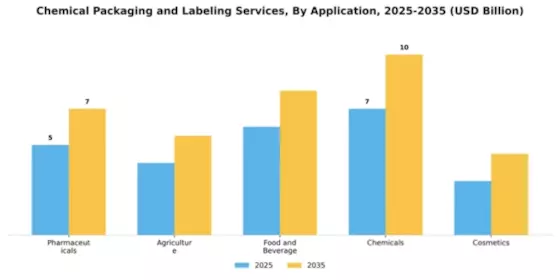
Pharmaceuticals (Dominant) vs. Food and Beverage (Emerging)
Pharmaceuticals represent a dominant force in the Chemical Packaging and Labeling Services sector due to the industry's focus on safety, compliance, and innovation. This segment prioritizes tamper-evident packaging and high-quality labeling to ensure product integrity and consumer trust. Conversely, the Food and Beverage sector is considered an emerging player, reflecting a growing inclination among consumers for eco-friendly and attractive packaging. As trends shift toward sustainability and convenience, service providers are increasingly adapting their offerings to meet the heightened expectations of consumers in this sector.
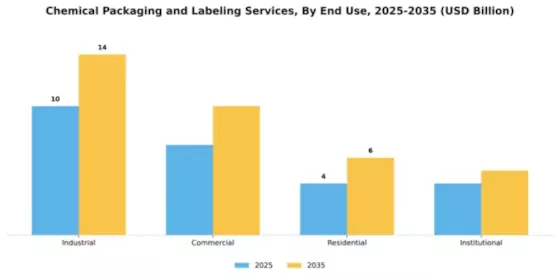
The end-use segment for chemical packaging and labeling services is characterized by a varied distribution among industrial, commercial, residential, and institutional applications. The industrial sector holds the largest share, driven by extensive manufacturing and heavy chemical usage. Commercial applications are also significant, catering to businesses and services that require efficient packaging solutions. On the other hand, residential and institutional segments occupy a smaller share but are gaining traction as packaging requirements evolve to meet consumer preferences and regulatory standards.
Industrial (Dominant) vs. Commercial (Emerging)
The industrial segment remains dominant in the chemical packaging and labeling services market due to its vast demand for packaging materials that comply with safety standards and facilitate storage and transportation. Industries such as manufacturing, agriculture, and pharmaceuticals drive this demand by requiring robust packaging solutions for hazardous and non-hazardous chemicals. Conversely, the commercial segment is emerging rapidly, fueled by the growth of e-commerce and demand for sustainable packaging. This sector focuses on innovative designs and labeling that cater to consumer preferences, leveraging technology to enhance brand visibility and product information. As sustainability becomes a key priority, both segments are expected to evolve, with commercial applications rising significantly.
The material type segment in the chemical packaging and labeling services market comprises diverse materials, with plastic holding the largest share due to its widespread applications, cost-effectiveness, and versatility. Glass, often perceived as premium packaging, is currently the fastest-growing segment among consumers seeking premium and sustainable solutions. The market distribution showcases a robust preference for plastic in numerous applications, while glass is gaining traction due to its environmentally friendly characteristics and regulatory support for sustainable products.
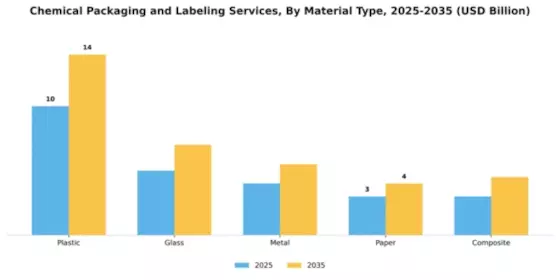
Plastic (Dominant) vs. Glass (Emerging)
The dominance of plastic in chemical packaging stems from its lightweight nature, resistance to breakage, and adaptability to various chemical compounds. It is extensively used across multiple sectors, making it the preferred choice for many companies. In contrast, glass is an emerging player in the market, witnessing increased demand driven by consumers' preference for aesthetic and sustainable packaging. As regulations shift towards sustainability, glass offers an eco-friendly alternative that appeals to environmentally conscious consumers. The contrasting characteristics of plastic and glass highlight their unique strengths, with plastic maintaining strong dominance and glass rising as an attractive, eco-friendly choice.
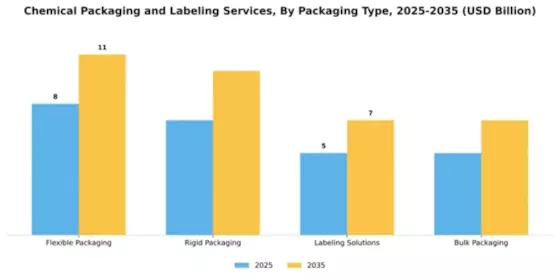
The Chemical Packaging and Labeling Services market showcases Flexible Packaging as the largest segment, capturing a significant share due to its versatility and cost-effectiveness. This type of packaging is witnessing increased adoption across various chemical products as it meets regulatory requirements while providing excellent protection and shelf life. In contrast, Rigid Packaging is emerging as the fastest-growing segment. Its robust nature and ability to secure chemicals during transportation make it increasingly popular among manufacturers and suppliers in the chemical industry.
Packaging: Flexible (Dominant) vs. Rigid (Emerging)
Flexible Packaging dominates the Chemical Packaging and Labeling Services landscape due to its adaptability, lightweight nature, and efficiency in production. It caters to a wide range of chemical products, from liquids to granular formulations, providing crucial benefits like barrier protection and sustainability. Meanwhile, Rigid Packaging is becoming an emerging choice for those seeking safety and durability. Its robust design is preferred for hazardous chemicals, ensuring safe transportation and storage. Both segments are essential in the packaging ecosystem, with Flexible Packaging leading in market share while Rigid Packaging captures the attention of evolving customer needs for strength and reliability.
In the Chemical Packaging and Labeling Services sector, the market share distribution is notably skewed towards 'Hazardous Materials', which dominates due to stringent regulations and widespread industrial use. Conversely, 'Food Safety Standards' is emerging rapidly, driven by increasing consumer awareness and regulatory changes in food safety protocols. This segment is witnessing heightened investment as companies strive to meet comprehensive labeling requirements, ensuring compliance and consumer trust. The growth trends in this segment are heavily influenced by regulatory updates and the rising emphasis on safety across industries. Specifically, the demand for stringent adherence to hazardous material regulations is propelling the market, while concurrently, food safety standards are becoming crucial in a market characterized by evolving consumer expectations. As businesses adapt to these challenges, innovations in packaging technology are likely to play a key role in maintaining compliance and improving market positioning.
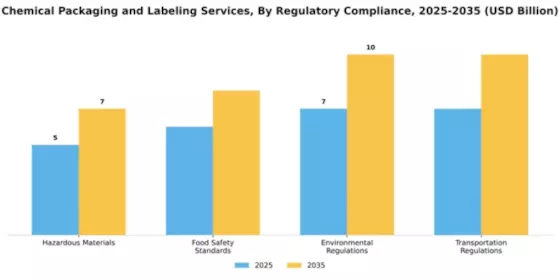
Hazardous Materials (Dominant) vs. Environmental Regulations (Emerging)
The 'Hazardous Materials' segment stands as a cornerstone in the Chemical Packaging and Labeling Services industry, characterized by its established protocols and widespread utilization in various sectors. This segment is crucial for organizations handling dangerous substances, ensuring compliance with regulations that protect public safety and environmental health. Its dominance is driven by the complexity and specificity of compliance requirements, which necessitate specialized packaging solutions. In contrast, 'Environmental Regulations' is an emerging segment, reflecting growing concerns over sustainability and ecological impact. Services associated with this segment focus on innovative packaging designs and the use of biodegradable materials, which align with global sustainability goals. As businesses increasingly prioritize eco-friendly practices, the demand for compliance with environmental regulations is set to grow, fostering new market opportunities.
Get more detailed insights about Chemical Packaging and Labeling Services Market Request Free Sample
North America is poised to maintain its leadership in the Chemical Packaging and Labeling Services market, holding a significant market share of 12.5 in 2024. The region's growth is driven by robust demand from the pharmaceutical and agricultural sectors, alongside stringent regulatory frameworks that ensure safety and compliance. The increasing focus on sustainable packaging solutions further propels market expansion, as companies adapt to environmental regulations and consumer preferences for eco-friendly products. The competitive landscape in North America is characterized by the presence of major players such as Dow Inc., BASF SE, and Eastman Chemical Company. These companies leverage advanced technologies and innovative solutions to enhance their service offerings. The U.S. remains the largest market, supported by a strong manufacturing base and significant investments in R&D. As companies strive for operational efficiency and compliance, the demand for specialized packaging and labeling services is expected to grow steadily.
Europe's Chemical Packaging and Labeling Services market is projected to reach a size of 7.5 by 2025, driven by increasing regulatory requirements and a strong emphasis on sustainability. The European Union's stringent regulations on chemical safety and environmental impact are key catalysts for market growth. Companies are increasingly adopting innovative packaging solutions that comply with these regulations while meeting consumer demand for sustainable products. The shift towards circular economy practices is also influencing packaging design and materials. Leading countries in this region include Germany, France, and the UK, where major players like BASF SE and Clariant AG are actively investing in sustainable technologies. The competitive landscape is marked by collaborations and partnerships aimed at enhancing product offerings and market reach. As the region continues to prioritize sustainability, the demand for eco-friendly packaging solutions is expected to rise significantly, shaping the future of the market.
The Asia-Pacific region is witnessing rapid growth in the Chemical Packaging and Labeling Services market, projected to reach 4.5 by 2025. This growth is fueled by increasing industrialization, urbanization, and rising demand for chemicals in various sectors, including automotive and electronics. Additionally, favorable government policies and investments in infrastructure are enhancing the market landscape. The region's focus on improving safety standards and regulatory compliance is also driving demand for specialized packaging solutions. Key players in Asia-Pacific include Mitsubishi Chemical Corporation and SABIC, with significant market presence in countries like China and India. The competitive environment is characterized by a mix of local and international companies striving to capture market share. As the region continues to develop, the demand for innovative and compliant packaging solutions is expected to grow, presenting opportunities for both established and emerging players.
The Middle East and Africa (MEA) region is at the nascent stage of development in the Chemical Packaging and Labeling Services market, with a projected size of 0.5 by 2025. The growth in this region is primarily driven by increasing industrial activities and the need for compliance with international safety standards. Governments are implementing regulations to enhance product safety and environmental protection, which is expected to boost demand for specialized packaging solutions. The region's rich natural resources also present opportunities for growth in chemical manufacturing. Countries like Saudi Arabia and South Africa are leading the market, with local players beginning to emerge alongside international firms. The competitive landscape is evolving, with companies focusing on innovation and compliance to meet the growing demand. As the region continues to develop its industrial base, the need for effective packaging and labeling services will become increasingly critical, paving the way for future growth.
The Chemical Packaging and Labeling Services market is characterized by a dynamic competitive landscape, driven by increasing regulatory requirements, sustainability initiatives, and the demand for innovative packaging solutions. Key players such as BASF SE (Germany), Dow Inc. (US), and Eastman Chemical Company (US) are strategically positioned to leverage their extensive R&D capabilities and global reach. BASF SE (Germany) focuses on sustainable packaging solutions, aiming to reduce environmental impact while enhancing product safety. Dow Inc. (US) emphasizes digital transformation and smart packaging technologies, which are becoming increasingly vital in meeting consumer expectations. Meanwhile, Eastman Chemical Company (US) is investing in advanced materials that cater to the evolving needs of the chemical industry, thereby shaping a competitive environment that prioritizes innovation and sustainability.The market structure appears moderately fragmented, with a mix of large multinational corporations and smaller specialized firms. Key business tactics include localizing manufacturing to reduce costs and optimize supply chains, which is essential in a market where logistics can significantly impact profitability. The collective influence of major players fosters a competitive atmosphere where agility and responsiveness to market demands are crucial for success.In November BASF SE (Germany) announced a partnership with a leading technology firm to develop biodegradable packaging solutions aimed at reducing plastic waste. This strategic move underscores BASF's commitment to sustainability and positions the company as a leader in eco-friendly packaging innovations. The collaboration is expected to enhance BASF's product offerings and appeal to environmentally conscious consumers, thereby strengthening its market position.In October Dow Inc. (US) launched a new line of smart packaging solutions that integrate IoT technology to monitor product conditions during transport. This initiative not only enhances supply chain transparency but also addresses the growing demand for real-time data in logistics. By adopting such advanced technologies, Dow is likely to improve customer satisfaction and operational efficiency, reinforcing its competitive edge in the market.In September Eastman Chemical Company (US) expanded its production capacity for specialty chemicals used in packaging applications. This expansion is indicative of Eastman's strategy to meet the rising demand for high-performance materials in the chemical packaging sector. By increasing its output, Eastman aims to solidify its market share and respond effectively to customer needs, which may enhance its competitive positioning in the long term.As of December the competitive trends in the Chemical Packaging and Labeling Services market are increasingly defined by digitalization, sustainability, and the integration of AI technologies. Strategic alliances among key players are shaping the landscape, fostering innovation and enhancing supply chain resilience. The shift from price-based competition to a focus on technological advancement and reliability is evident, suggesting that companies that prioritize innovation and sustainable practices will likely emerge as leaders in this evolving market.
The Chemical Packaging and Labeling Services market is projected to grow at a 3.11% CAGR from 2025 to 2035, driven by increasing regulatory compliance and demand for sustainable packaging solutions.
New opportunities lie in:
By 2035, the market is expected to be robust, driven by innovation and sustainability initiatives.
| MARKET SIZE 2024 | 25.0(USD Billion) |
| MARKET SIZE 2025 | 25.78(USD Billion) |
| MARKET SIZE 2035 | 35.0(USD Billion) |
| COMPOUND ANNUAL GROWTH RATE (CAGR) | 3.11% (2025 - 2035) |
| REPORT COVERAGE | Revenue Forecast, Competitive Landscape, Growth Factors, and Trends |
| BASE YEAR | 2024 |
| Market Forecast Period | 2025 - 2035 |
| Historical Data | 2019 - 2024 |
| Market Forecast Units | USD Billion |
| Key Companies Profiled | BASF SE (DE), Dow Inc. (US), SABIC (SA), Eastman Chemical Company (US), LyondellBasell Industries N.V. (US), Mitsubishi Chemical Corporation (JP), Huntsman Corporation (US), Solvay S.A. (BE), Clariant AG (CH) |
| Segments Covered | Application, End Use, Material Type, Packaging Type, Regulatory Compliance |
| Key Market Opportunities | Integration of sustainable materials and smart labeling technologies in Chemical Packaging and Labeling Services. |
| Key Market Dynamics | Rising regulatory scrutiny drives innovation in chemical packaging and labeling services, enhancing safety and compliance standards. |
| Countries Covered | North America, Europe, APAC, South America, MEA |
The projected market valuation for Chemical Packaging and Labeling Services is expected to reach 35.0 USD Billion by 2035.
The overall market valuation for Chemical Packaging and Labeling Services was 25.0 USD Billion in 2024.
The expected CAGR for the Chemical Packaging and Labeling Services market during the forecast period 2025 - 2035 is 3.11%.
Key players in the market include BASF SE, Dow Inc., SABIC, Eastman Chemical Company, and LyondellBasell Industries.
Primary applications include Pharmaceuticals, Agriculture, Food and Beverage, Chemicals, and Cosmetics, with valuations ranging from 3.0 to 10.0 USD Billion.
The market for flexible packaging is valued between 8.0 and 11.0 USD Billion, whereas rigid packaging is valued between 7.0 and 10.0 USD Billion.
Projected valuations for material types include Plastic at 10.0 to 14.0 USD Billion, Glass at 5.0 to 7.0 USD Billion, and Metal at 4.0 to 5.5 USD Billion.
Relevant regulatory compliance segments include Hazardous Materials, Food Safety Standards, Environmental Regulations, and Transportation Regulations, with valuations from 5.0 to 10.0 USD Billion.
The valuation range for the commercial end-use segment is projected to be between 7.0 and 10.0 USD Billion.
Growth trends suggest that the Chemical Packaging and Labeling Services market may present substantial opportunities, particularly as it approaches a valuation of 35.0 USD Billion by 2035.


Kindly complete the form below to receive a free sample of this Report

“This is really good guys. Excellent work on a tight deadline. I will continue to use you going forward and recommend you to others. Nice job”


“Thanks. It’s been a pleasure working with you, please use me as reference with any other Intel employees.”


“Thanks for sending the report it gives us a good global view of the Betaïne market.”


“Thank you, this will be very helpful for OQS.”


“We found the report very insightful! we found your research firm very helpful. I'm sending this email to secure our future business.”


“I am very pleased with how market segments have been defined in a relevant way for my purposes (such as "Portable Freezers & refrigerators" and "last-mile"). In general the report is well structured. Thanks very much for your efforts.”


“I have been reading the first document or the study, ,the Global HVAC and FP market report 2021 till 2026. Must say, good info! I have not gone in depth at all parts, but got a good indication of the data inside!”


“We got the report in time, we really thank you for your support in this process. I also thank to all of your team as they did a great job.”


“The Automotive 48V ECU Components Procurement Intelligence Study” was a complex project, but the Market Research Future (MRFR) team handled it with quality, agility, and customer-centricity. They delivered all requested data on time and within the agreed scope. The team, including Shubhendra Anand and Rahul Gotadki, was always readily available to clarify questions and swiftly implement necessary adjustments, driving the project to a successful conclusion within a very demanding timeframe.
I would also like to specifically commend Akshay Agarwal for his responsiveness and support at every stage—from our initial inquiry on May 6th through to final delivery on June 18th. His dedication made the entire process seamless.”



