Segmentation Quick Reference
| Dimension | Sub-Segments | Dominant Segment | Fastest Growing Segment |
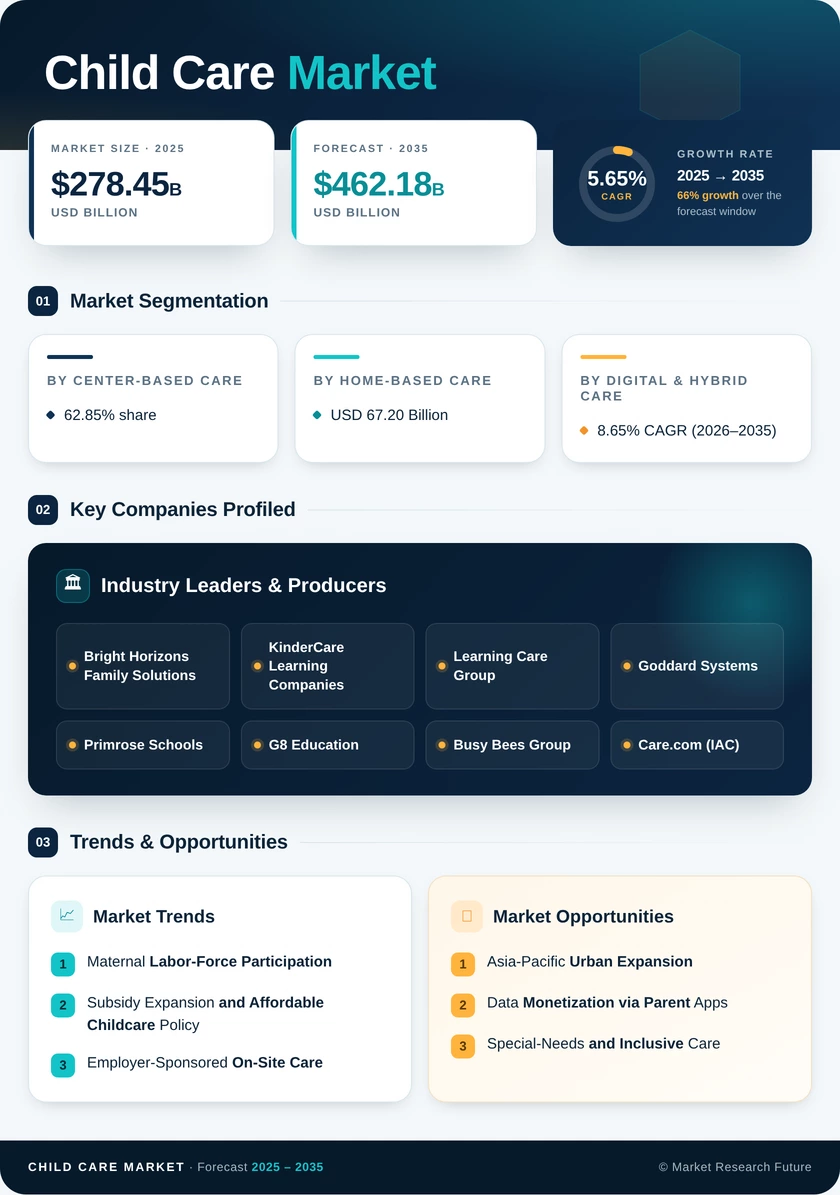
| By Child Care Market Type | Centre-Based Care; Home-Based Care; Digital & Hybrid Care | Centre-Based Care | Digital & Hybrid Care |
| By Age Group | Infant; Toddler; Preschool; School-Age; Special Needs | Preschool (3–5 years) | Infant (<12 months) |
| By Payment Mode | Self-Pay; Government Subsidy; Employer-Sponsored; Philanthropy; PPP | Self-Pay | Public-Private Partnership |
| By Provider Ownership | For-Profit; Not-For-Profit; Government-Operated | For-Profit | Not-For-Profit |
| By Region | North America; Europe; Asia-Pacific; South America; MEA | North America | Asia-Pacific |
Market Segmentation Overview
By Child Care Market Type
| Sub-Segment | Key Trend |
| Centre-Based Care | Standardization of curriculum IP, and HVAC retrofits, anchoring employer contracts |
| Home-Based Care | Resilience in infant-segment trust and informal-economy delivery |
| Digital & Hybrid Care | Mobile app enrollment, video check-ins, and remote enrichment are scaling rapidly |
Centre-based providers continue to defend pricing power through accreditation, safety tech, and franchise scale, while digital and hybrid formats are absorbing flexible-work demand created by the post-2022 hybrid workforce.
By Age Group
| Sub-Segment | Key Trend |
| Infant (<12 months) | Shorter parental-leave windows are raising premium-tier demand |
| Toddler (1–2 years) | Steady working-parent baseline, lower margin volatility |
| Preschool (3–5 years) | Universal pre-K mandates are pushing enrollment to near saturation |
| School-Age (6–12 years) | After-school care programs partnering with school districts |
| Special Needs | ASD prevalence and IDEA funding are driving specialty operator emergence |
Infant care economics, with tighter staff-to-child ratios, deliver the highest revenue-per-slot but require the deepest licensing diligence — a tradeoff increasingly absorbed by chain operators rather than independents.
By Payment Mode
| Sub-Segment | Key Trend |
| Self-Pay | Default mechanism in U.S. private markets |
| Government Subsidy | Expansion via CWELCC, KiTa, and 30-hour entitlement |
| Employer-Sponsored | Corporate retention driver, fastest absolute-dollar growth |
| Philanthropy | Foundation grants targeting access gaps |
| Public-Private Partnership | Brazil PNE and Canada CWELCC accelerating mixed funding models |
Payment-mode mix is migrating away from pure self-pay toward layered subsidy and employer contributions, structurally reshaping the receivables profile of the Child Care Market.
By Provider Ownership
| Sub-Segment | Key Trend |
| For-Profit | Chain scalability and PE-backed consolidation |
| Not-For-Profit | Community trust and superior subsidy-capture |
| Government-Operated | Public pre-K and anganwadi networks anchoring volume in emerging markets |
For-profit chains continue to lead aggregate revenue, but not-for-profits are outpacing in growth as subsidy regimes mature and procurement officials weigh mission alignment alongside cost.
By Region
| Sub-Segment | Key Trend |
| North America | Subsidy expansion and employer-contract dominance |
| Europe | Nordic universalism and German quality law extension |
| Asia-Pacific | Urbanization, the three-child policy, and NEP 2020 anganwadi modernization |
| South America | Brazil PNE 2024 enrollment targets |
| Middle East & Africa | Saudi Vision 2030 and UAE Early Childhood Authority mandates |