Request Free Sample ×

Kindly complete the form below to receive a free sample of this Report

* Please use a valid business email

Leading companies partner with us for data-driven Insights

clients tt-cursor
Hero Background

China Smart Labels Market

ID: MRFR/PCM/55340-HCR
200 Pages
Snehal Singh
Last Updated: February 06, 2026
China Smart Labels Market Research Report By Technology (RFID, NFC, QR Codes, Printed Electronics), By Type (Electronic Shelf Labels, In-Mold Labels, Wearable Smart Labels), By End Use (Retail, Logistics, Healthcare, Manufacturing) and By Material (Paper, Plastic, Metal, Wood)- Forecast to 2035
Download PDF ×

We do not share your information with anyone. However, we may send you emails based on your report interest from time to time. You may contact us at any time to opt-out.

  1. 1 SECTION I: EXECUTIVE SUMMARY AND KEY HIGHLIGHTS
    1. 1.1 EXECUTIVE SUMMARY
      1. 1.1.1 Market Overview
      2. 1.1.2 Key Findings
      3. 1.1.3 Market Segmentation
      4. 1.1.4 Competitive Landscape
      5. 1.1.5 Challenges and Opportunities
      6. 1.1.6 Future Outlook
  2. 2 SECTION II: SCOPING, METHODOLOGY AND MARKET STRUCTURE
    1. 2.1 MARKET INTRODUCTION
      1. 2.1.1 Definition
      2. 2.1.2 Scope of the study
        1. 2.1.2.1 Research Objective
        2. 2.1.2.2 Assumption
        3. 2.1.2.3 Limitations
    2. 2.2 RESEARCH METHODOLOGY
      1. 2.2.1 Overview
      2. 2.2.2 Data Mining
      3. 2.2.3 Secondary Research
      4. 2.2.4 Primary Research
        1. 2.2.4.1 Primary Interviews and Information Gathering Process
        2. 2.2.4.2 Breakdown of Primary Respondents
      5. 2.2.5 Forecasting Model
      6. 2.2.6 Market Size Estimation
        1. 2.2.6.1 Bottom-Up Approach
        2. 2.2.6.2 Top-Down Approach
      7. 2.2.7 Data Triangulation
      8. 2.2.8 Validation
  3. 3 SECTION III: QUALITATIVE ANALYSIS
    1. 3.1 MARKET DYNAMICS
      1. 3.1.1 Overview
      2. 3.1.2 Drivers
      3. 3.1.3 Restraints
      4. 3.1.4 Opportunities
    2. 3.2 MARKET FACTOR ANALYSIS
      1. 3.2.1 Value chain Analysis
      2. 3.2.2 Porter's Five Forces Analysis
        1. 3.2.2.1 Bargaining Power of Suppliers
        2. 3.2.2.2 Bargaining Power of Buyers
        3. 3.2.2.3 Threat of New Entrants
        4. 3.2.2.4 Threat of Substitutes
        5. 3.2.2.5 Intensity of Rivalry
      3. 3.2.3 COVID-19 Impact Analysis
        1. 3.2.3.1 Market Impact Analysis
        2. 3.2.3.2 Regional Impact
        3. 3.2.3.3 Opportunity and Threat Analysis
  4. 4 SECTION IV: QUANTITATIVE ANALYSIS
    1. 4.1 Packaging & Transport, BY Technology (USD Million)
      1. 4.1.1 RFID
      2. 4.1.2 NFC
      3. 4.1.3 QR Codes
      4. 4.1.4 Printed Electronics
    2. 4.2 Packaging & Transport, BY Type (USD Million)
      1. 4.2.1 Electronic Shelf Labels
      2. 4.2.2 In-Mold Labels
      3. 4.2.3 Wearable Smart Labels
    3. 4.3 Packaging & Transport, BY End Use (USD Million)
      1. 4.3.1 Retail
      2. 4.3.2 Logistics
      3. 4.3.3 Healthcare
      4. 4.3.4 Manufacturing
    4. 4.4 Packaging & Transport, BY Material (USD Million)
      1. 4.4.1 Paper
      2. 4.4.2 Plastic
      3. 4.4.3 Metal
      4. 4.4.4 Wood
  5. 5 SECTION V: COMPETITIVE ANALYSIS
    1. 5.1 Competitive Landscape
      1. 5.1.1 Overview
      2. 5.1.2 Competitive Analysis
      3. 5.1.3 Market share Analysis
      4. 5.1.4 Major Growth Strategy in the Packaging & Transport
      5. 5.1.5 Competitive Benchmarking
      6. 5.1.6 Leading Players in Terms of Number of Developments in the Packaging & Transport
      7. 5.1.7 Key developments and growth strategies
        1. 5.1.7.1 New Product Launch/Service Deployment
        2. 5.1.7.2 Merger & Acquisitions
        3. 5.1.7.3 Joint Ventures
      8. 5.1.8 Major Players Financial Matrix
        1. 5.1.8.1 Sales and Operating Income
        2. 5.1.8.2 Major Players R&D Expenditure. 2023
    2. 5.2 Company Profiles
      1. 5.2.1 Zebra Technologies (US)
        1. 5.2.1.1 Financial Overview
        2. 5.2.1.2 Products Offered
        3. 5.2.1.3 Key Developments
        4. 5.2.1.4 SWOT Analysis
        5. 5.2.1.5 Key Strategies
      2. 5.2.2 Avery Dennison (US)
        1. 5.2.2.1 Financial Overview
        2. 5.2.2.2 Products Offered
        3. 5.2.2.3 Key Developments
        4. 5.2.2.4 SWOT Analysis
        5. 5.2.2.5 Key Strategies
      3. 5.2.3 SATO Holdings (JP)
        1. 5.2.3.1 Financial Overview
        2. 5.2.3.2 Products Offered
        3. 5.2.3.3 Key Developments
        4. 5.2.3.4 SWOT Analysis
        5. 5.2.3.5 Key Strategies
      4. 5.2.4 Thin Film Electronics (NO)
        1. 5.2.4.1 Financial Overview
        2. 5.2.4.2 Products Offered
        3. 5.2.4.3 Key Developments
        4. 5.2.4.4 SWOT Analysis
        5. 5.2.4.5 Key Strategies
      5. 5.2.5 Cimpress (IE)
        1. 5.2.5.1 Financial Overview
        2. 5.2.5.2 Products Offered
        3. 5.2.5.3 Key Developments
        4. 5.2.5.4 SWOT Analysis
        5. 5.2.5.5 Key Strategies
      6. 5.2.6 Smartrac (DE)
        1. 5.2.6.1 Financial Overview
        2. 5.2.6.2 Products Offered
        3. 5.2.6.3 Key Developments
        4. 5.2.6.4 SWOT Analysis
        5. 5.2.6.5 Key Strategies
      7. 5.2.7 Checkpoint Systems (US)
        1. 5.2.7.1 Financial Overview
        2. 5.2.7.2 Products Offered
        3. 5.2.7.3 Key Developments
        4. 5.2.7.4 SWOT Analysis
        5. 5.2.7.5 Key Strategies
      8. 5.2.8 Invengo Technology (CN)
        1. 5.2.8.1 Financial Overview
        2. 5.2.8.2 Products Offered
        3. 5.2.8.3 Key Developments
        4. 5.2.8.4 SWOT Analysis
        5. 5.2.8.5 Key Strategies
      9. 5.2.9 PragmatIC (GB)
        1. 5.2.9.1 Financial Overview
        2. 5.2.9.2 Products Offered
        3. 5.2.9.3 Key Developments
        4. 5.2.9.4 SWOT Analysis
        5. 5.2.9.5 Key Strategies
    3. 5.3 Appendix
      1. 5.3.1 References
      2. 5.3.2 Related Reports
  6. 6 LIST OF FIGURES
    1. 6.1 MARKET SYNOPSIS
    2. 6.2 CHINA MARKET ANALYSIS BY TECHNOLOGY
    3. 6.3 CHINA MARKET ANALYSIS BY TYPE
    4. 6.4 CHINA MARKET ANALYSIS BY END USE
    5. 6.5 CHINA MARKET ANALYSIS BY MATERIAL
    6. 6.6 KEY BUYING CRITERIA OF PACKAGING & TRANSPORT
    7. 6.7 RESEARCH PROCESS OF MRFR
    8. 6.8 DRO ANALYSIS OF PACKAGING & TRANSPORT
    9. 6.9 DRIVERS IMPACT ANALYSIS: PACKAGING & TRANSPORT
    10. 6.10 RESTRAINTS IMPACT ANALYSIS: PACKAGING & TRANSPORT
    11. 6.11 SUPPLY / VALUE CHAIN: PACKAGING & TRANSPORT
    12. 6.12 PACKAGING & TRANSPORT, BY TECHNOLOGY, 2024 (% SHARE)
    13. 6.13 PACKAGING & TRANSPORT, BY TECHNOLOGY, 2024 TO 2035 (USD Million)
    14. 6.14 PACKAGING & TRANSPORT, BY TYPE, 2024 (% SHARE)
    15. 6.15 PACKAGING & TRANSPORT, BY TYPE, 2024 TO 2035 (USD Million)
    16. 6.16 PACKAGING & TRANSPORT, BY END USE, 2024 (% SHARE)
    17. 6.17 PACKAGING & TRANSPORT, BY END USE, 2024 TO 2035 (USD Million)
    18. 6.18 PACKAGING & TRANSPORT, BY MATERIAL, 2024 (% SHARE)
    19. 6.19 PACKAGING & TRANSPORT, BY MATERIAL, 2024 TO 2035 (USD Million)
    20. 6.20 BENCHMARKING OF MAJOR COMPETITORS
  7. 7 LIST OF TABLES
    1. 7.1 LIST OF ASSUMPTIONS
  8. 7.1.1
    1. 7.2 China MARKET SIZE ESTIMATES; FORECAST
      1. 7.2.1 BY TECHNOLOGY, 2025-2035 (USD Million)
      2. 7.2.2 BY TYPE, 2025-2035 (USD Million)
      3. 7.2.3 BY END USE, 2025-2035 (USD Million)
      4. 7.2.4 BY MATERIAL, 2025-2035 (USD Million)
    2. 7.3 PRODUCT LAUNCH/PRODUCT DEVELOPMENT/APPROVAL
  9. 7.3.1
    1. 7.4 ACQUISITION/PARTNERSHIP
  10. 7.4.1

China Packaging & Transport Market Segmentation

Packaging & Transport By Technology (USD Million, 2025-2035)
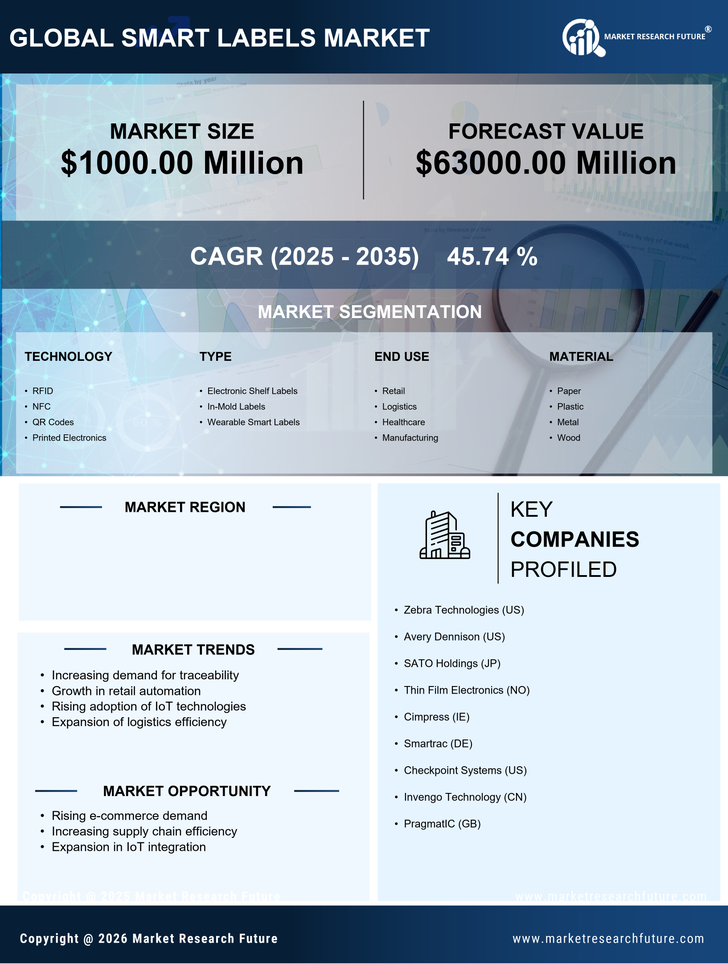
  • RFID
  • NFC
  • QR Codes
  • Printed Electronics

Packaging & Transport By Type (USD Million, 2025-2035)

  • Electronic Shelf Labels
  • In-Mold Labels
  • Wearable Smart Labels

Packaging & Transport By End Use (USD Million, 2025-2035)

  • Retail
  • Logistics
  • Healthcare
  • Manufacturing

Packaging & Transport By Material (USD Million, 2025-2035)

  • Paper
  • Plastic
  • Metal
  • Wood