Download Free Sample
Kindly complete the form below to receive a free sample of this Report
Civil Engineering Consulting Services Market Size, Share and Trends Analysis Research Report Information By End Use (Public Infrastructure, Residential Projects, Commercial Projects, Industrial Projects, and Transportation Systems), By Application (Structural Engineering, Geotechnical Engineering, Transportation Engineering, Water Resources Engineering, and Environmental Engineering), By Service Type (Design Services, Consultation Services, Project Management Services, Construction Supervision Services, and Feasibility Studies), And By Region (North America, Europe, Asia-Pacific, And Rest Of The World) – Market Forecast Till 2035.
As per MRFR analysis, the Civil Engineering Consulting Services Market was estimated at 197.4 USD Billion in 2024. The Civil Engineering Consulting Services industry is projected to grow from 202.81 USD Billion in 2025 to 265.8 USD Billion by 2035, exhibiting a compound annual growth rate (CAGR) of 2.74% during the forecast period 2025 - 2035.
The Civil Engineering Consulting Services Market is experiencing robust growth driven by technological advancements and sustainability initiatives.
| 2024 Market Size | 197.4 (USD Billion) |
| 2035 Market Size | 265.8 (USD Billion) |
| CAGR (2025 - 2035) | 2.74% |
AECOM (US), WSP Global Inc. (CA), Jacobs Engineering Group (US), Stantec Inc. (CA), Tetra Tech Inc. (US), Golder Associates (CA), Arup Group (GB), Ramboll Group (DK), Mott MacDonald (GB)
Our Impact
Enabled $4.3B Revenue Impact for Fortune 500 and Leading Multinationals
Partnering with 2000+ Global Organizations Each Year
30K+ Citations by Top-Tier Firms in the Industry
The Civil Engineering Consulting Services Market is currently experiencing a dynamic evolution, driven by various factors that shape its landscape. The increasing complexity of infrastructure projects necessitates specialized expertise, leading to a growing demand for consulting services. This market appears to be influenced by advancements in technology, which facilitate innovative solutions and enhance project efficiency. Furthermore, sustainability considerations are becoming more prominent, prompting firms to adopt environmentally friendly practices in their designs and methodologies. As a result, the market is likely to witness a shift towards integrated approaches that combine traditional engineering with modern sustainability principles. In addition, The Civil Engineering Consulting Services forward. Governments and private entities are investing in large-scale projects, which require comprehensive planning and execution strategies. This trend suggests that consulting firms may need to adapt their service offerings to meet the evolving needs of clients. Collaboration among stakeholders, including architects, urban planners, and engineers, is becoming increasingly vital to ensure successful project outcomes. Overall, the market is poised for growth, with opportunities arising from technological advancements and a focus on sustainable development practices.
The integration of advanced technologies into civil engineering consulting is reshaping service delivery. Tools such as Building Information Modeling (BIM) and Geographic Information Systems (GIS) are enhancing project visualization and management, allowing for more efficient planning and execution.
There is a growing emphasis on sustainable practices within the Civil Engineering Consulting Services Market. Firms are increasingly adopting green building techniques and environmentally responsible materials, reflecting a broader commitment to reducing the ecological footprint of infrastructure projects.
Rapid urbanization is driving demand for civil engineering consulting services. As cities expand, the need for comprehensive infrastructure solutions becomes critical, prompting consulting firms to innovate and collaborate with various stakeholders to address complex urban challenges.
The ongoing trends in urbanization are significantly influencing the Civil Engineering Consulting Services Market Industry. As populations continue to migrate towards urban areas, there is an escalating demand for infrastructure development, including transportation, housing, and utilities. This urban expansion necessitates comprehensive planning and execution, which civil engineering consultants are well-positioned to provide. Recent data indicates that urban areas are expected to house 68% of the world population by 2050, leading to a surge in infrastructure projects. Consequently, consulting firms are likely to see increased opportunities for collaboration with government and private sectors to address these challenges. This trend underscores the critical role of civil engineering consulting in shaping sustainable urban environments.
Government investments in infrastructure are a crucial driver for the Civil Engineering Consulting Services Market Industry. Many governments are prioritizing infrastructure development as a means to stimulate economic growth and improve public services. Recent reports indicate that infrastructure spending is projected to reach trillions of dollars over the next decade, creating a wealth of opportunities for civil engineering consultants. These investments often focus on transportation networks, water supply systems, and renewable energy projects, which require specialized consulting services. As governments seek to modernize aging infrastructure, the demand for expert guidance in project planning, design, and execution is likely to increase, positioning civil engineering consultants as essential partners in these initiatives.
Sustainability has emerged as a pivotal driver in the Civil Engineering Consulting Services Market Industry. With increasing awareness of environmental issues, clients are demanding sustainable solutions that minimize ecological impact. This shift is prompting consulting firms to adopt green building practices, energy-efficient designs, and sustainable materials. According to recent statistics, projects that incorporate sustainable practices can reduce operational costs by up to 30% over their lifecycle. Additionally, regulatory frameworks are increasingly favoring sustainable development, compelling firms to align their services with these standards. As a result, civil engineering consultants are not only enhancing their marketability but also contributing to a more sustainable future, which is becoming a critical factor in project selection.
The Civil Engineering Consulting Services Market Industry is experiencing a notable transformation due to rapid technological advancements. Innovations such as Building Information Modeling (BIM), Geographic Information Systems (GIS), and advanced project management software are enhancing efficiency and accuracy in project execution. These technologies facilitate better collaboration among stakeholders, leading to reduced project timelines and costs. As per recent data, the integration of these technologies has been linked to a 20% increase in project delivery speed. Furthermore, the adoption of drones and AI in surveying and monitoring is expected to streamline operations, thereby attracting more clients to civil engineering consulting services. This trend indicates a shift towards a more data-driven approach, which is likely to redefine traditional practices in the industry.
The resurgence of construction activities is a prominent driver in the Civil Engineering Consulting Services Market Industry. As economies recover and expand, there is a marked increase in both public and private sector construction projects. This uptick is evident in sectors such as residential, commercial, and industrial construction, which are all experiencing growth. Recent data suggests that construction output is expected to grow by 5% annually over the next few years, indicating a robust demand for civil engineering consulting services. This growth is further fueled by the need for innovative design solutions and efficient project management, which civil engineering consultants are adept at providing. Consequently, the rising construction activities are likely to bolster the market for consulting services, creating a favorable environment for industry players.
In the Civil Engineering Consulting Services Market, Structural Engineering holds the largest market share among its peers, driven by ongoing infrastructure projects and rising urbanization. Concurrently, Environmental Engineering has emerged as a dynamic sector, shaping its growth rapidly due to increasing environmental concerns and regulatory demands. These segments play a pivotal role in shaping the landscape of civil engineering consulting.
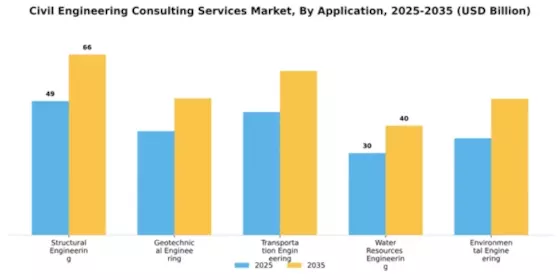
Environmental Engineering: Dominant vs. Geotechnical Engineering: Emerging
The notable shift toward sustainability has positioned Environmental Engineering as a dominant force in the market, focusing on renewable resource management, eco-friendly designs, and compliance with stringent regulations. In contrast, Geotechnical Engineering, while emerging, presents unique challenges, such as soil behavior analysis and foundational stability in construction projects. This juxtaposition highlights the pressing need for innovation and environmental responsibility, as Geotechnical Engineering adapts to shifting demands, combining traditional practices with technological advancements to enhance project viability.
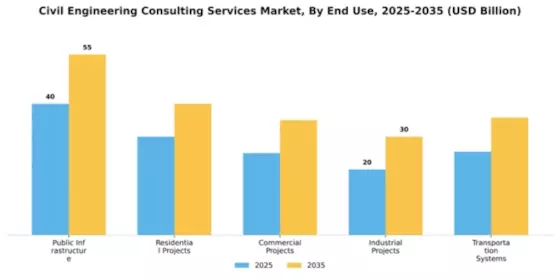
In the Civil Engineering Consulting Services Market, the distribution of market share among service types is varied. Design Services currently hold the largest share, primarily due to the increasing complexity of infrastructure projects that require innovative design solutions. Consultation Services, while smaller in terms of market share, are emerging rapidly as more companies seek expert guidance in navigating regulatory requirements and technical challenges in civil engineering. The growth trends indicate that Consultation Services are gaining momentum as firms recognize the value of bespoke advice that addresses unique project needs. Factors such as urbanization, significant public sector investments, and advancements in technology are driving this segment's growth. Additionally, the shift towards sustainable practices is further accelerating the demand for specialized consultations, making it a critical area of focus for the future of civil engineering consulting.
Design Services (Dominant) vs. Feasibility Studies (Emerging)
Design Services are a dominant force in the Civil Engineering Consulting Services Market, characterized by a comprehensive approach to creating infrastructure blueprints that meet both aesthetic and functional requirements. As urban populations grow and environmental regulations become stricter, the demand for innovative and sustainable design solutions is on the rise. Conversely, Feasibility Studies represent an emerging segment that is gaining importance, as they assess project viability, financial aspects, and technical requirements before any construction begins. These studies are crucial for mitigating risks and ensuring that projects align with market needs. While Design Services continue to drive the market forward, Feasibility Studies are increasingly recognized for their strategic importance in project planning and execution.
The Civil Engineering Consulting Services Market demonstrates a diverse distribution of end-use segments, with Public Infrastructure leading in market share. This segment includes government-funded projects such as roads, bridges, and utilities, which consistently receive priority in funding and development. Residential Projects follow closely, capturing significant attention due to the increasing demand for housing. Together, these segments shape the fabric of urban and rural landscapes, reflecting the dynamic needs of communities. The growth trends in this market are highly influenced by public investments and urbanization. Public Infrastructure remains a dominant force due to ongoing government initiatives, while Residential Projects are observed as the fastest-growing segment driven by demographic shifts, such as increased urban migration and a surge in housing demand. This trend indicates a robust shift towards constructing sustainable, affordable housing solutions, marking substantial growth opportunities in the consulting sector.
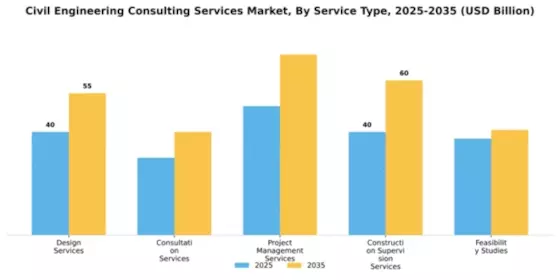
Public Infrastructure: Dominant vs. Residential Projects: Emerging
Public Infrastructure serves as the backbone of civil engineering, encompassing essential projects funded by government bodies. This segment is characterized by long-term planning, regulatory compliance, and significant budget allocation, which fosters a stable environment for consulting services. With rising emphasis on sustainable and resilient infrastructure, consultants are vital in guiding projects to meet modern demands. In contrast, Residential Projects represent an emerging segment fueled by rapid urbanization and a burgeoning population that intensifies the need for housing. This segment is more varied, focusing on affordability and community development, presenting unique challenges such as fluctuating material costs and the need for timely project delivery. Both segments, while distinctly different, play crucial roles in shaping the future of civil engineering consulting.
Get more detailed insights about Civil Engineering Consulting Services Market Request Free Sample
The Civil Engineering Consulting Services Market is characterized by a dynamic competitive landscape, driven by factors such as urbanization, infrastructure development, and sustainability initiatives. Major players like AECOM (US), WSP Global Inc. (CA), and Jacobs Engineering Group (US) are strategically positioned to leverage these growth drivers. AECOM (US) focuses on digital transformation and innovative engineering solutions, while WSP Global Inc. (CA) emphasizes sustainability and environmental stewardship in its projects. Jacobs Engineering Group (US) has adopted a strategy centered on mergers and acquisitions to enhance its service offerings and expand its global footprint. Collectively, these strategies contribute to a competitive environment that is increasingly focused on technological advancement and sustainable practices.In terms of business tactics, companies are localizing their operations to better serve regional markets and optimize supply chains for efficiency. The market structure appears moderately fragmented, with a mix of large multinational firms and smaller regional players. This fragmentation allows for diverse service offerings and competitive pricing, although the influence of key players remains substantial in shaping market trends and standards.In November AECOM (US) announced a partnership with a leading technology firm to develop advanced AI-driven project management tools. This strategic move is likely to enhance AECOM's operational efficiency and project delivery timelines, positioning the company as a leader in integrating technology into civil engineering practices. The partnership underscores the growing importance of digital solutions in the industry.In October WSP Global Inc. (CA) launched a new initiative aimed at reducing carbon emissions in infrastructure projects by 30% by 2030. This ambitious goal reflects WSP's commitment to sustainability and aligns with global trends towards greener construction practices. The initiative is expected to strengthen WSP's market position as a frontrunner in environmentally responsible engineering.In September Jacobs Engineering Group (US) completed the acquisition of a regional engineering firm specializing in renewable energy projects. This acquisition not only expands Jacobs' service portfolio but also enhances its capabilities in the rapidly growing renewable energy sector. The strategic importance of this move lies in Jacobs' ability to capitalize on the increasing demand for sustainable energy solutions, thereby reinforcing its competitive edge.As of December current trends in the Civil Engineering Consulting Services Market indicate a strong emphasis on digitalization, sustainability, and AI integration. Strategic alliances are increasingly shaping the competitive landscape, enabling firms to pool resources and expertise. The shift from price-based competition to a focus on innovation, technology, and supply chain reliability is evident. Companies that can effectively differentiate themselves through these avenues are likely to thrive in the evolving market.






The Civil Engineering Consulting Services Market is projected to grow at a 2.74% CAGR from 2025 to 2035, driven by urbanization, infrastructure investments, and technological advancements.
New opportunities lie in:
By 2035, the market is expected to be robust, reflecting steady growth and innovation.
| MARKET SIZE 2024 | 197.4(USD Billion) |
| MARKET SIZE 2025 | 202.81(USD Billion) |
| MARKET SIZE 2035 | 265.8(USD Billion) |
| COMPOUND ANNUAL GROWTH RATE (CAGR) | 2.74% (2025 - 2035) |
| REPORT COVERAGE | Revenue Forecast, Competitive Landscape, Growth Factors, and Trends |
| BASE YEAR | 2024 |
| Market Forecast Period | 2025 - 2035 |
| Historical Data | 2019 - 2024 |
| Market Forecast Units | USD Billion |
| Key Companies Profiled | AECOM (US), WSP Global Inc. (CA), Jacobs Engineering Group (US), Stantec Inc. (CA), Tetra Tech Inc. (US), Golder Associates (CA), Arup Group (GB), Ramboll Group (DK), Mott MacDonald (GB) |
| Segments Covered | Application, Service Type, End Use |
| Key Market Opportunities | Integration of advanced digital technologies enhances efficiency in the Civil Engineering Consulting Services Market. |
| Key Market Dynamics | Rising demand for sustainable infrastructure drives innovation and competition in civil engineering consulting services. |
| Countries Covered | North America, Europe, APAC, South America, MEA |
The market valuation reached 197.4 USD Billion in 2024.
The market is expected to grow to 265.8 USD Billion by 2035.
The market is anticipated to experience a CAGR of 2.74% from 2025 to 2035.
Structural Engineering and Transportation Engineering are projected to grow significantly, with valuations of 66.0 and 60.0 USD Billion respectively by 2035.
Key service types include Project Management Services, which are expected to reach 70.0 USD Billion by 2035.
Environmental Engineering is projected to grow to 49.8 USD Billion by 2035, indicating robust demand.
Key players include AECOM, WSP Global Inc., and Jacobs Engineering Group, among others.
The Public Infrastructure segment is projected to grow to 55.0 USD Billion by 2035.
Feasibility Studies are expected to reach 40.8 USD Billion by 2035, highlighting their importance in project planning.
The Residential Projects segment is projected to grow to 40.0 USD Billion, while Commercial Projects are expected to reach 35.0 USD Billion by 2035.


Kindly complete the form below to receive a free sample of this Report

“This is really good guys. Excellent work on a tight deadline. I will continue to use you going forward and recommend you to others. Nice job”


“Thanks. It’s been a pleasure working with you, please use me as reference with any other Intel employees.”


“Thanks for sending the report it gives us a good global view of the Betaïne market.”


“Thank you, this will be very helpful for OQS.”


“We found the report very insightful! we found your research firm very helpful. I'm sending this email to secure our future business.”


“I am very pleased with how market segments have been defined in a relevant way for my purposes (such as "Portable Freezers & refrigerators" and "last-mile"). In general the report is well structured. Thanks very much for your efforts.”


“I have been reading the first document or the study, ,the Global HVAC and FP market report 2021 till 2026. Must say, good info! I have not gone in depth at all parts, but got a good indication of the data inside!”


“We got the report in time, we really thank you for your support in this process. I also thank to all of your team as they did a great job.”


“The Automotive 48V ECU Components Procurement Intelligence Study” was a complex project, but the Market Research Future (MRFR) team handled it with quality, agility, and customer-centricity. They delivered all requested data on time and within the agreed scope. The team, including Shubhendra Anand and Rahul Gotadki, was always readily available to clarify questions and swiftly implement necessary adjustments, driving the project to a successful conclusion within a very demanding timeframe.
I would also like to specifically commend Akshay Agarwal for his responsiveness and support at every stage—from our initial inquiry on May 6th through to final delivery on June 18th. His dedication made the entire process seamless.”



