Commercial Aircraft Leasing Market (2026 - 2035)

Commercial Aircraft Leasing Market Size, Share, Industry Trend & Analysis Research Report By Leasing Type (Wet Lease, Dry Lease), By Aircraft Type (Narrowbody, Widebody, Regional Jets, Freighter/P2F Converted Aircraft), By End User (Full-Service Carriers, Low-Cost Carriers, Cargo, Charter and Others), By Lease Duration (Short-Term, Medium-Term, Long-Term), By Geography (North America, Europe, Asia-Pacific, South America, Middle East & Africa) - Forecast to 2035
ID: MRFR/AD/22917-HCR
128 Pages
Shubham Munde, Aarti Dhapte
Last Updated: August 24, 2026
Commercial Aircraft Leasing Market
Market Size
Forecast Period2026-2035
CAGR (2026-2035)7.8%
2025 Market SizeUSD 192.60 Billion
2035 Market SizeUSD 408.10 Billion
Key Players
AerCap Holdings
SMBC Aviation Capital
Avolon
Air Lease Corporation
BOC Aviation
ICBC Financial Leasing
Opportunities
  • India and the GIFT City Lessor Cluster
  • Freighter Conversion Economics
  • Data Monetization and Predictive Asset Management

Commercial Aircraft Leasing Market Summary

The commercial aircraft leasing market reached USD 192.60 billion in 2025 and opens the forecast horizon at USD 207.60 billion in 2026, climbing to USD 408.10 billion by 2035 at a 7.8% CAGR. Scarcity is doing most of the work. Airbus and Boeing are still delivering below pre-2019 run rates, and every slipped delivery slot pushes another carrier toward a lessor rather than an order book [2][3]. Airlines that once treated ownership as a badge of balance-sheet strength now treat it as trapped capital, and the commercial aircraft leasing market has absorbed that reversal faster than any other aviation finance channel [1].

Capital structure, not metal, defines the transformation underway. Bank-led secured debt and export credit agency cover — the workhorses of the 2010s — are ceding ground to aviation asset-backed securities, private credit vehicles, and insurance-company allocations chasing contracted, inflation-linked cash flows. Fitch tracked more than USD 9 billion of aircraft ABS issuance in 2025 alone, the strongest print since 2019 [17]. Sophisticated aircraft lessor portfolio management has become the differentiator: vintage laddering, jurisdiction mixing, and engine-variant hedging now decide returns more than headline lease rate factors.

Asia-Pacific holds 33.0% of 2025 revenue, powered by Chinese and Indian narrowbody induction [12]. Middle East & Africa grows fastest at a 9.9% CAGR as Gulf carriers rebuild wide-body capacity and African operators lean on operating leases to sidestep capital constraints [20]. Europe ranks second on a 26.4% share, anchored by Ireland's lessor cluster. The next decade belongs to whoever prices residual risk correctly.


Key Report Takeaways

• By Leasing Type

  • Dry leases captured 78.9% of commercial aircraft leasing market share in 2025, reflecting airlines' preference for full operational control
  • Wet-lease and ACMI arrangements are advancing at an 8.8% CAGR through 2035 as carriers hedge summer capacity gaps

• By Aircraft Type

  • Narrowbodies accounted for 57.6% of the commercial aircraft leasing market in 2025, led by A320neo and 737 MAX family placements
  • Freighter and P2F converted aircraft posted the fastest 9.6% CAGR, tracking cross-border e-commerce volumes
  • Wide-body leased fleet value reached USD 54.70 billion in 2025

• By Region

  • Asia-Pacific led the commercial aircraft leasing market with 33.0% revenue share in 2025
  • Middle East & Africa registers the fastest regional expansion at 9.9% CAGR to 2035
  • North America generated USD 47.76 billion in 2025, concentrated in US majors and cargo operators


Market Size and Forecast (2021–2035)

Estimates blend fleet-level lease placement data, published lease rate factor bands, lessor disclosure in annual reports and ABS offering circulars, and traffic elasticity models calibrated to ICAO and IATA passenger forecasts. Historical values are reconciled against reported portfolio net book values for the twenty largest lessors, then grossed up for private and bank-owned fleets.
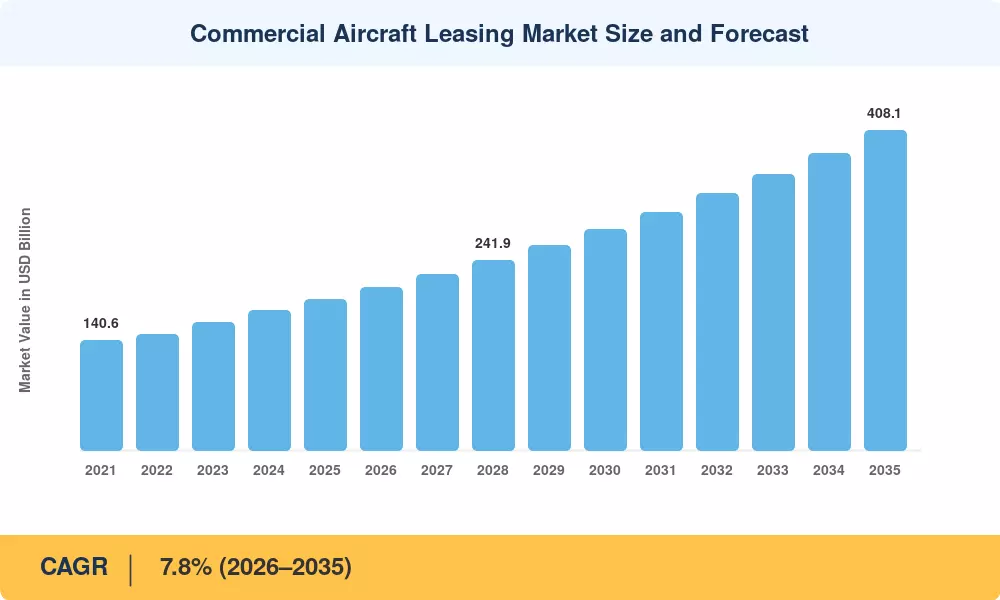
Commercial Aircraft Leasing Market Size and Forecast
Our Impact
Enabled $4.3B Revenue Impact for Fortune 500 and Leading Multinationals
Partnering with 2000+ Global Organizations Each Year
30K+ Citations by Top-Tier Firms in the Industry

Driver Impact Analysis

Impact weightings below express each driver's directional contribution to growth in the commercial aircraft leasing market. They are analyst-assigned, derived from regression on historical placement data, and deliberately not additive to the headline CAGR — drivers overlap, and several compete for the same fleet.

Driver ~% Impact on CAGR Geographic Relevance Impact Timeline
OEM delivery shortfalls at Airbus and Boeing +1.6 pp Global Short-term (≤2 yr)
Airline shift to asset-light balance sheets +1.4 pp Global Medium-term (2–4 yr)
Low-cost carrier fleet expansion +1.3 pp APAC, MEA Medium-term (2–4 yr)
Fleet decarbonization and re-equipment mandates +1.1 pp Europe, North America Long-term (≥4 yr)
Institutional and private-credit capital inflows +0.9 pp North America, Europe Medium-term (2–4 yr)
Cape Town Convention adoption widening +0.7 pp MEA, South America, APAC Long-term (≥4 yr)
Passenger-to-freighter conversion demand +0.6 pp Global Medium-term (2–4 yr)


Delivery Scarcity Repricing the Fleet

Although 43,600 new deliveries are anticipated by Boeing's 2025 Commercial Market Outlook through 2044, near-term output is still about 20% below plan due to supply-chain and certification issues [2]. Negotiating leverage has been reversed by scarcity. Twelve-year periods, which were formerly uncommon, now frequently clear, and lessors report extension rates of more than 80% on narrowbody leases that are about to expire. There are two advantages for the commercial aircraft leasing market: contemporary metal makes more money, and both rating agencies and lessors have increased their residual estimates on 2015-vintage aircraft [16].


Asset-Light Airline Balance Sheets

Deleveraging continues to be the primary CFO task, and carriers came out of the pandemic with an additional debt of over USD 180 billion [1]. Book equity is transformed into liquidity without diluting shareholders when owned airplanes are sold and leased back. Since 2023, numerous US low-cost carriers, Turkish Airlines, and IndiGo have all implemented multi-aircraft programs. Rather than being a sign of trouble, the structure is now regular Treasury practice.


Low-Cost Carrier Expansion Across Asia-Pacific

ICAO forecasts Asia-Pacific traffic growing 5.3% annually to 2043, well above the global 4.1% average [12]. Low-cost carriers capture the majority of that increment, and they lease. India's fleet alone is projected to exceed 1,500 aircraft by 2030 under Ministry of Civil Aviation planning assumptions, with GIFT City's IFSCA framework granting tax neutrality to domestically domiciled lessors [19].

Green Capital and Fuel-Efficiency Economics

ReFuelEU Aviation obliges EU-departing flights to uplift 6% sustainable aviation fuel by 2030, rising to 70% by 2050 [14]. Because SAF trades at a two-to-three times premium to jet fuel, every percentage point of airframe efficiency compounds. New-technology narrowbodies burn roughly 15–20% less fuel than the models they replace, which is why lessors have concentrated orderbooks almost exclusively in neo and MAX variants [3].


Restraints Impact Analysis

Restraint weightings are directional drags, not subtractions from the forecast CAGR. Each is modelled independently against placement volumes and lease yields, and the commercial aircraft leasing market absorbs several of them concurrently without proportional compounding.

Restraint ~% Impact on CAGR Geographic Relevance Impact Timeline
Elevated funding costs and refinancing walls −1.2 pp Global Short-term (≤2 yr)
Engine MRO bottlenecks and AOG groundings −0.9 pp Global Short-term (≤2 yr)
Russia-related write-offs and insurance litigation −0.6 pp Europe, CIS Medium-term (2–4 yr)
Lease-rate competition among mega-lessors −0.5 pp Global Medium-term (2–4 yr)
Emerging-market airline credit and FX exposure −0.4 pp South America, Africa, South Asia Long-term (≥4 yr)


Cost of Capital Compression

The difference between funding cost and lease yield is the foundation of lessor economics. After benchmark rates increased by about 500 basis points from 2021 lows, the margin shrank significantly before partially rebounding. Identifies a concentrated wall of 2026–2028 refinancing across the unsecured loan stack of the industry [16]. While sub-investment-grade platforms experience actual margin erosion, investment-grade lessors get away with it.


Engine Availability as a Structural Constraint

Since 2023, some hundred aircraft have been grounded at any given time due to powder-metal pollution in geared turbofan engines, with turnaround times for shop visits exceeding 300 days [5]. Most dry leases still charge rent for grounded aircraft, but portfolio planning is made much more difficult by compensation disputes, prolonged maintenance reserves, and delayed redeliveries.


Residual Value and Repossession Risk

Roughly 400 aircraft remained stranded in Russia after 2022, triggering multi-billion-dollar insurance claims still working through English and Irish courts [7]. Litigation outcomes will reset how underwriters price political risk. Where Cape Town Convention protections are weak — parts of West Africa, portions of South Asia — lessors demand security deposits of four to six months' rent rather than the customary three [6].


Commercial Aircraft Leasing Market Opportunities

India and the GIFT City Lessor Cluster

More than thirty aircraft leasing companies have been granted licenses by IFSCA at GIFT City, providing withholding tax and capital gains exemptions that were previously exclusive to Ireland [19]. Domesticating those assets onshore makes financial sense as Indian carriers deliver aircraft against orderbooks surpassing 1,500. In the commercial aircraft leasing industry, early adopters of an Indian aircraft sale-leaseback transaction pipeline will have a structural advantage.


Freighter Conversion Economics

In 2024, air cargo tonne-kilometers increased by 11.3%, primarily due to cross-border e-commerce from Asia [22]. All conversion slots for the A321 and 737-800 platforms are reserved until 2027. A second earning life can be extracted by lessors with mid-life narrowbodies at returns significantly higher than passenger-configuration rents.


Data Monetization and Predictive Asset Management

Every leased aircraft generates continuous engine and airframe telemetry that lessors historically never touched. Platforms that ingest that stream can predict shop-visit timing, price maintenance reserves accurately, and offer airlines performance-linked lease structures. Several lessors have begun selling anonymized fleet-utilization analytics to insurers and financiers as a distinct revenue line.

Gulf Wide-Body Renewal

Saudi Arabia's aviation strategy targets 330 million annual passengers by 2030, requiring an estimated fleet expansion of over 500 aircraft [20]. Riyadh Air's launch and Emirates' 777X induction create a wide-body leasing pipeline the commercial aircraft leasing market has not seen since 2014.

Private Credit and Insurance Capital

Insurance balance sheets seeking long-duration, inflation-correlated assets have identified aircraft leases as a natural match. Fitch notes ABS structures increasingly place senior tranches directly with insurers rather than through public syndication [17]. Lessors that build separately managed accounts for this capital can grow fleets without consuming their own equity.


Commercial Aircraft Leasing Market Future Outlook

Predictive Maintenance Reshapes Residuals

Engine health monitoring now generates enough data to forecast shop-visit timing within a narrow window, which changes how the commercial aircraft leasing market prices maintenance reserves. Lessors deploying these models can offer power-by-the-hour style structures that shift risk deliberately rather than by default. Accuracy in reserve pricing translates directly into higher realized residuals at redelivery [5].

Platform Consolidation and Scale Economics

Scale determines funding cost in this business. The top-tier lessors borrow 100 to 200 basis points tighter than mid-sized peers, and that gap compounds across a 400-aircraft portfolio. Expect continued consolidation of sub-100-aircraft platforms into managed-fleet arrangements where a large lessor services assets it does not own [16].

Sustainable Aviation Fuel and Compliance Costs

IATA estimates the aviation industry's net-zero transition will require roughly USD 4.7 trillion of cumulative investment through 2050, most of it in fuel production rather than airframes [1]. Airlines facing that bill will conserve capital aggressively — which pushes fleet acquisition further toward leasing. Compliance cost is, paradoxically, a leasing demand driver.

Emerging-Market Domiciliation

Ireland's dominance will erode at the margin as India, Singapore, and Hong Kong build competitive tax and legal frameworks. Fragmentation of domiciliation across several hubs makes the commercial aircraft leasing market structurally more resilient, since no single jurisdiction's policy change can dislocate the whole sector [19].


Commercial Aircraft Leasing Market Segmentation

By Leasing Type

Segment Metric (2025) Primary Demand Driver
Dry Lease 78.9% share Full operational control; long-term fleet planning
Wet Lease 8.8% CAGR Seasonal capacity gaps and AOG cover


Dry leasing anchors the commercial aircraft leasing market because airlines want their own crews, livery, and AOC on the aircraft. Wet leasing grows faster from a smaller base, driven by grounded-fleet substitution and European summer peaks where operators like SmartLynx and Avion Express have built dedicated ACMI businesses [5].

By Aircraft Type

Segment Metric (2025) Primary Demand Driver
Narrowbody 57.6% share LCC growth and short-haul density
Widebody USD 54.70 Billion Long-haul recovery and Gulf renewal
Regional Jets 7.4% CAGR Thin-route economics and pilot scope rules
Freighter / P2F Converted 9.6% CAGR E-commerce and express network expansion


Narrowbody dominance in the commercial aircraft leasing market reflects liquidity above all — an A320neo can be remarketed to dozens of operators, while a 787 fits perhaps fifteen. That redeployment optionality is precisely what lessors underwrite. Freighters compensate for narrower liquidity with materially higher yields and conversion slot scarcity [22].

By End User

Segment Metric (2025) Primary Demand Driver
Full-Service Carriers 55.0% share Fleet renewal and balance-sheet deleveraging
Low-Cost Carriers 8.9% CAGR Rapid capacity addition without capital outlay
Cargo, Charter and Others USD 22.30 Billion Express logistics and ACMI operations


Full-service carriers still contribute the largest slice of the commercial aircraft leasing market by value, since wide-bodies carry higher rents. Growth, though, sits with low-cost operators whose entire business model assumes leased metal — several major LCCs lease above 70% of their fleet deliberately, preserving cash for network expansion [1].

By Lease Duration

Segment Metric (2025) Primary Demand Driver
Short-Term (≤3 yr) 8.1% CAGR Capacity bridging and seasonal demand
Medium-Term (4–8 yr) 48.0% share Standard operating lease tenor
Long-Term (≥9 yr) USD 67.00 Billion Delivery-scarcity-driven extensions


Medium-term tenors remain the commercial aircraft leasing market's default because they balance lessee flexibility against lessor residual exposure. Scarcity has stretched the distribution rightward — twelve-year terms on new-technology narrowbodies now clear regularly, which was uncommon before 2022 [8].


Regional Market Share Analysis

Region Metric (2025) Primary Investment Themes
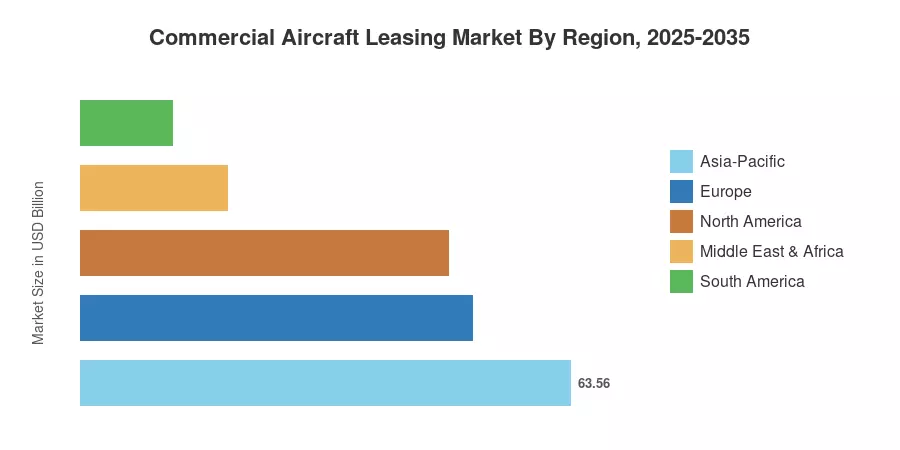
Asia-Pacific 33.0% share LCC induction, India domiciliation, China wide-body
Europe 26.4% share Irish lessor cluster, SAF compliance, fleet renewal
North America USD 47.76 Billion Cargo conversion, ABS issuance, majors' sale-and-leaseback
Middle East & Africa 9.9% CAGR Gulf wide-body, African operating-lease reliance
South America USD 11.94 Billion Post-restructuring re-fleeting, LCC entry
Total USD 192.60 Billion

Regional performance in the commercial aircraft leasing market diverges sharply on fleet age, traffic growth, and legal enforceability of security interests.


North America

Country Metric Key Driver
US 84.6% of region Majors' fleet renewal and cargo conversion
Canada USD 4.90 Billion Ultra-low-cost carrier expansion
Mexico 7.9% CAGR Category 1 restoration and Viva fleet growth


FAA forecasts US mainline capacity growing 2.4% annually through 2045, modest in isolation but applied to the world's largest fleet [13]. Replacement, not expansion, drives leasing here. Cargo is the standout: FedEx and UPS conversion programmes plus Amazon Air's leased 737-800 fleet have made North America the deepest freighter-leasing pool globally.

Europe

Country Metric Key Driver
Germany 18.2% of region Lufthansa Group fleet modernization
UK USD 9.10 Billion Charter and long-haul leisure demand
France 15.4% of region Airbus proximity and Transavia growth
Italy 8.4% CAGR ITA Airways re-fleeting under Lufthansa
Spain 9.6% of region Ryanair and Vueling base expansion
Nordic Countries USD 3.60 Billion Regional jet replacement cycles
Russia 4.1% of region Isolated fleet; parallel-import maintenance
Rest of Europe 8.2% CAGR Central European LCC penetration


Ireland remains the operational centre of gravity despite contributing modest domestic demand — roughly 60% of the world's leased fleet is domiciled there, supported by an extensive double-taxation treaty network [6]. Eurocontrol projects European flights exceeding 2019 levels by 12% in 2030, with growth concentrated in leisure and Central European markets [21].

Asia-Pacific

Country Metric Key Driver
China 31.8% of region Domestic traffic recovery and C919 induction
India 10.4% CAGR IndiGo and Air India orderbook execution
Japan USD 7.80 Billion ANA and JAL wide-body renewal
South Korea 7.6% of region Post-merger fleet rationalization
ASEAN 9.1% CAGR VietJet, AirAsia, Lion Group expansion
Rest of Asia-Pacific USD 4.20 Billion Australian and Pacific regional lift


China's leasing sector operates through bank-affiliated platforms — ICBC Leasing, CDB Aviation, BOCOM — that finance domestic carriers on terms Western lessors struggle to match [9]. India represents the sharper opportunity for the commercial aircraft leasing market, since its carriers hold the largest undelivered narrowbody orderbook in the world and lease the overwhelming majority of it [19].

South America

Country Metric Key Driver
Brazil 56.3% of region GOL and Azul post-restructuring re-fleeting
Argentina USD 2.10 Billion Aviation deregulation and route liberalization
Rest of South America 8.4% CAGR Colombian and Chilean LCC growth


Chapter 11 filings by LATAM, Avianca, and GOL reset the region's lease economics entirely. Lessors that stayed through restructuring now hold repriced portfolios with improved credit counterparties. World Bank projections put regional GDP growth near 2.6% for 2026, modest but sufficient to sustain the leisure traffic underpinning narrowbody demand [18].

Middle East & Africa

Country Metric Key Driver
Saudi Arabia 12.8% CAGR Riyadh Air launch and Vision 2030 targets
UAE 38.1% of region Emirates and flydubai wide-body renewal
South Africa USD 1.40 Billion Domestic carrier rebuild post-SAA
Egypt 7.9% of region EgyptAir modernization and tourism recovery
Rest of MEA 10.2% CAGR Ethiopian, Kenya Airways, Nigerian expansion


African carriers lease a higher share of their fleets than operators anywhere else, largely because local bank financing for aircraft barely exists [6]. Ratification of the Cape Town Convention with the Aviation Working Group's qualifying declarations reduces lease costs measurably — Ethiopia and Rwanda both secured improved terms after full compliance.


Commercial Aircraft Leasing Market By Region, 2025-2035

Competitive Benchmarking

Concentration in the commercial aircraft leasing market sits in the moderate band. Estimated HHI falls between 700 and 850, with the top five platforms controlling roughly 40–45% of leased fleet value and the top three holding about 28.2% of units. Below that tier, the field fragments quickly into regional specialists, bank-affiliated platforms, and asset managers running third-party capital.

Company Est. Revenue Share Range Key Offerings for Commercial Aircraft Leasing Market Strategic Positioning
AerCap Holdings ~13–16% Aircraft, engine and helicopter leasing; trading Scale leader post-GECAS; broadest asset mix
SMBC Aviation Capital ~7–9% Narrowbody operating leases; sale-and-leaseback Bank-backed; lowest-cost funding tier
Avolon ~6–8% Operating leases; orderbook placement Large speculative orderbook; Bohai-backed
Air Lease Corporation ~5–7% Direct OEM orders; long-term placements Pure orderbook lessor; investment grade
BOC Aviation ~4–6% Operating leases; portfolio trading Asia-anchored; strong China access
ICBC Financial Leasing ~4–6% Finance and operating leases Chinese policy-bank distribution
Dubai Aerospace Enterprise ~3–5% Operating leases; engine leasing Gulf sovereign backing; MEA reach
Carlyle Aviation Partners ~2–4% Mid-life assets; ABS structuring Alternative-asset manager model
BBAM ~2–4% Managed fleets; third-party servicing Asset-light servicing specialist
Macquarie AirFinance ~2–3% Narrowbody operating leases Post-ALAFCO scale-up
Aircastle ~1–3% Mid-life narrowbody and freighter Marubeni-backed; freighter focus
Nordic Aviation Capital ~1–3% Regional jet and turboprop leasing Regional aircraft specialist


Recent News & Developments


  • Macquarie AirFinance (May 2023): Completed the ALAFCO portfolio acquisition, adding 53 aircraft and roughly doubling platform scale in a single transaction [10]
  • IFSCA, India (January 2024): Extended tax-neutral treatment to aircraft and engine leasing at GIFT City, licensing over 30 entities within eighteen months [19]


  • UNIDROIT / Aviation Working Group (July 2024): Confirmed Ethiopia's full Cape Town Convention compliance, unlocking lower lease pricing for African carriers [6]
  • Riyadh Air (October 2025): Signed lease commitments covering its initial wide-body fleet ahead of scheduled network launch [20]


Commercial Aircraft Leasing Market Report Scope

Parameter Detail
Market Scope Global commercial aircraft leasing market covering leasing type, aircraft type, end user, lease duration, and geography
Study Period 2021–2035 (Historical 2021–2024; Base Year 2025; Forecast 2026–2035)
CAGR 7.8% (2026–2035)
Market Size Checkpoints 2025: USD 192.60 Billion; 2026: USD 207.60 Billion; 2035: USD 408.10 Billion
Fastest Growing Segments Freighter/P2F (9.6% CAGR); Wet Lease (8.8% CAGR); Middle East & Africa (9.9% CAGR)
Companies Profiled 12 major lessors including AerCap, SMBC Aviation Capital, Avolon, Air Lease Corporation, BOC Aviation
Valuation Currency USD Billion

FAQs

How are lease rate factors negotiated in the commercial aircraft leasing market?
Lease rate factors are set as a monthly percentage of aircraft value, typically 0.7–0.9% for new narrowbodies. Lessee credit quality, lease tenor, and delivery timing move the figure more than aircraft type does [5].
What return conditions should an airline scrutinise before signing?
Focus on engine life-limited part thresholds, C-check timing, and cabin reconfiguration obligations. These clauses routinely cost carriers eight figures at redelivery and are far more negotiable at signing than most lessees assume [8].
Which financing structures dominate the commercial aircraft leasing market today?
Unsecured bonds fund investment-grade lessors, while asset-backed securitization serves mid-life portfolios. Export credit agency support has shrunk substantially since 2015 and now covers a small minority of deliveries [17].
How does aircraft age change maintenance reserve requirements?
Reserves are usually waived for strong-credit lessees on new aircraft but become mandatory beyond twelve years. Monthly cash reserves on an aged narrowbody can approach half the base rent [16].
What role does aviation ABS play in the commercial aircraft leasing market?
Securitization lets lessors recycle capital by selling portfolios into bankruptcy-remote vehicles while retaining servicing fees. It converts a balance-sheet business into a fee-generating asset management model [17].
How do lessors manage repossession risk across jurisdictions?
Cape Town Convention ratification with qualifying declarations is the primary screen. Where protections are weak, lessors demand larger deposits, shorter tenors, and Irish-law governed leases with offshore security structures [6].
Is engine leasing counted separately from airframe leasing?
Yes. Spare engine leasing operates as a distinct market with different tenors and pricing, though several major lessors run both businesses under one platform [4].
Author
Author
Author Profile
Shubham Munde LinkedIn
Team Lead - Research
Shubham brings over 7 years of expertise in Market Intelligence and Strategic Consulting, with a strong focus on the Automotive, Aerospace, and Defense sectors. Backed by a solid foundation in semiconductors, electronics, and software, he has successfully delivered high-impact syndicated and custom research on a global scale. His core strengths include market sizing, forecasting, competitive intelligence, consumer insights, and supply chain mapping. Widely recognized for developing scalable growth strategies, Shubham empowers clients to navigate complex markets and achieve a lasting competitive edge. Trusted by start-ups and Fortune 500 companies alike, he consistently converts challenges into strategic opportunities that drive sustainable growth.
Co-Author
Co-Author Profile
Aarti Dhapte LinkedIn
AVP - Research
A consulting professional focused on helping businesses navigate complex markets through structured research and strategic insights. I partner with clients to solve high-impact business problems across market entry strategy, competitive intelligence, and opportunity assessment. Over the course of my experience, I have led and contributed to 100+ market research and consulting engagements, delivering insights across multiple industries and geographies, and supporting strategic decisions linked to $500M+ market opportunities. My core expertise lies in building robust market sizing, forecasting, and commercial models (top-down and bottom-up), alongside deep-dive competitive and industry analysis. I have played a key role in shaping go-to-market strategies, investment cases, and growth roadmaps, enabling clients to make confident, data-backed decisions in dynamic markets.

Research Approach


Secondary Research

The secondary research process involved comprehensive analysis of aviation regulatory databases, industry publications, financial reports, and authoritative aerospace organizations. Key sources included the Federal Aviation Administration (FAA), European Union Aviation Safety Agency (EASA), International Air Transport Association (IATA), International Civil Aviation Organization (ICAO), Boeing Commercial Market Outlook, Airbus Global Market Forecast, FlightGlobal Fleet Forecast, Ascend by Cirium, Aviation Week Intelligence Network, CAPA - Centre for Aviation, International Society of Transport Aircraft Trading (ISTAT), Airfinance Journal, Bureau of Transportation Statistics (BTS), Civil Aviation Administration of China (CAAC), and national aviation authority reports from key markets. These sources were used to collect fleet statistics, lease transaction data, regulatory compliance frameworks, airline financial performance, and market landscape analysis for narrow-body aircraft, wide-body aircraft, regional aircraft, and cargo aircraft leasing segments.


Primary Research

In order to gather both qualitative and quantitative insights, supply-side and demand-side stakeholders were interviewed during the primary research process. CEOs, CIOs, heads of fleet planning, and commercial directors from airplane leasing firms, banks, and OEMs were examples of supply-side sources. Chief financial officers, fleet managers, procurement leads from airlines, cargo carriers, and private charter operators were examples of demand-side sources. In addition to gathering information on lease rate trends, financing arrangements, and fleet modernization tactics, primary research verified market segmentation and aircraft delivery schedules.

Primary Respondent Breakdown:

By Designation: C-level Primaries (32%), Director Level (30%), Others (38%)

By Region: North America (32%), Europe (30%), Asia-Pacific (28%), Rest of World (10%)


Market Size Estimation

Global market valuation was derived through lease portfolio valuation and fleet analysis. The methodology included:

Identification of 50+ key lessors across North America, Europe, Asia-Pacific, and Latin America

Aircraft mapping across narrow-body, wide-body, regional, and cargo aircraft categories

Analysis of reported and modeled lease revenues specific to aircraft portfolios

Coverage of lessors representing 75-80% of global leased fleet value in 2024

Extrapolation using bottom-up (aircraft count × lease rate by type) and top-down (lessor portfolio validation) approaches to derive segment-specific valuations

Download Free Sample

Kindly complete the form below to receive a free sample of this Report

* Please use a valid business email

Download PDF ×

We do not share your information with anyone. However, we may send you emails based on your report interest from time to time. You may contact us at any time to opt-out.

















