Commercial Greenhouse Market (2026 - 2035)

Commercial Greenhouse Market Size, Share, Industry Trend & Analysis Research Report: By Equipment Type (LED Grow Lighting, Heating Systems, Climate Control & Automation Software, Irrigation & Fertigation Systems, Other Equipment), By Crop Type (Fruits & Vegetables, Flowers & Ornamentals, Cannabis & Specialty Crops, Nursery Plants), By Greenhouse Type (Plastic-Film Greenhouses, Glass Greenhouses, Polycarbonate Greenhouses), By Cultivation Technology (Hydroponic Systems, Soil-Based Cultivation, Hybrid & Vertical Integration, Aeroponic Systems), By End User (Commercial Growers, Research & Educational Institutes, Contract Growers) - Forecast to 2035

Forecast Period
2026-2035
CAGR
10.2%
2025 Market Size
USD 49.5 Billion
2035 Market Size
USD 131.0 Billion
Agriculture ● Updated August 24, 2026 Report ID: MRFR/Agri/20673-HCR | Pages: 128 | Author: Snehal Singh

Commercial Greenhouse Market Summary

The commercial greenhouse market reached an estimated USD 49.5 billion in 2025, setting the stage for a forecast trajectory that climbs from USD 54.6 billion in 2026 to USD 131.0 billion by 2035 at a compound annual growth rate (CAGR) of 10.2%. Retailers demanding fifty-two-week produce calendars and tightening food-safety import standards in the EU and North America have pushed grower capital into protected cultivation at a pace that open-field agriculture cannot match. The USDA's Specialty Crop Block Grant Program alone channeled over USD 85 million into greenhouse infrastructure upgrades during 2023–2024, signaling strong public-sector conviction in the commercial greenhouse market trajectory [1].

A technology shift is rewriting the economics of indoor crop production. Legacy high-pressure sodium lighting and manual climate controls are giving way to full-spectrum LED arrays and AI-orchestrated environmental management platforms that cut energy consumption by up to 40% per kilogram of harvested produce [2]. The European Commission's Horizon Europe programme earmarked EUR 120 million for controlled-environment research between 2024 and 2027, accelerating the replacement cycle for older installations [3]. This modernization wave is a core catalyst for the commercial greenhouse market expansion through 2035.

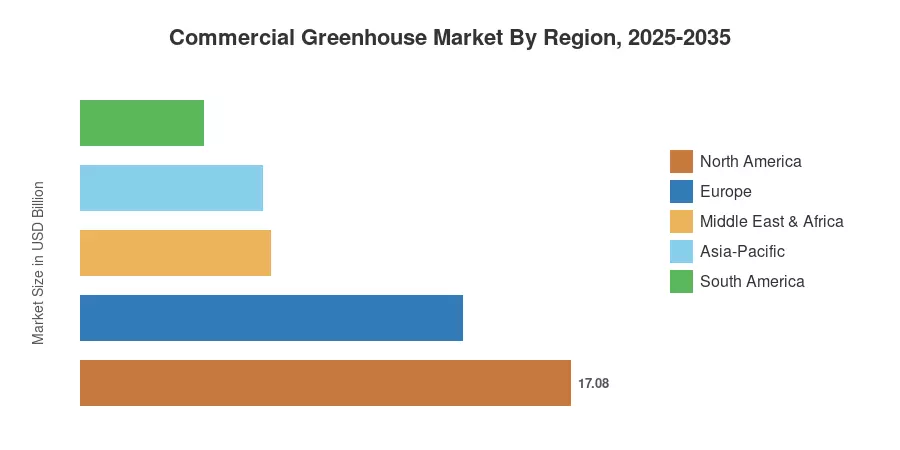
North America holds the dominant regional position with an estimated 34.5% share of 2025 revenues, driven by cannabis legalization economics and large-scale berry and tomato programs in the U.S. and Mexico. Asia-Pacific is the fastest-growing region, propelled by China's Fourteenth Five-Year Plan targets for high-standard farmland and India's National Mission for Sustainable Agriculture. Europe remains the second-largest contributor, anchored by Dutch and Spanish greenhouse clusters. The commercial greenhouse market is poised for structural growth as food-supply resilience moves up national agendas worldwide.


Key Report Takeaways

• By Equipment Type

  • LED grow lighting commanded a 32.8% share of the commercial greenhouse market in 2025, reflecting rapid adoption of energy-efficient spectrums across high-value crop operations.
  • Climate control and automation software are the fastest-growing equipment category, expanding at 14.3% CAGR during 2026–2035 as growers prioritize autonomous fertigation and HVAC integration.

• By Crop Type

  • Fruits and vegetables accounted for USD 25.5 billion within the commercial greenhouse market in 2025, underpinned by year-round tomato, pepper, and berry programs.
  • Cannabis and specialty crops represent the fastest-growing crop segment at 15.5% CAGR, led by regulated cultivation buildouts in North America and Europe.

• By Greenhouse Type

  • Plastic-film greenhouses captured a 56.3% share of the commercial greenhouse market in 2025, favored for lower capital intensity in emerging-economy installations.
  • Glass greenhouses are the fastest-growing structure type, reflecting premium growers' preference for superior light transmission.

• By Region

  • North America leads the commercial greenhouse market with 34.5% of global revenues, concentrated in U.S. and Mexican mega-greenhouse clusters.
  • Asia-Pacific is projected to register a CAGR of 12.8% through 2035, propelled by government subsidy programs in China and India.


Market Size and Forecast (2021–2035)

Market Research Future's sizing model integrates bottom-up grower CAPEX surveys, trade association shipment data, and top-down cross-validation against national agricultural statistics from FAO, USDA, and Eurostat [4]. Historical values (2021–2024) reflect actuals; 2025 is the validated base year; and 2026–2035 values are forecast using segmental growth models calibrated against policy pipelines and technology adoption curves.
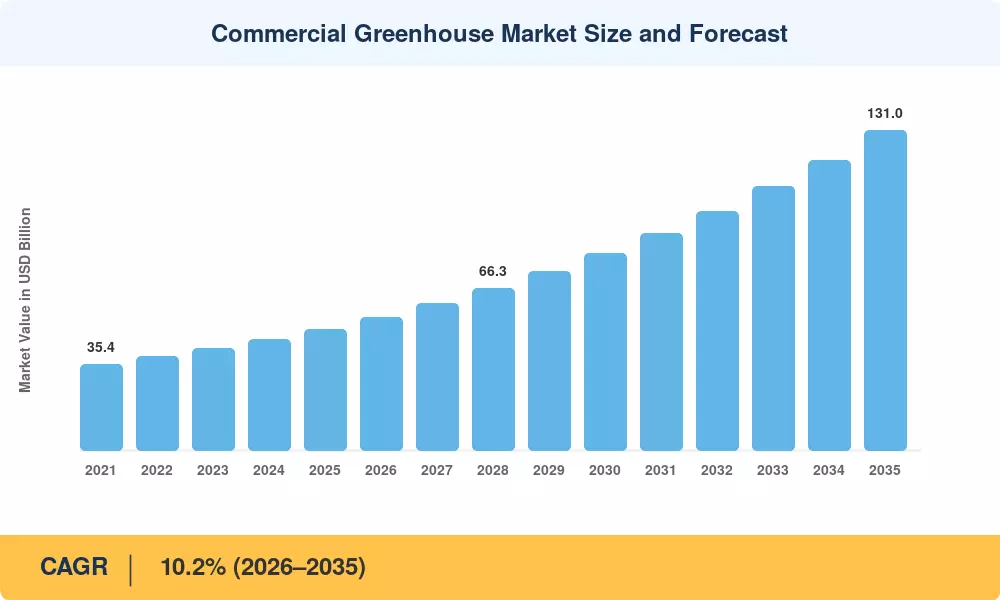
Commercial Greenhouse Market Size and Forecast
Our Impact
Enabled $4.3B Revenue Impact for Fortune 500 and Leading Multinationals
Partnering with 2000+ Global Organizations Each Year
30K+ Citations by Top-Tier Firms in the Industry

Driver Impact Analysis

Driver ~% Impact on CAGR Geographic Relevance Impact Timeline
Year-Round Produce Demand from Retail Chains ~2.1 Global Short-term (≤2 yr)
LED and Sensor Cost Deflation ~1.8 North America, Europe Medium-term (2–4 yr)
Government Subsidy and Food-Security Programmes ~1.6 Asia-Pacific, MEA Medium-term (2–4 yr)
Cannabis Legalization and Licensing Expansion ~1.4 North America, Europe Short-term (≤2 yr)
Waste-Heat Integration with Industrial Sites ~1.1 Europe, North America Long-term (≥4 yr)
AI-Driven Climate and Fertigation Optimization ~1.0 Global Long-term (≥4 yr)
ESG Supply-Chain Mandates ~0.8 Europe, North America Medium-term (2–4 yr)


Year-Round Produce Demand from Retail Chains

Major grocery retailers including Walmart, Tesco, and Carrefour have expanded 52-week local-produce shelf programs, requiring suppliers to guarantee volumes that field agriculture cannot deliver during off-seasons. A 2024 Food Marketing Institute study found that 68% of North American fresh-produce buyers now include greenhouse-origin clauses in supplier contracts, up from 41% in 2020 [1]. This structural shift compresses payback periods for new greenhouse investment and is the single largest near-term driver for the commercial greenhouse market.

LED and Sensor Cost Deflation

Full-spectrum LED fixture prices fell roughly 14% per annum between 2021 and 2024, according to the U.S. Department of Energy's Solid-State Lighting Program [2]. At current trajectories, LED grow lights will reach cost parity with high-pressure sodium fixtures on a total-cost-of-ownership basis by 2028, removing the last economic barrier for mid-tier growers. This deflation directly expands the addressable grower base in the commercial greenhouse market.

Government Subsidy and Food-Security Programmes

China's Ministry of Agriculture allocated CNY 30 billion (≈ USD 4.2 billion) for protected-cultivation facility upgrades under its 2024 Rural Revitalization Action Plan, targeting 200,000 hectares of new or upgraded structures by 2028 [7]. India's Pradhan Mantri Krishi Sinchayee Yojana offers 55% capital subsidy for greenhouse drip irrigation, lowering the entry cost for smallholder clusters. These government programs represent a structural tailwind for the commercial greenhouse market in Asia-Pacific.

Cannabis Legalization and Licensing Expansion

Germany's 2024 Cannabis Act and continued U.S. state-level legalization have triggered a fresh cycle of purpose-built cannabis greenhouse construction. The Brightfield Group estimated that the North American licensed cannabis greenhouse footprint expanded 22% year-over-year in 2024, with average facility sizes exceeding 100,000 square feet [6]. Regulatory liberalization in this category provides a high-margin demand anchor for the commercial greenhouse market.


Restraints Impact Analysis

Restraint ~% Impact on CAGR Geographic Relevance Impact Timeline
Energy-Price Volatility −1.5 Europe, North America Short-term (≤2 yr)
Multi-Vendor Interoperability Gaps −0.9 Global Medium-term (2–4 yr)
Skilled Labor Shortages −0.7 North America, Asia-Pacific Long-term (≥4 yr)
High Capital Intensity for Glass Structures −0.6 Emerging Markets Medium-term (2–4 yr)
Water-Use Regulatory Tightening −0.4 MEA, South America Long-term (≥4 yr)


Energy-Price Volatility

Natural gas and electricity account for 25–35% of operating costs in heated greenhouse environments, making energy-price swings a critical margin risk. European natural gas spot prices fluctuated by over 60% quarter-on-quarter during 2022–2023, forcing Dutch growers to idle an estimated 15% of heated greenhouse capacity during peak pricing [5]. While renewable co-generation and geothermal alternatives are expanding, the commercial greenhouse market remains sensitive to fossil-fuel price shocks in the near term.

Multi-Vendor Interoperability Gaps

Growers assembling lighting, HVAC, fertigation, and data-analytics systems from different suppliers frequently encounter proprietary communication protocols that prevent unified control. A 2024 AgFunder survey found that 52% of commercial greenhouse operators cited integration complexity as the primary barrier to full automation [15]. Standards bodies such as the GLASE consortium are working on open APIs, but meaningful interoperability will take two to four years to become the norm across the commercial greenhouse market.


Commercial Greenhouse Market Opportunities

Waste-Heat Symbiosis with Data Centers and Industry

Industrial facilities and hyperscale data centers generate waste heat that, when routed through hydronic greenhouse heating loops, can slash thermal energy costs by 50–70% [14]. Microsoft's pilot in Agriport A7, Netherlands, already channels server exhaust heat into adjacent tomato greenhouses. Scaling this model to logistics parks and cement plants represents a compelling unit-economics opportunity within the commercial greenhouse market.

Fertigation-as-a-Service and Data Monetization

Cloud-connected nutrient dosing platforms are shifting from hardware sales to subscription models, enabling growers to pay per crop cycle rather than in upfront capital. Companies like Autogrow and Priva now offer recipe-optimization tiers where anonymized crop performance data is aggregated to train machine-learning models that improve yields across the subscriber base [8]. This recurring-revenue model unlocks SaaS-style valuation multiples for equipment OEMs in the commercial greenhouse market.

Desert and Arid-Zone Greenhouse Expansion

Saudi Arabia's NEOM and Egypt's New Delta projects have earmarked over USD 2.5 billion for climate-controlled greenhouse precincts designed to reduce food-import dependency [10]. Saltwater-cooled greenhouse concepts pioneered by Sundrop Farms demonstrate that extreme environments can become viable production zones when paired with solar desalination.

Pharmaceutical and Nutraceutical Crop Diversification

Growing regulatory acceptance of greenhouse-grown botanical ingredients for pharmaceutical and dietary-supplement supply chains opens a premium pricing tier. The FDA's 2024 guidance on botanical drug master files now explicitly recognizes controlled-environment origin as a quality differentiator, expanding the addressable crop portfolio within the commercial greenhouse market [18].

Carbon-Credit Monetization from Reduced Field Emissions

Greenhouse cultivation on a per-kilogram basis produces 30–50% fewer scope-1 emissions than comparable open-field operations when energy is sourced renewably [12]. Emerging verified carbon methodologies from Verra and Gold Standard are creating tradeable credits for greenhouse growers who document displaced field emissions, introducing a new revenue stream for the commercial greenhouse market.


Commercial Greenhouse Market Future Outlook

Autonomous Greenhouse Operations

By 2030, Tier-1 greenhouse operators are expected to deploy fully autonomous grow-cycle management, where AI platforms adjust lighting spectrum, CO₂ dosing, temperature, and nutrient flow without human intervention. Google DeepMind's collaboration with WUR (Wageningen University & Research) demonstrated a 10% yield uplift over experienced human growers in controlled lettuce trials [11]. Autonomous operations will compress labor requirements and reposition the commercial greenhouse market as a capital-intensive, high-throughput manufacturing discipline.

Energy Transition and On-Site Renewables

Falling solar PV costs—below USD 0.03/kWh in favorable geographies per IRENA's 2024 benchmark—make on-site renewable generation economically attractive for greenhouse operators [19]. Combined heat-and-power (CHP) units fueled by biogas and geothermal loops are displacing natural gas in Northern European greenhouses. This energy transition reshapes the cost structure of the commercial greenhouse market and de-risks operations against fossil-fuel volatility.

Platform Economics and Grower Networks

Digital marketplaces connecting greenhouse growers with retail buyers, logistics providers, and input suppliers are creating platform-style network effects. AppHarvest, Gotham Greens, and Plenty have adopted vertically integrated models that bundle growing, branding, and distribution—pointing toward a future where the commercial greenhouse market consolidates around platform operators rather than pure equipment vendors [20].

ESG Reporting and Scope-3 Traceability

The EU's Corporate Sustainability Reporting Directive (CSRD), effective 2025, requires food retailers to disclose scope-3 emissions from their supply chain. Greenhouse-grown produce with documented lower carbon intensity per kilogram gains preferential listing in ESG-aligned retailer portfolios. This regulatory push strengthens the long-term demand case for the commercial greenhouse market, as buyers assign premium shelf space to verifiably sustainable growers [12].


Commercial Greenhouse Market Segmentation

By Equipment Type

Segment Metric Primary Demand Driver
LED Grow Lighting 32.8% share (2025) Energy efficiency; spectrum tunability
Heating Systems USD 8.4 Billion (2025) Cold-climate protected cultivation
Climate Control & Automation Software 14.3% CAGR (2026–2035) AI-driven yield optimization
Irrigation & Fertigation Systems USD 7.1 Billion (2025) Water-use efficiency mandates
Other Equipment 6.2% share (2025) Covering materials, benching, sensors


LED grow lighting dominates the commercial greenhouse market equipment landscape because it delivers measurable energy savings of 40–60% over high-pressure sodium alternatives while enabling photoperiod manipulation that accelerates crop cycles. Climate control and automation software is the fastest-growing subsegment, fueled by grower demand for real-time environmental dashboards that integrate HVAC, CO₂ enrichment, and irrigation into a single decisioning layer.

By Crop Type

Segment Metric Primary Demand Driver
Fruits & Vegetables 51.6% share (2025) Year-round retail supply contracts
Flowers & Ornamentals USD 9.8 Billion (2025) Event-driven and export demand
Cannabis & Specialty Crops 15.5% CAGR (2026–2035) Legalization wave; high per-sqft revenue
Nursery Plants 7.8% share (2025) Landscape and reforestation programs


Fruits and vegetables remain the revenue backbone of the commercial greenhouse market, driven by tomatoes, peppers, cucumbers, and berries that command premium pricing under 52-week retail contracts. Cannabis and specialty crops represent the highest-growth opportunity, as licensed cultivation mandates in Germany, the U.S., and Thailand require controlled-environment facilities that meet stringent regulatory traceability standards.

By Greenhouse Type

Segment Metric Primary Demand Driver
Plastic-Film Greenhouses 56.3% share (2025) Low CAPEX; scalability in emerging markets
Glass Greenhouses 13.2% CAGR (2026–2035) Superior light transmission; premium crops
Polycarbonate Greenhouses USD 5.6 Billion (2025) Insulation performance; mid-cost positioning


Plastic-film structures dominate because of their lower build cost per square meter—roughly 40–60% less than glass—which appeals to growers in China, India, and Latin America scaling capacity rapidly. Glass greenhouses are the fastest-growing type in the commercial greenhouse market as Tier-1 operators in the Netherlands and North America invest in Venlo-style structures that maximize photosynthetically active radiation for premium tomato and berry cultivars.

By Cultivation Technology

Segment Metric Primary Demand Driver
Hydroponic Systems 50.5% share (2025) Water savings; soilless precision
Soil-Based Cultivation USD 12.8 Billion (2025) Traditional grower transition pathway
Hybrid & Vertical Integration 12.1% CAGR (2026–2035) Urban proximity; multi-tier space efficiency
Aeroponic Systems 4.3% share (2025) Leafy-green and herb micro-farming


Hydroponic systems hold the largest share of the commercial greenhouse market cultivation segment due to their 80–90% reduction in water use versus soil-based methods and compatibility with recirculating nutrient-film and deep-water culture configurations. Hybrid and vertical integration models are growing fastest as operators co-locate greenhouse bays with indoor vertical racks to diversify crop mixes within a single facility footprint.

By End User

Segment Metric Primary Demand Driver
Commercial Growers 51.2% share (2025) Produce supply contracts; cannabis licensing
Research & Educational Institutes 13.8% CAGR (2026–2035) Breeding programs; ag-tech pilot sites
Contract Growers USD 7.4 Billion (2025) Retailer-owned growing programs


Commercial growers constitute the core demand base for the commercial greenhouse market, ranging from family-scale berry operations in Spain to 80-hectare mega-greenhouses operated by Mastronardi Produce and Village Farms International in North America. Research and educational institutes represent the fastest-growing end-user segment, as universities expand breeding and phenotyping greenhouse capacity under government funding mandates.


Regional Market Share Analysis

Region Metric Primary Investment Themes
North America 34.5% share (2025) Cannabis licensing; berry and tomato mega-greenhouses
Europe USD 13.3 Billion (2025) Farm-to-Fork compliance; geothermal heating
Asia-Pacific 12.8% CAGR (2026–2035) Government subsidy programs; vegetable self-sufficiency
South America USD 4.3 Billion (2025) Export-oriented floriculture; citrus nurseries
Middle East & Africa 13.4% CAGR (2026–2035) Food-security mandates; desert cooling innovations
Total USD 49.5 Billion (2025)

The commercial greenhouse market exhibits distinct regional dynamics shaped by climate, policy, and crop mix. North America dominates in revenue terms; Asia-Pacific leads in growth velocity.


North America

Country Metric Key Driver
United States 72.3% of regional share Cannabis legalization; large-scale berry programs
Canada CAGR 9.8% Federally licensed cannabis production
Mexico USD 2.1 Billion (2025) Export tomato and pepper clusters in Sinaloa, Jalisco


The United States anchors North American growth through an expanding patchwork of state cannabis licenses and Walmart-driven 52-week produce sourcing mandates. Canada's mature federal cannabis framework has shifted greenhouse investment toward efficiency upgrades. At the same time, Mexico's Sinaloa corridor continues to attract FDI from Dutch and Israeli greenhouse technology firms seeking proximity to the U.S. consumer market [1][6].

Europe

Country Metric Key Driver
Germany CAGR 11.4% Cannabis Act 2024; energy-transition subsidies
United Kingdom 18.2% of regional share Post-Brexit domestic supply initiatives
France USD 1.8 Billion (2025) Protected strawberry and melon cultivation
Italy CAGR 10.1% Southern greenhouse clusters for citrus and herbs
Spain 22.5% of regional share Almería plastic-house complex
Nordic Countries CAGR 11.8% Geothermal and waste-heat integration
Russia USD 1.1 Billion (2025) Federal import-substitution programs
Rest of Europe CAGR 9.6% Mixed horticultural modernization


Europe's commercial greenhouse market benefits from the EU's Farm-to-Fork Strategy, which requires 25% of agricultural land to be under organic production by 2030, indirectly boosting demand for pesticide-free greenhouse environments. The Netherlands remains the continent's technology exporter, while Spain's Almería cluster accounts for over 30,000 hectares of plastic-film production capacity [3].

Asia-Pacific

Country Metric Key Driver
China 38.4% of regional share Rural Revitalization; high-standard farmland targets
India CAGR 14.2% PMKSY subsidy; polyhouse floriculture
Japan USD 2.3 Billion (2025) Plant-factory modernization; aging farmer replacement
South Korea CAGR 11.6% Smart-farm government roadmap
ASEAN USD 1.4 Billion (2025) Tropical climate-buffer greenhouse expansion
Rest of Asia-Pacific CAGR 10.8% Mixed horticulture programs


China's Fourteenth Five-Year Plan targets 66 million hectares of high-standard farmland by 2030, and protected-cultivation upgrades form a core pillar of that mandate. India's polyhouse subsidy framework has catalyzed rapid expansion in Karnataka, Maharashtra, and Himachal Pradesh, while Japan's Next-Generation Greenhouse Initiative funds robotic harvesting pilots aimed at offsetting the country's demographic labor decline [7].

South America

Country Metric Key Driver
Brazil 52.1% of regional share Export floriculture; protected berry cultivation
Argentina CAGR 10.5% Olive and herb greenhouse expansion
Rest of South America USD 0.9 Billion (2025) Colombia and Ecuador cut-flower exports


Brazil's commercial greenhouse sector is anchored by the Holambra floriculture cluster in São Paulo state, which supplies the majority of Latin America's cut-flower market. Colombian rose and carnation exporters are increasingly adopting plastic-film greenhouse upgrades to meet European phytosanitary standards.

Middle East & Africa

Country Metric Key Driver
Saudi Arabia 28.6% of regional share NEOM food-security precincts
UAE CAGR 14.8% Abu Dhabi Food Security Strategy
South Africa USD 0.5 Billion (2025) Export vegetable and berry programs
Egypt CAGR 12.5% New Delta agricultural reclamation zone
Rest of MEA 21.3% of regional share Mixed horticultural development


Gulf Cooperation Council states view greenhouse agriculture as a strategic hedge against import dependency; the UAE's National Food Security Strategy 2051 targets local production of 50% of fresh vegetables by 2035. Egypt's New Administrative Capital corridor has allocated 10,000 feddan (≈ 4,200 hectares) to greenhouse precincts adjacent to reclaimed desert land [10].


Commercial Greenhouse Market By Region, 2025-2035

Competitive Benchmarking

The commercial greenhouse market exhibits medium concentration, with the top five suppliers accounting for an estimated 28–34% of global revenues. The landscape is fragmented across specialized niches: lighting OEMs, climate-software developers, structure fabricators, and turnkey integrators each command different competitive moats. No single player dominates across all value-chain layers, which creates a dynamic M&A environment as full-solution positioning becomes a strategic imperative.

Company Est. Revenue Share Range Key Offerings Strategic Positioning
Signify N.V. (Philips) ~7–10% LED grow lighting; GreenPower spectrum solutions Global lighting leader expanding into data-analytics services
Priva B.V. ~6–9% Climate computing; process automation Dutch-headquartered integrator with >3,000 installed sites
Netafim (Orbia) ~5–8% Drip irrigation; fertigation control Precision irrigation pioneer with greenhouse retrofit programs
Richel Group ~4–7% Multi-span steel and plastic-film structures French structure specialist serving European and African markets
Certhon ~3–6% Turnkey high-tech greenhouse design and build Full-cycle integrator for premium glass greenhouse projects
Ridder Group ~3–5% Climate screens; drive systems; software Screening and mechanization specialist with global distribution
Hoogendoorn Growth Management ~2–4% Process control; iSii automation platform Software-first climate controller with open-API architecture
Argus Controls ~2–4% Environmental control systems; Titan platform North American leader in cannabis greenhouse automation
Rough Brothers Inc. ~2–3% Commercial greenhouse structures; retail garden centers U.S.-based fabricator with vertically integrated glazing
Dalsem Greenhouse Technology ~2–3% Turnkey glass greenhouse construction Dutch builder specializing in large-scale tomato and pepper projects


Recent News & Developments


  • European Commission (November 2024): Released updated Farm-to-Fork implementation guidelines that require greenhouse-origin labeling on fresh produce by 2027, creating a regulatory tailwind for European protected cultivation [3].
  • Netafim (September 2024): Opened a USD 45 million fertigation manufacturing facility in Jain Hills, India, to serve the growing demand for greenhouse drip systems under India's PMKSY subsidy program [7].


  • Autogrow (April 2024): Launched its MultiGrow subscription platform offering nutrient-recipe optimization as a managed service, representing the industry's shift toward SaaS business models [8].
  • Saudi Arabia's NEOM (February 2024): Awarded a USD 320 million contract for a 500-hectare desert greenhouse precinct integrated with solar desalination, signaling large-scale Middle Eastern entry into protected cultivation [10].
  • USDA (December 2023): Renewed the Specialty Crop Block Grant Program with USD 85 million in annual funding through 2028, with greenhouse infrastructure listed as a priority investment category [1].


Commercial Greenhouse Market Report Scope

Parameter Detail
Market Scope Global commercial greenhouse market including equipment, structures, cultivation technology, and services
Study Period 2021–2035
CAGR 10.2% (2026–2035)
Market Size — Base Year (2025) USD 49.5 Billion
Market Size — Forecast End (2035) USD 131.0 Billion
Fastest Growing Segment Climate Control & Automation Software (14.3% CAGR); Cannabis & Specialty Crops (15.5% CAGR)
Companies Profiled 10 (Signify, Priva, Netafim, Richel, Certhon, Ridder, Hoogendoorn, Argus, Rough Brothers, Dalsem)
Valuation Currency USD Billion
Regions Covered North America, Europe, Asia-Pacific, South America, Middle East & Africa

FAQs

What payback period should investors expect for a mid-tech greenhouse project?
Mid-tech plastic-film greenhouses in favorable climates typically recover initial capital in four to six years when growing high-value vegetables under retail contract pricing [9]. Energy costs and local subsidy availability are the primary variables that shift that window.
How does crop-switching flexibility affect greenhouse asset valuation?
Facilities designed with modular benching and adjustable climate zones command 15–20% valuation premiums because they can pivot between vegetable, cannabis, and ornamental production as market pricing shifts [6].
What insurance considerations are unique to commercial greenhouse operations?
Greenhouse policies typically bundle hail and wind coverage for structures with crop-loss riders tied to climate-system failure, and premiums vary significantly by geography and cladding material [9].
How do water-recycling regulations vary across major producing regions?
The Netherlands mandates near-zero nutrient discharge from greenhouse effluent, while most U.S. states lack comparable closed-loop requirements, creating uneven compliance costs for multinational operators [17].
What role do carbon credits play in greenhouse revenue models?
Verified emission-reduction credits under Verra's VM0045 methodology can add USD 2–5 per square meter annually for growers who document displaced open-field emissions with renewable energy sourcing [12].
How are labor automation technologies reshaping workforce requirements?
Robotic harvesting and autonomous scouting platforms reduce peak-season labor needs by 20–30%, shifting hiring profiles toward technicians who manage software systems rather than manual picking crews [13].
What financing structures are most common for large-scale greenhouse builds?
Sale-leaseback and build-operate-transfer models dominate projects above USD 50 million, as institutional investors prefer yield-generating agricultural real-estate structures with contracted offtake agreements [20].    
Author
Author
Author Profile
Snehal Singh LinkedIn
Manager - Research
High acumen in analyzing complex macro & micro markets with more than 6 years of work experience in the field of market research. By implementing her analytical skills in forecasting and estimation into market research reports, she has expertise in Packaging, Construction, and Equipment domains. She handles a team size of 20-25 resources and ensures smooth running of the projects, associated marketing activities, and client servicing.
Share::
Request Free Sample
Download Free Sample

Kindly complete the form below to receive a free sample of this Report

* Please use a valid business email

Share::
Request Free Sample
Download PDF ×

We do not share your information with anyone. However, we may send you emails based on your report interest from time to time. You may contact us at any time to opt-out.
















