• Cat-intel
  • MedIntelliX
  • Resources
  • About Us
  • Hero Background
    English
    Chinese
    French
    Japanese
    Korean
    German
    Spanish

    Connected Ship Market Trends

    ID: MRFR/A&D/6620-HCR
    133 Pages
    Sejal Akre
    October 2025

    Connected Ship Market Research Report: By Technology (Internet of Things, Cloud Computing, Blockchain, Artificial Intelligence, Satellite Communication), By Ship Type (Cargo Ships, Passenger Ships, Fishing Vessels, Naval Ships), By Application (Fleet Management, Cargo Tracking, Safety and Security, Fuel Management), By End Use (Commercial, Government, Research) and By Regional (North America, ...

    Share:
    Download PDF ×

    We do not share your information with anyone. However, we may send you emails based on your report interest from time to time. You may contact us at any time to opt-out.

    Connected Ship Market Infographic
    $ 4,950.0
    $ 5,950.0
    $ 7,250.0

    Market Trends

    Key Emerging Trends in the Connected Ship Market

    The digitalization wave in the maritime field has resulted in increased adoption of IoT supported systems on board vessels. Hence this is one major trend shaping today’s market because businesses are constantly using advanced monitoring devices to inspect their overall operation efficiency in terms of performance enhancement but also smart decision making process for operational cost reduction purposes; concerning safety improvement regarding navigation hazards at sea. Moreover, there has been a significant shift due to modern communication channels that has greatly influenced how business is done regarding connected ships. It provides efficient connection between high speed satellite communications along with advanced sensors, making it possible to communicate between offshore control centers and ships themselves. This facilitates real-time data communication, thereby improving awareness of the situation and ability to respond faster to accidents and potential threats on shipping. Another notable change in this industry has been the incorporation of connectivity advancements into navigation and fleet management. Based on various inputs, automated systems like dynamic positioning systems also called DPs or collision avoidance systems help to improve navigation precision and minimize probable incidents. These technologies have played a role towards safe maritime practices by reducing risk involved. The connected ship market is experiencing growing concerns regarding cyber threats as ships increasingly depend on digital systems. The key aspect that cannot be overemphasized when talking about such security problems is embedding robust cybersecurity measures prior to any attack aimed at compromising vessel’s systems and data. With increasing attention being paid to cyber security issues within the field there is now a trend towards developing and implementing specific cybersecurity solutions for maritime environments considering their unique context.

    Market Summary

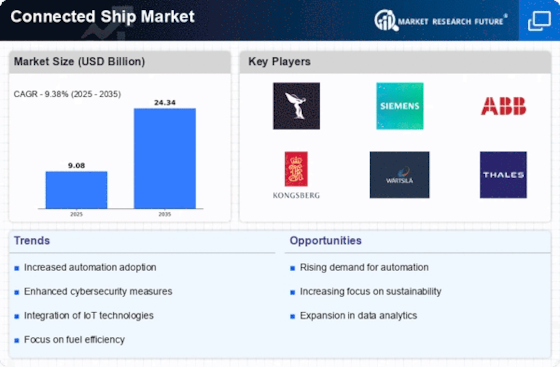
    The Global Connected Ship Market is projected to grow from 8.38 USD Billion in 2024 to 24.3 USD Billion by 2035, reflecting a robust growth trajectory.

    Key Market Trends & Highlights

    Connected Ship Key Trends and Highlights

    • The market is expected to experience a compound annual growth rate (CAGR) of 10.18% from 2025 to 2035.
    • By 2035, the market valuation is anticipated to reach 24.3 USD Billion, indicating substantial growth opportunities.
    • In 2024, the market is valued at 8.38 USD Billion, laying a solid foundation for future expansion.
    • Growing adoption of connected technologies due to increasing demand for operational efficiency is a major market driver.

    Market Size & Forecast

    2024 Market Size 8.38 (USD Billion)
    2035 Market Size 24.3 (USD Billion)
    CAGR (2025-2035) 10.18%
    Largest Regional Market Share in 2024 latin_america)

    Major Players

    General Electric, L3 Harris Technologies, Siemens, Thales Group, Honeywell, Inmarsat, Rolls Royce, Nauticus, SAP, Raytheon Technologies, Cisco Systems, IBM, Wärtsilä, Kongsberg Gruppen, Boeing

    Market Trends

    The growing need for improved operational efficiency and safety in marine operations is fueling the notable expansion of the Connected Ship Market. Real-time data collecting made possible by the growing use of Internet of Things (IoT) devices on ships improves decision-making and lowers operating expenses.

    Furthermore, ship operators are being prompted to implement linked technology that reduce emissions and maximize fuel efficiency due to the growing regulatory emphasis on environmental compliance. The industry's overarching objectives of lowering carbon footprints and increasing energy efficiency are in line with this emphasis on sustainability.

    This market has a lot of untapped potential, especially for creating sophisticated data analytics tools and predictive maintenance programs.

    As shipping companies look to enhance their competitive edge, the integration of artificial intelligence and machine learning in connected ship systems can offer valuable insights for fleet management, route optimization, and asset tracking.

    Furthermore, partnerships between technology companies and shipping industry players are likely to create innovative solutions that cater to specific maritime needs.

    Recent trends indicate a shift towards smart shipping solutions, with a growing emphasis on cybersecurity measures. As vessels become more interconnected, the risk of cyber threats increases, pushing stakeholders to invest in robust security frameworks.

    Additionally, there is a notable trend toward the adoption of automation and autonomous ships, which could revolutionize logistics and operational models. The integration of digital twin technology is also emerging, providing a virtual representation of physical vessels to simulate different scenarios, thereby improving efficiency and effectiveness in operations.

    Overall, the Connected Ship Market presents a dynamic landscape ripe for innovation and expansion.

    The integration of advanced digital technologies in maritime operations is poised to enhance operational efficiency and safety, reflecting a transformative shift in the global shipping industry.

    U.S. Department of Transportation

    Connected Ship Market Market Drivers

    Regulatory Compliance

    The Global Connected Ship Market Industry is significantly influenced by stringent regulatory compliance requirements aimed at enhancing maritime safety and environmental protection. Governments worldwide are implementing regulations that mandate the adoption of connected technologies to monitor emissions, ensure vessel safety, and improve operational transparency. For example, the International Maritime Organization has established guidelines that encourage the use of digital technologies for better compliance with environmental standards. This regulatory push not only drives the adoption of connected ship technologies but also fosters innovation within the industry, as companies seek to develop solutions that meet these evolving standards.

    Market Growth Projections

    The Global Connected Ship Market Industry is projected to experience substantial growth over the coming years. With an estimated market value of 8.38 USD Billion in 2024, it is anticipated to reach 24.3 USD Billion by 2035. This growth trajectory indicates a compound annual growth rate of 10.18% from 2025 to 2035. Such projections reflect the increasing adoption of connected technologies across the maritime sector, driven by factors such as technological advancements, regulatory compliance, and a growing emphasis on sustainability. The market's expansion is indicative of the broader trends shaping the future of maritime operations.

    Technological Advancements

    The Global Connected Ship Market Industry is experiencing rapid technological advancements that enhance operational efficiency and safety. Innovations such as the Internet of Things (IoT), artificial intelligence, and big data analytics are being integrated into maritime operations. These technologies enable real-time monitoring of ship performance, predictive maintenance, and improved navigation systems. For instance, the implementation of IoT devices allows for seamless communication between vessels and shore-based operations, leading to optimized fuel consumption and reduced operational costs. As a result, the market is projected to grow from 8.38 USD Billion in 2024 to 24.3 USD Billion by 2035, reflecting a robust CAGR of 10.18% from 2025 to 2035.

    Growing Focus on Sustainability

    The Global Connected Ship Market Industry is increasingly aligning with global sustainability goals, driven by the need to reduce the environmental impact of maritime operations. Shipping companies are adopting connected technologies to monitor and manage emissions more effectively, thereby contributing to international efforts to combat climate change. For example, the integration of real-time data analytics enables vessels to optimize fuel usage, leading to lower greenhouse gas emissions. This shift towards sustainable practices not only meets regulatory requirements but also appeals to environmentally conscious consumers, further driving the adoption of connected ship technologies within the industry.

    Market Expansion in Emerging Economies

    The Global Connected Ship Market Industry is poised for expansion in emerging economies, where maritime trade is rapidly growing. Countries in Asia-Pacific and Africa are investing in port infrastructure and shipping capabilities, leading to increased demand for connected ship technologies. For instance, nations such as India and Nigeria are enhancing their maritime sectors to boost economic growth, creating opportunities for connected solutions that improve operational efficiency and safety. This trend is likely to contribute to the overall growth of the market, as these regions adopt advanced technologies to modernize their shipping industries.

    Increased Demand for Operational Efficiency

    The Global Connected Ship Market Industry is witnessing a growing demand for operational efficiency among shipping companies. As competition intensifies, operators are increasingly seeking ways to reduce costs and enhance productivity. Connected ship technologies facilitate this by providing insights into fuel consumption, maintenance needs, and route optimization. For instance, data analytics can identify inefficiencies in operations, allowing companies to make informed decisions that lead to cost savings. This focus on efficiency is expected to propel the market forward, as companies recognize the potential for connected technologies to streamline operations and improve overall profitability.

    Market Segment Insights

    Connected Ship Market Technology Insights

    Connected Ship Market Technology Insights

    The Technology segment of the Connected Ship Market played a crucial role in enhancing the operational efficiency and safety of maritime activities.

    The Internet of Things (IoT) was a major player in this market, valued at 2.1 USD Billion in 2023 and expected to grow to 4.8 USD Billion by 2032. This significant valuation underscores IoT's impact on real-time monitoring, asset tracking, and data collection, which are essential for enhancing decision-making and efficiency within maritime operations.

    Meanwhile, Cloud Computing was valued at 1.8 USD Billion in 2023, anticipated to reach 4.1 USD Billion by 2032, indicative of its importance in managing vast amounts of data generated by ships and facilitating collaboration across different stakeholder platforms. The growing reliance on cloud services supported seamless communication and ensures data availability and security, which were vital for connected maritime ecosystems.

    In addition, Blockchain technology, while valued lower at 0.9 USD Billion in 2023, is expected to grow to 1.8 USD Billion by 2032. Its increasing significance stemmed from its ability to enhance transparency and efficiency in shipping transactions, reducing fraud and enabling more efficient supply chain management.

    Collectively, the insights from these Technology sub-segments highlighted a growing trend towards smarter, more interconnected ships that leverage innovative technologies to enhance maritime operations, driving significant market growth in the Connected Ship Market revenue.

    Moreover, market growth in the Technology segment was supported by increased investments in digital transformation, the need for enhanced safety standards, and the adoption of sustainable shipping practices, presenting numerous opportunities while also navigating challenges such as cybersecurity risks and the need for regulatory compliance in these rapidly evolving technologies.

    Source: Primary Research, Secondary Research, Market Research Future Database and Analyst Review

    Connected Ship Market Ship Type Insights

    The Connected Ship Market exhibits diverse opportunities and growth across different ship types. Cargo ships hold a significant position, reflecting the continuing demand for efficient transportation of goods, which is driven by global trade activities.

    Passenger ships are increasingly incorporating connected technologies to enhance passenger experiences, making this segment noteworthy for industry players. Fishing vessels are also crucial as advancements in connectivity help improve catch efficiency and sustainability practices.

    Meanwhile, naval ships are adopting smart technologies to bolster security and operational effectiveness, reflecting the increasing emphasis on defense capabilities and maritime safety. The overall segmentation of the Connected Ship Market illustrates a dynamic landscape where each ship type contributes uniquely to the market growth, driven by technological advancements and evolving maritime needs.

    With the consistent integration of IoT, AI, and data analytics, the market is poised for notable advancements, setting the stage for significant changes in maritime operations and management.

    The continuous evolution in these segments fuels the growth and innovation within the broader Connected Ship Market

    Connected Ship Market Application Insights

    Connected Ship Market Application Insights

    The Connected Ship Market showcases a robust and evolving landscape within its Application segment, which includes key areas such as Fleet Management, Cargo Tracking, Safety and Security, and Fuel Management. This segment is pivotal as it enhances operational efficiencies and promotes safety in maritime activities.

    Fleet Management is significant as it aids in real-time monitoring and optimization of shipping routes, thus improving cost-effectiveness. Cargo Tracking plays a crucial role in ensuring transparency and reliability throughout the shipping process, which is critical for maintaining customer trust in supply chains.

    Safety and Security applications are increasingly vital, addressing the growing concerns of cyber threats and ensuring compliance with maritime regulations. Meanwhile, Fuel Management helps in optimizing fuel consumption, presenting a cost reduction opportunity while promoting sustainability in shipping operations.

    This comprehensive Application segment facilitates not just better decision-making but also contributes to the overall growth of the Connected Ship Market, reflecting changing trends and increasing investments in digital technologies across maritime operations.

    Connected Ship Market End Use Insights

    The Connected Ship Market is expected to witness significant growth in the End Use segment, driven by the increasing demand for connectivity in maritime operations. Within this sector, both commercial and government applications play crucial roles, with the commercial segment leading the majority holding due to the rising need for real-time data analytics and improved logistics.

    The government sector is integral as well, focusing on enhancing national security through the integration of connected technologies in naval operations. Research applications also contribute to this market, providing innovative solutions and fostering advancements within the industry.

    As the Connected Ship Market statistics suggest, ongoing investments in digital infrastructure and innovations in analytics drive this segment's growth, overcoming challenges such as cyber threats and data management complexities while creating opportunities for improved performance and sustainability.

    Get more detailed insights about Connected Ship Market Research Report - Global Forecast till 2032

    Regional Insights

    North America led with a significant valuation of 3.2 USD Billion, projected to grow to 7.2 USD Billion by 2032, showcasing its dominance in embracing connected technologies. Europe followed closely with a valuation of 2.5 USD Billion in 2023, expected to reach 5.5 USD Billion, driven by advancements in maritime regulations and technological integration.

    The APAC region, valued at 2.0 USD Billion, is anticipated to grow to 4.5 USD Billion, emphasizing the region's increasing investment in smart shipping solutions.

     South America and MEA, while smaller, played crucial roles with valuations of 0.4 USD Billion and 0.2 USD Billion in 2023 respectively, growing to 1.0 USD Billion and 0.4 USD Billion by 2032.

    The Connected Ship Market statistics reflected a trend towards enhanced operational efficiency and environmental compliance across all regions, presenting opportunities driven by growing demand for digital solutions in maritime operations.

    Connected Ship Market Regional Insights

    Source: Primary Research, Secondary Research, Market Research Future Database and Analyst Review

    Key Players and Competitive Insights

    The Connected Ship Market is evolving rapidly as the maritime industry increasingly integrates advanced technologies to improve operational efficiency, safety, and sustainability. This competitive landscape comprises key players offering innovative solutions in areas like vessel tracking, predictive maintenance, cybersecurity, and overall fleet management.

    The demand for real-time data analytics and enhanced connectivity on ships is leading to significant transformations in shipping logistics, operations, and services. Companies are increasingly collaborating and forming strategic partnerships in order to bolster their positions in this dynamic market.

    As digital transformation within the maritime sector accelerates, organizations that can leverage data-driven insights and next-generation communication technologies will gain a competitive edge and redefine the traditional paradigms of maritime operations.

    General Electric has established a strong presence in the Connected Ship Market through its extensive portfolio of technology solutions tailored to the maritime industry. The company's significant investments in digital technologies have enabled it to develop advanced analytics and IoT-driven platforms that enhance operational efficiency and drive cost savings for ship operators.

    General Electric's strengths lie in its ability to integrate advanced industrial software with hardware capabilities, which helps customers optimize asset performance and improve safety onboard. Their comprehensive approach to data interoperability and platform connectivity allows for seamless information flow between vessels and shore-based operations.

    Furthermore, General Electric's commitment to sustainability and reducing the carbon footprint of maritime operations positions it as a key player poised to shape the future of the connected shipping landscape.

    L3 Harris Technologies is another prominent entity in the Connected Ship Market, recognized for its cutting-edge communication systems and technology solutions. The company's strong focus on enhancing maritime security and situational awareness empowers operators to make informed decisions rapidly.

    L3 Harris Technologies stands out through its innovative maritime communication systems that integrate satellite and terrestrial networks, ensuring robust connectivity even in remote areas. The enterprise excels in delivering solutions that enhance maritime situational awareness by offering real-time monitoring and tracking capabilities.

    Their advanced sensors and data processing technologies provide valuable insights, facilitating better decision-making in navigation and fleet management. The merging of communication, surveillance, and data analytics in L3 Harris Technologies' offerings strengthens its impact on the connected ship ecosystem while meeting the growing safety and efficiency demands of the modern maritime industry.

    Key Companies in the Connected Ship Market market include

    Industry Developments

    Recent developments in the Connected Ship Market indicate significant activity among key players. In particular, companies such as General Electric and Siemens are advancing their digital solutions to enhance operational efficiency in shipping.

    Thales Group and Honeywell have introduced new cybersecurity measures to protect connected vessels from increasing cyber threats. Meanwhile, Inmarsat and Rolls Royce are collaborating to enhance satellite communication services tailored for crew welfare and vessel performance monitoring.

    In terms of mergers and acquisitions, there has been notable activity; for instance, Kongsberg Gruppen has recently acquired a technology firm specializing in maritime automation, which complements its existing portfolio. Additionally, Raytheon Technologies and Cisco Systems are exploring synergies in IoT applications for maritime solutions, aiming for enhanced connectivity onboard vessels.

    The market valuation of companies like IBM and Wärtsilä has been positively impacted by these strategic initiatives, reflecting a growing demand for smart shipping technologies and data analytics. As these companies innovate and consolidate, the connected ship sector continues its trajectory toward increased efficiency and sustainability within the global maritime industry.

    Future Outlook

    Connected Ship Market Future Outlook

    The Global Connected Ship Market is projected to grow at a 10.18% CAGR from 2024 to 2035, driven by advancements in IoT, enhanced connectivity, and regulatory support.

    New opportunities lie in:

    • Develop AI-driven predictive maintenance solutions for fleet optimization.
    • Invest in cybersecurity frameworks to protect connected maritime systems.
    • Create partnerships with tech firms to enhance data analytics capabilities.

    By 2035, the Connected Ship Market is expected to be a pivotal component of maritime innovation and efficiency.

    Market Segmentation

    Connected Ship Market End Use Outlook

    • North America
    • Europe
    • South America
    • Asia Pacific
    • Middle East and Africa

    Connected Ship Market Regional Outlook

    • North America
    • Europe
    • South America
    • Asia Pacific
    • Middle East and Africa

    Connected Ship Market Ship Type Outlook

    • Fleet Management
    • Cargo Tracking
    • Safety and Security
    • Fuel Management

    Connected Ship Market Technology Outlook

    • Cargo Ships
    • Passenger Ships
    • Fishing Vessels
    • Naval Ships

    Connected Ship Market Application Outlook

    • Commercial
    • Government
    • Research

    Report Scope

    Report Attribute/Metric Details
    Market Size 2022 7.59(USD Billion)
    Market Size 2023 8.3(USD Billion)
    Market Size 2032 18.6(USD Billion)
    Compound Annual Growth Rate (CAGR) 9.38% (2024 - 2032)
    Report Coverage Revenue Forecast, Competitive Landscape, Growth Factors, and Trends
    Base Year 2023
    Market Forecast Period 2024 - 2032
    Historical Data 2019 - 2023
    Market Forecast Units USD Billion
    Key Companies Profiled General Electric, L3 Harris Technologies, Siemens, Thales Group, Honeywell, Inmarsat, Rolls Royce, Nauticus, SAP, Raytheon Technologies, Cisco Systems, IBM, Wärtsilä, Kongsberg Gruppen, Boeing
    Segments Covered Technology, Ship Type, Application, End Use, Regional
    Key Market Opportunities Enhanced ship operational efficiency, Real-time data analytics implementation, IoT integration for predictive maintenance, Advanced cybersecurity solutions for vessels, Sustainable fuel consumption monitoring
    Key Market Dynamics Increasing maritime digitization, Enhanced operational efficiency, Regulatory compliance requirements, Cybersecurity concerns, Growing demand for real-time data
    Countries Covered North America, Europe, APAC, South America, MEA

    Market Highlights

    Author

    Sejal Akre
    Senior Research Analyst

    She holds an experience of about 6+ years in market research and business consulting, working under the spectrum of information communication technology, telecommunications and semiconductor domains. aarti conceptualizes and implements a scalable business strategy and provides strategic leadership to the clients. her expertise lies in market estimation, competitive intelligence, pipeline analysis, customer assessment, etc.

    Leave a Comment

    Latest Comments

    John Doe
    john@example.com

    This is a great article! Really helped me understand the topic better.

    Posted on July 23, 2025, 10:15 AM
    Jane Smith
    jane@domain.com

    Thanks for sharing this. I’ve bookmarked it for later reference.

    Posted on July 22, 2025, 7:45 PM

    FAQs

    What is the expected market size of the Connected Ship Market in 2032?

    The Connected Ship Market is expected to be valued at 18.6 USD Billion in 2032.

    What is the expected CAGR for the Connected Ship Market from 2024 to 2032?

    The expected CAGR for the Connected Ship Market from 2024 to 2032 is 9.38%.

    Which region is anticipated to have the largest market share in the Connected Ship Market by 2032?

    North America is anticipated to have the largest market share, expected to reach 7.2 USD Billion by 2032.

    What is the market size of the Internet of Things segment in the Connected Ship Market for 2032?

    The Internet of Things segment is expected to be valued at 4.8 USD Billion in 2032.

    What is the expected market value for the Cloud Computing segment in the Connected Ship Market by 2032?

    The Cloud Computing segment is expected to reach 4.1 USD Billion by 2032.

    Which companies are key players in the Connected Ship Market?

    Key players include General Electric, Siemens, Honeywell, and Rolls Royce, among others.

    What is the projected market growth for the APAC region in the Connected Ship Market by 2032?

    The APAC region is projected to grow to 4.5 USD Billion in the Connected Ship Market by 2032.

    What are the expected trends driving the Connected Ship Market from 2024 to 2032?

    Trends driving the market include advancements in IoT, AI, and increasing reliance on cloud computing.

    What is the market value for the Satellite Communication segment in the Connected Ship Market by 2032?

    The Satellite Communication segment is expected to be valued at 4.4 USD Billion in 2032.

    What is the expected market value for the European segment of the Connected Ship Market in 2032?

    The European segment is expected to reach 5.5 USD Billion in the Connected Ship Market by 2032.

    1. Table of Contents
    2. Executive Summary
      1. Market Overview
      2. Key Findings
      3. Market Segmentation
      4. Competitive Landscape
      5. Challenges and Opportunities
      6. Future Outlook
    3. Market Introduction
      1. Definition
      2. Scope of the Study
        1. Research Objective
        2. Assumption
        3. Limitations
    4. Research Methodology
      1. Overview
      2. Data Mining
      3. Secondary Research
      4. Primary Research
        1. Primary Interviews and Information Gathering Process
        2. Breakdown of Primary Respondents
      5. Forecasting Model
      6. Market Size Estimation
        1. Bottom-up Approach
        2. Top-Down Approach
      7. Data Triangulation
      8. Validation
    5. MARKET DYNAMICS
      1. Overview
      2. Drivers
      3. Restraints
      4. Opportunities
    6. MARKET FACTOR ANALYSIS
      1. Value chain Analysis
      2. Porter's Five Forces Analysis
        1. Bargaining Power of Suppliers
        2. Bargaining Power of Buyers
        3. Threat of New Entrants
        4. Threat of Substitutes
        5. Intensity of Rivalry
      3. COVID-19 Impact Analysis
        1. Market Impact Analysis
        2. Regional Impact
        3. Opportunity and Threat Analysis
    7. CONNECTED SHIP MARKET, BY TECHNOLOGY (USD BILLION)
      1. Internet of Things
      2. Cloud Computing
      3. Blockchain
      4. Artificial Intelligence
      5. Satellite Communication
    8. CONNECTED SHIP MARKET, BY SHIP TYPE (USD BILLION)
      1. Cargo Ships
      2. Passenger Ships
      3. Fishing Vessels
      4. Naval Ships
    9. CONNECTED SHIP MARKET, BY APPLICATION (USD BILLION)
      1. Fleet Management
      2. Cargo Tracking
      3. Safety and Security
      4. Fuel Management
    10. CONNECTED SHIP MARKET, BY END USE (USD BILLION)
      1. Commercial
      2. Government
      3. Research
    11. CONNECTED SHIP MARKET, BY REGIONAL (USD BILLION)
      1. North America
        1. US
        2. Canada
      2. Europe
        1. Germany
        2. UK
        3. France
        4. Russia
        5. Italy
        6. Spain
        7. Rest of Europe
      3. APAC
        1. China
        2. India
        3. Japan
        4. South Korea
        5. Malaysia
        6. Thailand
        7. Indonesia
        8. Rest of APAC
      4. South America
        1. Brazil
        2. Mexico
        3. Argentina
        4. Rest of South America
      5. MEA
        1. GCC Countries
        2. South Africa
        3. Rest of MEA
    12. Competitive Landscape
      1. Overview
      2. Competitive Analysis
      3. Market share Analysis
      4. Major Growth Strategy in the Connected Ship Market
      5. Competitive Benchmarking
      6. Leading Players in Terms of Number of Developments in the Connected Ship Market
      7. Key developments and growth strategies
        1. New Product Launch/Service Deployment
        2. Merger & Acquisitions
        3. Joint Ventures
      8. Major Players Financial Matrix
        1. Sales and Operating Income
        2. Major Players R&D Expenditure. 2023
    13. COMPANY PROFILES
      1. General Electric
        1. Financial Overview
        2. Products Offered
        3. Key Developments
        4. SWOT Analysis
        5. Key Strategies
      2. L3 Harris Technologies
        1. Financial Overview
        2. Products Offered
        3. Key Developments
        4. SWOT Analysis
        5. Key Strategies
      3. Siemens
        1. Financial Overview
        2. Products Offered
        3. Key Developments
        4. SWOT Analysis
        5. Key Strategies
      4. Thales Group
        1. Financial Overview
        2. Products Offered
        3. Key Developments
        4. SWOT Analysis
        5. Key Strategies
      5. Honeywell
        1. Financial Overview
        2. Products Offered
        3. Key Developments
        4. SWOT Analysis
        5. Key Strategies
      6. Inmarsat
        1. Financial Overview
        2. Products Offered
        3. Key Developments
        4. SWOT Analysis
        5. Key Strategies
      7. Rolls Royce
        1. Financial Overview
        2. Products Offered
        3. Key Developments
        4. SWOT Analysis
        5. Key Strategies
      8. Nauticus
        1. Financial Overview
        2. Products Offered
        3. Key Developments
        4. SWOT Analysis
        5. Key Strategies
      9. SAP
        1. Financial Overview
        2. Products Offered
        3. Key Developments
        4. SWOT Analysis
        5. Key Strategies
      10. Raytheon Technologies
        1. Financial Overview
        2. Products Offered
        3. Key Developments
        4. SWOT Analysis
        5. Key Strategies
      11. Cisco Systems
        1. Financial Overview
        2. Products Offered
        3. Key Developments
        4. SWOT Analysis
        5. Key Strategies
      12. IBM
        1. Financial Overview
        2. Products Offered
        3. Key Developments
        4. SWOT Analysis
        5. Key Strategies
      13. Wärtsilä
        1. Financial Overview
        2. Products Offered
        3. Key Developments
        4. SWOT Analysis
        5. Key Strategies
      14. Kongsberg Gruppen
        1. Financial Overview
        2. Products Offered
        3. Key Developments
        4. SWOT Analysis
        5. Key Strategies
      15. Boeing
        1. Financial Overview
        2. Products Offered
        3. Key Developments
        4. SWOT Analysis
        5. Key Strategies
    14. APPENDIX
      1. References
      2. Related Reports
    15. List of Tables and Figures
      1. LIST OF TABLES
      2. TABLE 1. LIST OF ASSUMPTIONS
      3. TABLE 2. NORTH AMERICA CONNECTED SHIP MARKET SIZE ESTIMATES & FORECAST, BY TECHNOLOGY, 2019-2032 (USD BILLIONS)
      4. TABLE 3. NORTH AMERICA CONNECTED SHIP MARKET SIZE ESTIMATES & FORECAST, BY SHIP TYPE, 2019-2032 (USD BILLIONS)
      5. TABLE 4. NORTH AMERICA CONNECTED SHIP MARKET SIZE ESTIMATES & FORECAST, BY APPLICATION, 2019-2032 (USD BILLIONS)
      6. TABLE 5. NORTH AMERICA CONNECTED SHIP MARKET SIZE ESTIMATES & FORECAST, BY END USE, 2019-2032 (USD BILLIONS)
      7. TABLE 6. NORTH AMERICA CONNECTED SHIP MARKET SIZE ESTIMATES & FORECAST, BY REGIONAL, 2019-2032 (USD BILLIONS)
      8. TABLE 7. US CONNECTED SHIP MARKET SIZE ESTIMATES & FORECAST, BY TECHNOLOGY, 2019-2032 (USD BILLIONS)
      9. TABLE 8. US CONNECTED SHIP MARKET SIZE ESTIMATES & FORECAST, BY SHIP TYPE, 2019-2032 (USD BILLIONS)
      10. TABLE 9. US CONNECTED SHIP MARKET SIZE ESTIMATES & FORECAST, BY APPLICATION, 2019-2032 (USD BILLIONS)
      11. TABLE 10. US CONNECTED SHIP MARKET SIZE ESTIMATES & FORECAST, BY END USE, 2019-2032 (USD BILLIONS)
      12. TABLE 11. US CONNECTED SHIP MARKET SIZE ESTIMATES & FORECAST, BY REGIONAL, 2019-2032 (USD BILLIONS)
      13. TABLE 12. CANADA CONNECTED SHIP MARKET SIZE ESTIMATES & FORECAST, BY TECHNOLOGY, 2019-2032 (USD BILLIONS)
      14. TABLE 13. CANADA CONNECTED SHIP MARKET SIZE ESTIMATES & FORECAST, BY SHIP TYPE, 2019-2032 (USD BILLIONS)
      15. TABLE 14. CANADA CONNECTED SHIP MARKET SIZE ESTIMATES & FORECAST, BY APPLICATION, 2019-2032 (USD BILLIONS)
      16. TABLE 15. CANADA CONNECTED SHIP MARKET SIZE ESTIMATES & FORECAST, BY END USE, 2019-2032 (USD BILLIONS)
      17. TABLE 16. CANADA CONNECTED SHIP MARKET SIZE ESTIMATES & FORECAST, BY REGIONAL, 2019-2032 (USD BILLIONS)
      18. TABLE 17. EUROPE CONNECTED SHIP MARKET SIZE ESTIMATES & FORECAST, BY TECHNOLOGY, 2019-2032 (USD BILLIONS)
      19. TABLE 18. EUROPE CONNECTED SHIP MARKET SIZE ESTIMATES & FORECAST, BY SHIP TYPE, 2019-2032 (USD BILLIONS)
      20. TABLE 19. EUROPE CONNECTED SHIP MARKET SIZE ESTIMATES & FORECAST, BY APPLICATION, 2019-2032 (USD BILLIONS)
      21. TABLE 20. EUROPE CONNECTED SHIP MARKET SIZE ESTIMATES & FORECAST, BY END USE, 2019-2032 (USD BILLIONS)
      22. TABLE 21. EUROPE CONNECTED SHIP MARKET SIZE ESTIMATES & FORECAST, BY REGIONAL, 2019-2032 (USD BILLIONS)
      23. TABLE 22. GERMANY CONNECTED SHIP MARKET SIZE ESTIMATES & FORECAST, BY TECHNOLOGY, 2019-2032 (USD BILLIONS)
      24. TABLE 23. GERMANY CONNECTED SHIP MARKET SIZE ESTIMATES & FORECAST, BY SHIP TYPE, 2019-2032 (USD BILLIONS)
      25. TABLE 24. GERMANY CONNECTED SHIP MARKET SIZE ESTIMATES & FORECAST, BY APPLICATION, 2019-2032 (USD BILLIONS)
      26. TABLE 25. GERMANY CONNECTED SHIP MARKET SIZE ESTIMATES & FORECAST, BY END USE, 2019-2032 (USD BILLIONS)
      27. TABLE 26. GERMANY CONNECTED SHIP MARKET SIZE ESTIMATES & FORECAST, BY REGIONAL, 2019-2032 (USD BILLIONS)
      28. TABLE 27. UK CONNECTED SHIP MARKET SIZE ESTIMATES & FORECAST, BY TECHNOLOGY, 2019-2032 (USD BILLIONS)
      29. TABLE 28. UK CONNECTED SHIP MARKET SIZE ESTIMATES & FORECAST, BY SHIP TYPE, 2019-2032 (USD BILLIONS)
      30. TABLE 29. UK CONNECTED SHIP MARKET SIZE ESTIMATES & FORECAST, BY APPLICATION, 2019-2032 (USD BILLIONS)
      31. TABLE 30. UK CONNECTED SHIP MARKET SIZE ESTIMATES & FORECAST, BY END USE, 2019-2032 (USD BILLIONS)
      32. TABLE 31. UK CONNECTED SHIP MARKET SIZE ESTIMATES & FORECAST, BY REGIONAL, 2019-2032 (USD BILLIONS)
      33. TABLE 32. FRANCE CONNECTED SHIP MARKET SIZE ESTIMATES & FORECAST, BY TECHNOLOGY, 2019-2032 (USD BILLIONS)
      34. TABLE 33. FRANCE CONNECTED SHIP MARKET SIZE ESTIMATES & FORECAST, BY SHIP TYPE, 2019-2032 (USD BILLIONS)
      35. TABLE 34. FRANCE CONNECTED SHIP MARKET SIZE ESTIMATES & FORECAST, BY APPLICATION, 2019-2032 (USD BILLIONS)
      36. TABLE 35. FRANCE CONNECTED SHIP MARKET SIZE ESTIMATES & FORECAST, BY END USE, 2019-2032 (USD BILLIONS)
      37. TABLE 36. FRANCE CONNECTED SHIP MARKET SIZE ESTIMATES & FORECAST, BY REGIONAL, 2019-2032 (USD BILLIONS)
      38. TABLE 37. RUSSIA CONNECTED SHIP MARKET SIZE ESTIMATES & FORECAST, BY TECHNOLOGY, 2019-2032 (USD BILLIONS)
      39. TABLE 38. RUSSIA CONNECTED SHIP MARKET SIZE ESTIMATES & FORECAST, BY SHIP TYPE, 2019-2032 (USD BILLIONS)
      40. TABLE 39. RUSSIA CONNECTED SHIP MARKET SIZE ESTIMATES & FORECAST, BY APPLICATION, 2019-2032 (USD BILLIONS)
      41. TABLE 40. RUSSIA CONNECTED SHIP MARKET SIZE ESTIMATES & FORECAST, BY END USE, 2019-2032 (USD BILLIONS)
      42. TABLE 41. RUSSIA CONNECTED SHIP MARKET SIZE ESTIMATES & FORECAST, BY REGIONAL, 2019-2032 (USD BILLIONS)
      43. TABLE 42. ITALY CONNECTED SHIP MARKET SIZE ESTIMATES & FORECAST, BY TECHNOLOGY, 2019-2032 (USD BILLIONS)
      44. TABLE 43. ITALY CONNECTED SHIP MARKET SIZE ESTIMATES & FORECAST, BY SHIP TYPE, 2019-2032 (USD BILLIONS)
      45. TABLE 44. ITALY CONNECTED SHIP MARKET SIZE ESTIMATES & FORECAST, BY APPLICATION, 2019-2032 (USD BILLIONS)
      46. TABLE 45. ITALY CONNECTED SHIP MARKET SIZE ESTIMATES & FORECAST, BY END USE, 2019-2032 (USD BILLIONS)
      47. TABLE 46. ITALY CONNECTED SHIP MARKET SIZE ESTIMATES & FORECAST, BY REGIONAL, 2019-2032 (USD BILLIONS)
      48. TABLE 47. SPAIN CONNECTED SHIP MARKET SIZE ESTIMATES & FORECAST, BY TECHNOLOGY, 2019-2032 (USD BILLIONS)
      49. TABLE 48. SPAIN CONNECTED SHIP MARKET SIZE ESTIMATES & FORECAST, BY SHIP TYPE, 2019-2032 (USD BILLIONS)
      50. TABLE 49. SPAIN CONNECTED SHIP MARKET SIZE ESTIMATES & FORECAST, BY APPLICATION, 2019-2032 (USD BILLIONS)
      51. TABLE 50. SPAIN CONNECTED SHIP MARKET SIZE ESTIMATES & FORECAST, BY END USE, 2019-2032 (USD BILLIONS)
      52. TABLE 51. SPAIN CONNECTED SHIP MARKET SIZE ESTIMATES & FORECAST, BY REGIONAL, 2019-2032 (USD BILLIONS)
      53. TABLE 52. REST OF EUROPE CONNECTED SHIP MARKET SIZE ESTIMATES & FORECAST, BY TECHNOLOGY, 2019-2032 (USD BILLIONS)
      54. TABLE 53. REST OF EUROPE CONNECTED SHIP MARKET SIZE ESTIMATES & FORECAST, BY SHIP TYPE, 2019-2032 (USD BILLIONS)
      55. TABLE 54. REST OF EUROPE CONNECTED SHIP MARKET SIZE ESTIMATES & FORECAST, BY APPLICATION, 2019-2032 (USD BILLIONS)
      56. TABLE 55. REST OF EUROPE CONNECTED SHIP MARKET SIZE ESTIMATES & FORECAST, BY END USE, 2019-2032 (USD BILLIONS)
      57. TABLE 56. REST OF EUROPE CONNECTED SHIP MARKET SIZE ESTIMATES & FORECAST, BY REGIONAL, 2019-2032 (USD BILLIONS)
      58. TABLE 57. APAC CONNECTED SHIP MARKET SIZE ESTIMATES & FORECAST, BY TECHNOLOGY, 2019-2032 (USD BILLIONS)
      59. TABLE 58. APAC CONNECTED SHIP MARKET SIZE ESTIMATES & FORECAST, BY SHIP TYPE, 2019-2032 (USD BILLIONS)
      60. TABLE 59. APAC CONNECTED SHIP MARKET SIZE ESTIMATES & FORECAST, BY APPLICATION, 2019-2032 (USD BILLIONS)
      61. TABLE 60. APAC CONNECTED SHIP MARKET SIZE ESTIMATES & FORECAST, BY END USE, 2019-2032 (USD BILLIONS)
      62. TABLE 61. APAC CONNECTED SHIP MARKET SIZE ESTIMATES & FORECAST, BY REGIONAL, 2019-2032 (USD BILLIONS)
      63. TABLE 62. CHINA CONNECTED SHIP MARKET SIZE ESTIMATES & FORECAST, BY TECHNOLOGY, 2019-2032 (USD BILLIONS)
      64. TABLE 63. CHINA CONNECTED SHIP MARKET SIZE ESTIMATES & FORECAST, BY SHIP TYPE, 2019-2032 (USD BILLIONS)
      65. TABLE 64. CHINA CONNECTED SHIP MARKET SIZE ESTIMATES & FORECAST, BY APPLICATION, 2019-2032 (USD BILLIONS)
      66. TABLE 65. CHINA CONNECTED SHIP MARKET SIZE ESTIMATES & FORECAST, BY END USE, 2019-2032 (USD BILLIONS)
      67. TABLE 66. CHINA CONNECTED SHIP MARKET SIZE ESTIMATES & FORECAST, BY REGIONAL, 2019-2032 (USD BILLIONS)
      68. TABLE 67. INDIA CONNECTED SHIP MARKET SIZE ESTIMATES & FORECAST, BY TECHNOLOGY, 2019-2032 (USD BILLIONS)
      69. TABLE 68. INDIA CONNECTED SHIP MARKET SIZE ESTIMATES & FORECAST, BY SHIP TYPE, 2019-2032 (USD BILLIONS)
      70. TABLE 69. INDIA CONNECTED SHIP MARKET SIZE ESTIMATES & FORECAST, BY APPLICATION, 2019-2032 (USD BILLIONS)
      71. TABLE 70. INDIA CONNECTED SHIP MARKET SIZE ESTIMATES & FORECAST, BY END USE, 2019-2032 (USD BILLIONS)
      72. TABLE 71. INDIA CONNECTED SHIP MARKET SIZE ESTIMATES & FORECAST, BY REGIONAL, 2019-2032 (USD BILLIONS)
      73. TABLE 72. JAPAN CONNECTED SHIP MARKET SIZE ESTIMATES & FORECAST, BY TECHNOLOGY, 2019-2032 (USD BILLIONS)
      74. TABLE 73. JAPAN CONNECTED SHIP MARKET SIZE ESTIMATES & FORECAST, BY SHIP TYPE, 2019-2032 (USD BILLIONS)
      75. TABLE 74. JAPAN CONNECTED SHIP MARKET SIZE ESTIMATES & FORECAST, BY APPLICATION, 2019-2032 (USD BILLIONS)
      76. TABLE 75. JAPAN CONNECTED SHIP MARKET SIZE ESTIMATES & FORECAST, BY END USE, 2019-2032 (USD BILLIONS)
      77. TABLE 76. JAPAN CONNECTED SHIP MARKET SIZE ESTIMATES & FORECAST, BY REGIONAL, 2019-2032 (USD BILLIONS)
      78. TABLE 77. SOUTH KOREA CONNECTED SHIP MARKET SIZE ESTIMATES & FORECAST, BY TECHNOLOGY, 2019-2032 (USD BILLIONS)
      79. TABLE 78. SOUTH KOREA CONNECTED SHIP MARKET SIZE ESTIMATES & FORECAST, BY SHIP TYPE, 2019-2032 (USD BILLIONS)
      80. TABLE 79. SOUTH KOREA CONNECTED SHIP MARKET SIZE ESTIMATES & FORECAST, BY APPLICATION, 2019-2032 (USD BILLIONS)
      81. TABLE 80. SOUTH KOREA CONNECTED SHIP MARKET SIZE ESTIMATES & FORECAST, BY END USE, 2019-2032 (USD BILLIONS)
      82. TABLE 81. SOUTH KOREA CONNECTED SHIP MARKET SIZE ESTIMATES & FORECAST, BY REGIONAL, 2019-2032 (USD BILLIONS)
      83. TABLE 82. MALAYSIA CONNECTED SHIP MARKET SIZE ESTIMATES & FORECAST, BY TECHNOLOGY, 2019-2032 (USD BILLIONS)
      84. TABLE 83. MALAYSIA CONNECTED SHIP MARKET SIZE ESTIMATES & FORECAST, BY SHIP TYPE, 2019-2032 (USD BILLIONS)
      85. TABLE 84. MALAYSIA CONNECTED SHIP MARKET SIZE ESTIMATES & FORECAST, BY APPLICATION, 2019-2032 (USD BILLIONS)
      86. TABLE 85. MALAYSIA CONNECTED SHIP MARKET SIZE ESTIMATES & FORECAST, BY END USE, 2019-2032 (USD BILLIONS)
      87. TABLE 86. MALAYSIA CONNECTED SHIP MARKET SIZE ESTIMATES & FORECAST, BY REGIONAL, 2019-2032 (USD BILLIONS)
      88. TABLE 87. THAILAND CONNECTED SHIP MARKET SIZE ESTIMATES & FORECAST, BY TECHNOLOGY, 2019-2032 (USD BILLIONS)
      89. TABLE 88. THAILAND CONNECTED SHIP MARKET SIZE ESTIMATES & FORECAST, BY SHIP TYPE, 2019-2032 (USD BILLIONS)
      90. TABLE 89. THAILAND CONNECTED SHIP MARKET SIZE ESTIMATES & FORECAST, BY APPLICATION, 2019-2032 (USD BILLIONS)
      91. TABLE 90. THAILAND CONNECTED SHIP MARKET SIZE ESTIMATES & FORECAST, BY END USE, 2019-2032 (USD BILLIONS)
      92. TABLE 91. THAILAND CONNECTED SHIP MARKET SIZE ESTIMATES & FORECAST, BY REGIONAL, 2019-2032 (USD BILLIONS)
      93. TABLE 92. INDONESIA CONNECTED SHIP MARKET SIZE ESTIMATES & FORECAST, BY TECHNOLOGY, 2019-2032 (USD BILLIONS)
      94. TABLE 93. INDONESIA CONNECTED SHIP MARKET SIZE ESTIMATES & FORECAST, BY SHIP TYPE, 2019-2032 (USD BILLIONS)
      95. TABLE 94. INDONESIA CONNECTED SHIP MARKET SIZE ESTIMATES & FORECAST, BY APPLICATION, 2019-2032 (USD BILLIONS)
      96. TABLE 95. INDONESIA CONNECTED SHIP MARKET SIZE ESTIMATES & FORECAST, BY END USE, 2019-2032 (USD BILLIONS)
      97. TABLE 96. INDONESIA CONNECTED SHIP MARKET SIZE ESTIMATES & FORECAST, BY REGIONAL, 2019-2032 (USD BILLIONS)
      98. TABLE 97. REST OF APAC CONNECTED SHIP MARKET SIZE ESTIMATES & FORECAST, BY TECHNOLOGY, 2019-2032 (USD BILLIONS)
      99. TABLE 98. REST OF APAC CONNECTED SHIP MARKET SIZE ESTIMATES & FORECAST, BY SHIP TYPE, 2019-2032 (USD BILLIONS)
      100. TABLE 99. REST OF APAC CONNECTED SHIP MARKET SIZE ESTIMATES & FORECAST, BY APPLICATION, 2019-2032 (USD BILLIONS)
      101. TABLE 100. REST OF APAC CONNECTED SHIP MARKET SIZE ESTIMATES & FORECAST, BY END USE, 2019-2032 (USD BILLIONS)
      102. TABLE 101. REST OF APAC CONNECTED SHIP MARKET SIZE ESTIMATES & FORECAST, BY REGIONAL, 2019-2032 (USD BILLIONS)
      103. TABLE 102. SOUTH AMERICA CONNECTED SHIP MARKET SIZE ESTIMATES & FORECAST, BY TECHNOLOGY, 2019-2032 (USD BILLIONS)
      104. TABLE 103. SOUTH AMERICA CONNECTED SHIP MARKET SIZE ESTIMATES & FORECAST, BY SHIP TYPE, 2019-2032 (USD BILLIONS)
      105. TABLE 104. SOUTH AMERICA CONNECTED SHIP MARKET SIZE ESTIMATES & FORECAST, BY APPLICATION, 2019-2032 (USD BILLIONS)
      106. TABLE 105. SOUTH AMERICA CONNECTED SHIP MARKET SIZE ESTIMATES & FORECAST, BY END USE, 2019-2032 (USD BILLIONS)
      107. TABLE 106. SOUTH AMERICA CONNECTED SHIP MARKET SIZE ESTIMATES & FORECAST, BY REGIONAL, 2019-2032 (USD BILLIONS)
      108. TABLE 107. BRAZIL CONNECTED SHIP MARKET SIZE ESTIMATES & FORECAST, BY TECHNOLOGY, 2019-2032 (USD BILLIONS)
      109. TABLE 108. BRAZIL CONNECTED SHIP MARKET SIZE ESTIMATES & FORECAST, BY SHIP TYPE, 2019-2032 (USD BILLIONS)
      110. TABLE 109. BRAZIL CONNECTED SHIP MARKET SIZE ESTIMATES & FORECAST, BY APPLICATION, 2019-2032 (USD BILLIONS)
      111. TABLE 110. BRAZIL CONNECTED SHIP MARKET SIZE ESTIMATES & FORECAST, BY END USE, 2019-2032 (USD BILLIONS)
      112. TABLE 111. BRAZIL CONNECTED SHIP MARKET SIZE ESTIMATES & FORECAST, BY REGIONAL, 2019-2032 (USD BILLIONS)
      113. TABLE 112. MEXICO CONNECTED SHIP MARKET SIZE ESTIMATES & FORECAST, BY TECHNOLOGY, 2019-2032 (USD BILLIONS)
      114. TABLE 113. MEXICO CONNECTED SHIP MARKET SIZE ESTIMATES & FORECAST, BY SHIP TYPE, 2019-2032 (USD BILLIONS)
      115. TABLE 114. MEXICO CONNECTED SHIP MARKET SIZE ESTIMATES & FORECAST, BY APPLICATION, 2019-2032 (USD BILLIONS)
      116. TABLE 115. MEXICO CONNECTED SHIP MARKET SIZE ESTIMATES & FORECAST, BY END USE, 2019-2032 (USD BILLIONS)
      117. TABLE 116. MEXICO CONNECTED SHIP MARKET SIZE ESTIMATES & FORECAST, BY REGIONAL, 2019-2032 (USD BILLIONS)
      118. TABLE 117. ARGENTINA CONNECTED SHIP MARKET SIZE ESTIMATES & FORECAST, BY TECHNOLOGY, 2019-2032 (USD BILLIONS)
      119. TABLE 118. ARGENTINA CONNECTED SHIP MARKET SIZE ESTIMATES & FORECAST, BY SHIP TYPE, 2019-2032 (USD BILLIONS)
      120. TABLE 119. ARGENTINA CONNECTED SHIP MARKET SIZE ESTIMATES & FORECAST, BY APPLICATION, 2019-2032 (USD BILLIONS)
      121. TABLE 120. ARGENTINA CONNECTED SHIP MARKET SIZE ESTIMATES & FORECAST, BY END USE, 2019-2032 (USD BILLIONS)
      122. TABLE 121. ARGENTINA CONNECTED SHIP MARKET SIZE ESTIMATES & FORECAST, BY REGIONAL, 2019-2032 (USD BILLIONS)
      123. TABLE 122. REST OF SOUTH AMERICA CONNECTED SHIP MARKET SIZE ESTIMATES & FORECAST, BY TECHNOLOGY, 2019-2032 (USD BILLIONS)
      124. TABLE 123. REST OF SOUTH AMERICA CONNECTED SHIP MARKET SIZE ESTIMATES & FORECAST, BY SHIP TYPE, 2019-2032 (USD BILLIONS)
      125. TABLE 124. REST OF SOUTH AMERICA CONNECTED SHIP MARKET SIZE ESTIMATES & FORECAST, BY APPLICATION, 2019-2032 (USD BILLIONS)
      126. TABLE 125. REST OF SOUTH AMERICA CONNECTED SHIP MARKET SIZE ESTIMATES & FORECAST, BY END USE, 2019-2032 (USD BILLIONS)
      127. TABLE 126. REST OF SOUTH AMERICA CONNECTED SHIP MARKET SIZE ESTIMATES & FORECAST, BY REGIONAL, 2019-2032 (USD BILLIONS)
      128. TABLE 127. MEA CONNECTED SHIP MARKET SIZE ESTIMATES & FORECAST, BY TECHNOLOGY, 2019-2032 (USD BILLIONS)
      129. TABLE 128. MEA CONNECTED SHIP MARKET SIZE ESTIMATES & FORECAST, BY SHIP TYPE, 2019-2032 (USD BILLIONS)
      130. TABLE 129. MEA CONNECTED SHIP MARKET SIZE ESTIMATES & FORECAST, BY APPLICATION, 2019-2032 (USD BILLIONS)
      131. TABLE 130. MEA CONNECTED SHIP MARKET SIZE ESTIMATES & FORECAST, BY END USE, 2019-2032 (USD BILLIONS)
      132. TABLE 131. MEA CONNECTED SHIP MARKET SIZE ESTIMATES & FORECAST, BY REGIONAL, 2019-2032 (USD BILLIONS)
      133. TABLE 132. GCC COUNTRIES CONNECTED SHIP MARKET SIZE ESTIMATES & FORECAST, BY TECHNOLOGY, 2019-2032 (USD BILLIONS)
      134. TABLE 133. GCC COUNTRIES CONNECTED SHIP MARKET SIZE ESTIMATES & FORECAST, BY SHIP TYPE, 2019-2032 (USD BILLIONS)
      135. TABLE 134. GCC COUNTRIES CONNECTED SHIP MARKET SIZE ESTIMATES & FORECAST, BY APPLICATION, 2019-2032 (USD BILLIONS)
      136. TABLE 135. GCC COUNTRIES CONNECTED SHIP MARKET SIZE ESTIMATES & FORECAST, BY END USE, 2019-2032 (USD BILLIONS)
      137. TABLE 136. GCC COUNTRIES CONNECTED SHIP MARKET SIZE ESTIMATES & FORECAST, BY REGIONAL, 2019-2032 (USD BILLIONS)
      138. TABLE 137. SOUTH AFRICA CONNECTED SHIP MARKET SIZE ESTIMATES & FORECAST, BY TECHNOLOGY, 2019-2032 (USD BILLIONS)
      139. TABLE 138. SOUTH AFRICA CONNECTED SHIP MARKET SIZE ESTIMATES & FORECAST, BY SHIP TYPE, 2019-2032 (USD BILLIONS)
      140. TABLE 139. SOUTH AFRICA CONNECTED SHIP MARKET SIZE ESTIMATES & FORECAST, BY APPLICATION, 2019-2032 (USD BILLIONS)
      141. TABLE 140. SOUTH AFRICA CONNECTED SHIP MARKET SIZE ESTIMATES & FORECAST, BY END USE, 2019-2032 (USD BILLIONS)
      142. TABLE 141. SOUTH AFRICA CONNECTED SHIP MARKET SIZE ESTIMATES & FORECAST, BY REGIONAL, 2019-2032 (USD BILLIONS)
      143. TABLE 142. REST OF MEA CONNECTED SHIP MARKET SIZE ESTIMATES & FORECAST, BY TECHNOLOGY, 2019-2032 (USD BILLIONS)
      144. TABLE 143. REST OF MEA CONNECTED SHIP MARKET SIZE ESTIMATES & FORECAST, BY SHIP TYPE, 2019-2032 (USD BILLIONS)
      145. TABLE 144. REST OF MEA CONNECTED SHIP MARKET SIZE ESTIMATES & FORECAST, BY APPLICATION, 2019-2032 (USD BILLIONS)
      146. TABLE 145. REST OF MEA CONNECTED SHIP MARKET SIZE ESTIMATES & FORECAST, BY END USE, 2019-2032 (USD BILLIONS)
      147. TABLE 146. REST OF MEA CONNECTED SHIP MARKET SIZE ESTIMATES & FORECAST, BY REGIONAL, 2019-2032 (USD BILLIONS)
      148. TABLE 147. PRODUCT LAUNCH/PRODUCT DEVELOPMENT/APPROVAL
      149. TABLE 148. ACQUISITION/PARTNERSHIP LIST OF FIGURES
      150. FIGURE 1. MARKET SYNOPSIS
      151. FIGURE 2. NORTH AMERICA CONNECTED SHIP MARKET ANALYSIS
      152. FIGURE 3. US CONNECTED SHIP MARKET ANALYSIS BY TECHNOLOGY
      153. FIGURE 4. US CONNECTED SHIP MARKET ANALYSIS BY SHIP TYPE
      154. FIGURE 5. US CONNECTED SHIP MARKET ANALYSIS BY APPLICATION
      155. FIGURE 6. US CONNECTED SHIP MARKET ANALYSIS BY END USE
      156. FIGURE 7. US CONNECTED SHIP MARKET ANALYSIS BY REGIONAL
      157. FIGURE 8. CANADA CONNECTED SHIP MARKET ANALYSIS BY TECHNOLOGY
      158. FIGURE 9. CANADA CONNECTED SHIP MARKET ANALYSIS BY SHIP TYPE
      159. FIGURE 10. CANADA CONNECTED SHIP MARKET ANALYSIS BY APPLICATION
      160. FIGURE 11. CANADA CONNECTED SHIP MARKET ANALYSIS BY END USE
      161. FIGURE 12. CANADA CONNECTED SHIP MARKET ANALYSIS BY REGIONAL
      162. FIGURE 13. EUROPE CONNECTED SHIP MARKET ANALYSIS
      163. FIGURE 14. GERMANY CONNECTED SHIP MARKET ANALYSIS BY TECHNOLOGY
      164. FIGURE 15. GERMANY CONNECTED SHIP MARKET ANALYSIS BY SHIP TYPE
      165. FIGURE 16. GERMANY CONNECTED SHIP MARKET ANALYSIS BY APPLICATION
      166. FIGURE 17. GERMANY CONNECTED SHIP MARKET ANALYSIS BY END USE
      167. FIGURE 18. GERMANY CONNECTED SHIP MARKET ANALYSIS BY REGIONAL
      168. FIGURE 19. UK CONNECTED SHIP MARKET ANALYSIS BY TECHNOLOGY
      169. FIGURE 20. UK CONNECTED SHIP MARKET ANALYSIS BY SHIP TYPE
      170. FIGURE 21. UK CONNECTED SHIP MARKET ANALYSIS BY APPLICATION
      171. FIGURE 22. UK CONNECTED SHIP MARKET ANALYSIS BY END USE
      172. FIGURE 23. UK CONNECTED SHIP MARKET ANALYSIS BY REGIONAL
      173. FIGURE 24. FRANCE CONNECTED SHIP MARKET ANALYSIS BY TECHNOLOGY
      174. FIGURE 25. FRANCE CONNECTED SHIP MARKET ANALYSIS BY SHIP TYPE
      175. FIGURE 26. FRANCE CONNECTED SHIP MARKET ANALYSIS BY APPLICATION
      176. FIGURE 27. FRANCE CONNECTED SHIP MARKET ANALYSIS BY END USE
      177. FIGURE 28. FRANCE CONNECTED SHIP MARKET ANALYSIS BY REGIONAL
      178. FIGURE 29. RUSSIA CONNECTED SHIP MARKET ANALYSIS BY TECHNOLOGY
      179. FIGURE 30. RUSSIA CONNECTED SHIP MARKET ANALYSIS BY SHIP TYPE
      180. FIGURE 31. RUSSIA CONNECTED SHIP MARKET ANALYSIS BY APPLICATION
      181. FIGURE 32. RUSSIA CONNECTED SHIP MARKET ANALYSIS BY END USE
      182. FIGURE 33. RUSSIA CONNECTED SHIP MARKET ANALYSIS BY REGIONAL
      183. FIGURE 34. ITALY CONNECTED SHIP MARKET ANALYSIS BY TECHNOLOGY
      184. FIGURE 35. ITALY CONNECTED SHIP MARKET ANALYSIS BY SHIP TYPE
      185. FIGURE 36. ITALY CONNECTED SHIP MARKET ANALYSIS BY APPLICATION
      186. FIGURE 37. ITALY CONNECTED SHIP MARKET ANALYSIS BY END USE
      187. FIGURE 38. ITALY CONNECTED SHIP MARKET ANALYSIS BY REGIONAL
      188. FIGURE 39. SPAIN CONNECTED SHIP MARKET ANALYSIS BY TECHNOLOGY
      189. FIGURE 40. SPAIN CONNECTED SHIP MARKET ANALYSIS BY SHIP TYPE
      190. FIGURE 41. SPAIN CONNECTED SHIP MARKET ANALYSIS BY APPLICATION
      191. FIGURE 42. SPAIN CONNECTED SHIP MARKET ANALYSIS BY END USE
      192. FIGURE 43. SPAIN CONNECTED SHIP MARKET ANALYSIS BY REGIONAL
      193. FIGURE 44. REST OF EUROPE CONNECTED SHIP MARKET ANALYSIS BY TECHNOLOGY
      194. FIGURE 45. REST OF EUROPE CONNECTED SHIP MARKET ANALYSIS BY SHIP TYPE
      195. FIGURE 46. REST OF EUROPE CONNECTED SHIP MARKET ANALYSIS BY APPLICATION
      196. FIGURE 47. REST OF EUROPE CONNECTED SHIP MARKET ANALYSIS BY END USE
      197. FIGURE 48. REST OF EUROPE CONNECTED SHIP MARKET ANALYSIS BY REGIONAL
      198. FIGURE 49. APAC CONNECTED SHIP MARKET ANALYSIS
      199. FIGURE 50. CHINA CONNECTED SHIP MARKET ANALYSIS BY TECHNOLOGY
      200. FIGURE 51. CHINA CONNECTED SHIP MARKET ANALYSIS BY SHIP TYPE
      201. FIGURE 52. CHINA CONNECTED SHIP MARKET ANALYSIS BY APPLICATION
      202. FIGURE 53. CHINA CONNECTED SHIP MARKET ANALYSIS BY END USE
      203. FIGURE 54. CHINA CONNECTED SHIP MARKET ANALYSIS BY REGIONAL
      204. FIGURE 55. INDIA CONNECTED SHIP MARKET ANALYSIS BY TECHNOLOGY
      205. FIGURE 56. INDIA CONNECTED SHIP MARKET ANALYSIS BY SHIP TYPE
      206. FIGURE 57. INDIA CONNECTED SHIP MARKET ANALYSIS BY APPLICATION
      207. FIGURE 58. INDIA CONNECTED SHIP MARKET ANALYSIS BY END USE
      208. FIGURE 59. INDIA CONNECTED SHIP MARKET ANALYSIS BY REGIONAL
      209. FIGURE 60. JAPAN CONNECTED SHIP MARKET ANALYSIS BY TECHNOLOGY
      210. FIGURE 61. JAPAN CONNECTED SHIP MARKET ANALYSIS BY SHIP TYPE
      211. FIGURE 62. JAPAN CONNECTED SHIP MARKET ANALYSIS BY APPLICATION
      212. FIGURE 63. JAPAN CONNECTED SHIP MARKET ANALYSIS BY END USE
      213. FIGURE 64. JAPAN CONNECTED SHIP MARKET ANALYSIS BY REGIONAL
      214. FIGURE 65. SOUTH KOREA CONNECTED SHIP MARKET ANALYSIS BY TECHNOLOGY
      215. FIGURE 66. SOUTH KOREA CONNECTED SHIP MARKET ANALYSIS BY SHIP TYPE
      216. FIGURE 67. SOUTH KOREA CONNECTED SHIP MARKET ANALYSIS BY APPLICATION
      217. FIGURE 68. SOUTH KOREA CONNECTED SHIP MARKET ANALYSIS BY END USE
      218. FIGURE 69. SOUTH KOREA CONNECTED SHIP MARKET ANALYSIS BY REGIONAL
      219. FIGURE 70. MALAYSIA CONNECTED SHIP MARKET ANALYSIS BY TECHNOLOGY
      220. FIGURE 71. MALAYSIA CONNECTED SHIP MARKET ANALYSIS BY SHIP TYPE
      221. FIGURE 72. MALAYSIA CONNECTED SHIP MARKET ANALYSIS BY APPLICATION
      222. FIGURE 73. MALAYSIA CONNECTED SHIP MARKET ANALYSIS BY END USE
      223. FIGURE 74. MALAYSIA CONNECTED SHIP MARKET ANALYSIS BY REGIONAL
      224. FIGURE 75. THAILAND CONNECTED SHIP MARKET ANALYSIS BY TECHNOLOGY
      225. FIGURE 76. THAILAND CONNECTED SHIP MARKET ANALYSIS BY SHIP TYPE
      226. FIGURE 77. THAILAND CONNECTED SHIP MARKET ANALYSIS BY APPLICATION
      227. FIGURE 78. THAILAND CONNECTED SHIP MARKET ANALYSIS BY END USE
      228. FIGURE 79. THAILAND CONNECTED SHIP MARKET ANALYSIS BY REGIONAL
      229. FIGURE 80. INDONESIA CONNECTED SHIP MARKET ANALYSIS BY TECHNOLOGY
      230. FIGURE 81. INDONESIA CONNECTED SHIP MARKET ANALYSIS BY SHIP TYPE
      231. FIGURE 82. INDONESIA CONNECTED SHIP MARKET ANALYSIS BY APPLICATION
      232. FIGURE 83. INDONESIA CONNECTED SHIP MARKET ANALYSIS BY END USE
      233. FIGURE 84. INDONESIA CONNECTED SHIP MARKET ANALYSIS BY REGIONAL
      234. FIGURE 85. REST OF APAC CONNECTED SHIP MARKET ANALYSIS BY TECHNOLOGY
      235. FIGURE 86. REST OF APAC CONNECTED SHIP MARKET ANALYSIS BY SHIP TYPE
      236. FIGURE 87. REST OF APAC CONNECTED SHIP MARKET ANALYSIS BY APPLICATION
      237. FIGURE 88. REST OF APAC CONNECTED SHIP MARKET ANALYSIS BY END USE
      238. FIGURE 89. REST OF APAC CONNECTED SHIP MARKET ANALYSIS BY REGIONAL
      239. FIGURE 90. SOUTH AMERICA CONNECTED SHIP MARKET ANALYSIS
      240. FIGURE 91. BRAZIL CONNECTED SHIP MARKET ANALYSIS BY TECHNOLOGY
      241. FIGURE 92. BRAZIL CONNECTED SHIP MARKET ANALYSIS BY SHIP TYPE
      242. FIGURE 93. BRAZIL CONNECTED SHIP MARKET ANALYSIS BY APPLICATION
      243. FIGURE 94. BRAZIL CONNECTED SHIP MARKET ANALYSIS BY END USE
      244. FIGURE 95. BRAZIL CONNECTED SHIP MARKET ANALYSIS BY REGIONAL
      245. FIGURE 96. MEXICO CONNECTED SHIP MARKET ANALYSIS BY TECHNOLOGY
      246. FIGURE 97. MEXICO CONNECTED SHIP MARKET ANALYSIS BY SHIP TYPE
      247. FIGURE 98. MEXICO CONNECTED SHIP MARKET ANALYSIS BY APPLICATION
      248. FIGURE 99. MEXICO CONNECTED SHIP MARKET ANALYSIS BY END USE
      249. FIGURE 100. MEXICO CONNECTED SHIP MARKET ANALYSIS BY REGIONAL
      250. FIGURE 101. ARGENTINA CONNECTED SHIP MARKET ANALYSIS BY TECHNOLOGY
      251. FIGURE 102. ARGENTINA CONNECTED SHIP MARKET ANALYSIS BY SHIP TYPE
      252. FIGURE 103. ARGENTINA CONNECTED SHIP MARKET ANALYSIS BY APPLICATION
      253. FIGURE 104. ARGENTINA CONNECTED SHIP MARKET ANALYSIS BY END USE
      254. FIGURE 105. ARGENTINA CONNECTED SHIP MARKET ANALYSIS BY REGIONAL
      255. FIGURE 106. REST OF SOUTH AMERICA CONNECTED SHIP MARKET ANALYSIS BY TECHNOLOGY
      256. FIGURE 107. REST OF SOUTH AMERICA CONNECTED SHIP MARKET ANALYSIS BY SHIP TYPE
      257. FIGURE 108. REST OF SOUTH AMERICA CONNECTED SHIP MARKET ANALYSIS BY APPLICATION
      258. FIGURE 109. REST OF SOUTH AMERICA CONNECTED SHIP MARKET ANALYSIS BY END USE
      259. FIGURE 110. REST OF SOUTH AMERICA CONNECTED SHIP MARKET ANALYSIS BY REGIONAL
      260. FIGURE 111. MEA CONNECTED SHIP MARKET ANALYSIS
      261. FIGURE 112. GCC COUNTRIES CONNECTED SHIP MARKET ANALYSIS BY TECHNOLOGY
      262. FIGURE 113. GCC COUNTRIES CONNECTED SHIP MARKET ANALYSIS BY SHIP TYPE
      263. FIGURE 114. GCC COUNTRIES CONNECTED SHIP MARKET ANALYSIS BY APPLICATION
      264. FIGURE 115. GCC COUNTRIES CONNECTED SHIP MARKET ANALYSIS BY END USE
      265. FIGURE 116. GCC COUNTRIES CONNECTED SHIP MARKET ANALYSIS BY REGIONAL
      266. FIGURE 117. SOUTH AFRICA CONNECTED SHIP MARKET ANALYSIS BY TECHNOLOGY
      267. FIGURE 118. SOUTH AFRICA CONNECTED SHIP MARKET ANALYSIS BY SHIP TYPE
      268. FIGURE 119. SOUTH AFRICA CONNECTED SHIP MARKET ANALYSIS BY APPLICATION
      269. FIGURE 120. SOUTH AFRICA CONNECTED SHIP MARKET ANALYSIS BY END USE
      270. FIGURE 121. SOUTH AFRICA CONNECTED SHIP MARKET ANALYSIS BY REGIONAL
      271. FIGURE 122. REST OF MEA CONNECTED SHIP MARKET ANALYSIS BY TECHNOLOGY
      272. FIGURE 123. REST OF MEA CONNECTED SHIP MARKET ANALYSIS BY SHIP TYPE
      273. FIGURE 124. REST OF MEA CONNECTED SHIP MARKET ANALYSIS BY APPLICATION
      274. FIGURE 125. REST OF MEA CONNECTED SHIP MARKET ANALYSIS BY END USE
      275. FIGURE 126. REST OF MEA CONNECTED SHIP MARKET ANALYSIS BY REGIONAL
      276. FIGURE 127. KEY BUYING CRITERIA OF CONNECTED SHIP MARKET
      277. FIGURE 128. RESEARCH PROCESS OF MRFR
      278. FIGURE 129. DRO ANALYSIS OF CONNECTED SHIP MARKET
      279. FIGURE 130. DRIVERS IMPACT ANALYSIS: CONNECTED SHIP MARKET
      280. FIGURE 131. RESTRAINTS IMPACT ANALYSIS: CONNECTED SHIP MARKET
      281. FIGURE 132. SUPPLY / VALUE CHAIN: CONNECTED SHIP MARKET
      282. FIGURE 133. CONNECTED SHIP MARKET, BY TECHNOLOGY, 2024 (% SHARE)
      283. FIGURE 134. CONNECTED SHIP MARKET, BY TECHNOLOGY, 2019 TO 2032 (USD Billions)
      284. FIGURE 135. CONNECTED SHIP MARKET, BY SHIP TYPE, 2024 (% SHARE)
      285. FIGURE 136. CONNECTED SHIP MARKET, BY SHIP TYPE, 2019 TO 2032 (USD Billions)
      286. FIGURE 137. CONNECTED SHIP MARKET, BY APPLICATION, 2024 (% SHARE)
      287. FIGURE 138. CONNECTED SHIP MARKET, BY APPLICATION, 2019 TO 2032 (USD Billions)
      288. FIGURE 139. CONNECTED SHIP MARKET, BY END USE, 2024 (% SHARE)
      289. FIGURE 140. CONNECTED SHIP MARKET, BY END USE, 2019 TO 2032 (USD Billions)
      290. FIGURE 141. CONNECTED SHIP MARKET, BY REGIONAL, 2024 (% SHARE)
      291. FIGURE 142. CONNECTED SHIP MARKET, BY REGIONAL, 2019 TO 2032 (USD Billions)
      292. FIGURE 143. BENCHMARKING OF MAJOR COMPETITORS

    Connected Ship Market Segmentation

    • Connected Ship Market By Technology (USD Billion, 2019-2032)
      • Internet of Things
      • Cloud Computing
      • Blockchain
      • Artificial Intelligence
      • Satellite Communication


    • Connected Ship Market By Ship Type (USD Billion, 2019-2032)
      • Cargo Ships
      • Passenger Ships
      • Fishing Vessels
      • Naval Ships


    • Connected Ship Market By Application (USD Billion, 2019-2032)
      • Fleet Management
      • Cargo Tracking
      • Safety and Security
      • Fuel Management


    • Connected Ship Market By End Use (USD Billion, 2019-2032)
      • Commercial
      • Government
      • Research


    • Connected Ship Market By Regional (USD Billion, 2019-2032)
      • North America
      • Europe
      • South America
      • Asia Pacific
      • Middle East and Africa


    Connected Ship Market Regional Outlook (USD Billion, 2019-2032)


    • North America Outlook (USD Billion, 2019-2032)
      • North America Connected Ship Market by Technology Type
        • Internet of Things
        • Cloud Computing
        • Blockchain
        • Artificial Intelligence
        • Satellite Communication
      • North America Connected Ship Market by Ship Type
        • Cargo Ships
        • Passenger Ships
        • Fishing Vessels
        • Naval Ships
      • North America Connected Ship Market by Application Type
        • Fleet Management
        • Cargo Tracking
        • Safety and Security
        • Fuel Management
      • North America Connected Ship Market by End Use Type
        • Commercial
        • Government
        • Research
      • North America Connected Ship Market by Regional Type
        • US
        • Canada
      • US Outlook (USD Billion, 2019-2032)
      • US Connected Ship Market by Technology Type
        • Internet of Things
        • Cloud Computing
        • Blockchain
        • Artificial Intelligence
        • Satellite Communication
      • US Connected Ship Market by Ship Type
        • Cargo Ships
        • Passenger Ships
        • Fishing Vessels
        • Naval Ships
      • US Connected Ship Market by Application Type
        • Fleet Management
        • Cargo Tracking
        • Safety and Security
        • Fuel Management
      • US Connected Ship Market by End Use Type
        • Commercial
        • Government
        • Research
      • CANADA Outlook (USD Billion, 2019-2032)
      • CANADA Connected Ship Market by Technology Type
        • Internet of Things
        • Cloud Computing
        • Blockchain
        • Artificial Intelligence
        • Satellite Communication
      • CANADA Connected Ship Market by Ship Type
        • Cargo Ships
        • Passenger Ships
        • Fishing Vessels
        • Naval Ships
      • CANADA Connected Ship Market by Application Type
        • Fleet Management
        • Cargo Tracking
        • Safety and Security
        • Fuel Management
      • CANADA Connected Ship Market by End Use Type
        • Commercial
        • Government
        • Research
      • Europe Outlook (USD Billion, 2019-2032)
        • Europe Connected Ship Market by Technology Type
          • Internet of Things
          • Cloud Computing
          • Blockchain
          • Artificial Intelligence
          • Satellite Communication
        • Europe Connected Ship Market by Ship Type
          • Cargo Ships
          • Passenger Ships
          • Fishing Vessels
          • Naval Ships
        • Europe Connected Ship Market by Application Type
          • Fleet Management
          • Cargo Tracking
          • Safety and Security
          • Fuel Management
        • Europe Connected Ship Market by End Use Type
          • Commercial
          • Government
          • Research
        • Europe Connected Ship Market by Regional Type
          • Germany
          • UK
          • France
          • Russia
          • Italy
          • Spain
          • Rest of Europe
        • GERMANY Outlook (USD Billion, 2019-2032)
        • GERMANY Connected Ship Market by Technology Type
          • Internet of Things
          • Cloud Computing
          • Blockchain
          • Artificial Intelligence
          • Satellite Communication
        • GERMANY Connected Ship Market by Ship Type
          • Cargo Ships
          • Passenger Ships
          • Fishing Vessels
          • Naval Ships
        • GERMANY Connected Ship Market by Application Type
          • Fleet Management
          • Cargo Tracking
          • Safety and Security
          • Fuel Management
        • GERMANY Connected Ship Market by End Use Type
          • Commercial
          • Government
          • Research
        • UK Outlook (USD Billion, 2019-2032)
        • UK Connected Ship Market by Technology Type
          • Internet of Things
          • Cloud Computing
          • Blockchain
          • Artificial Intelligence
          • Satellite Communication
        • UK Connected Ship Market by Ship Type
          • Cargo Ships
          • Passenger Ships
          • Fishing Vessels
          • Naval Ships
        • UK Connected Ship Market by Application Type
          • Fleet Management
          • Cargo Tracking
          • Safety and Security
          • Fuel Management
        • UK Connected Ship Market by End Use Type
          • Commercial
          • Government
          • Research
        • FRANCE Outlook (USD Billion, 2019-2032)
        • FRANCE Connected Ship Market by Technology Type
          • Internet of Things
          • Cloud Computing
          • Blockchain
          • Artificial Intelligence
          • Satellite Communication
        • FRANCE Connected Ship Market by Ship Type
          • Cargo Ships
          • Passenger Ships
          • Fishing Vessels
          • Naval Ships
        • FRANCE Connected Ship Market by Application Type
          • Fleet Management
          • Cargo Tracking
          • Safety and Security
          • Fuel Management
        • FRANCE Connected Ship Market by End Use Type
          • Commercial
          • Government
          • Research
        • RUSSIA Outlook (USD Billion, 2019-2032)
        • RUSSIA Connected Ship Market by Technology Type
          • Internet of Things
          • Cloud Computing
          • Blockchain
          • Artificial Intelligence
          • Satellite Communication
        • RUSSIA Connected Ship Market by Ship Type
          • Cargo Ships
          • Passenger Ships
          • Fishing Vessels
          • Naval Ships
        • RUSSIA Connected Ship Market by Application Type
          • Fleet Management
          • Cargo Tracking
          • Safety and Security
          • Fuel Management
        • RUSSIA Connected Ship Market by End Use Type
          • Commercial
          • Government
          • Research
        • ITALY Outlook (USD Billion, 2019-2032)
        • ITALY Connected Ship Market by Technology Type
          • Internet of Things
          • Cloud Computing
          • Blockchain
          • Artificial Intelligence
          • Satellite Communication
        • ITALY Connected Ship Market by Ship Type
          • Cargo Ships
          • Passenger Ships
          • Fishing Vessels
          • Naval Ships
        • ITALY Connected Ship Market by Application Type
          • Fleet Management
          • Cargo Tracking
          • Safety and Security
          • Fuel Management
        • ITALY Connected Ship Market by End Use Type
          • Commercial
          • Government
          • Research
        • SPAIN Outlook (USD Billion, 2019-2032)
        • SPAIN Connected Ship Market by Technology Type
          • Internet of Things
          • Cloud Computing
          • Blockchain
          • Artificial Intelligence
          • Satellite Communication
        • SPAIN Connected Ship Market by Ship Type
          • Cargo Ships
          • Passenger Ships
          • Fishing Vessels
          • Naval Ships
        • SPAIN Connected Ship Market by Application Type
          • Fleet Management
          • Cargo Tracking
          • Safety and Security
          • Fuel Management
        • SPAIN Connected Ship Market by End Use Type
          • Commercial
          • Government
          • Research
        • REST OF EUROPE Outlook (USD Billion, 2019-2032)
        • REST OF EUROPE Connected Ship Market by Technology Type
          • Internet of Things
          • Cloud Computing
          • Blockchain
          • Artificial Intelligence
          • Satellite Communication
        • REST OF EUROPE Connected Ship Market by Ship Type
          • Cargo Ships
          • Passenger Ships
          • Fishing Vessels
          • Naval Ships
        • REST OF EUROPE Connected Ship Market by Application Type
          • Fleet Management
          • Cargo Tracking
          • Safety and Security
          • Fuel Management
        • REST OF EUROPE Connected Ship Market by End Use Type
          • Commercial
          • Government
          • Research
        • APAC Outlook (USD Billion, 2019-2032)
          • APAC Connected Ship Market by Technology Type
            • Internet of Things
            • Cloud Computing
            • Blockchain
            • Artificial Intelligence
            • Satellite Communication
          • APAC Connected Ship Market by Ship Type
            • Cargo Ships
            • Passenger Ships
            • Fishing Vessels
            • Naval Ships
          • APAC Connected Ship Market by Application Type
            • Fleet Management
            • Cargo Tracking
            • Safety and Security
            • Fuel Management
          • APAC Connected Ship Market by End Use Type
            • Commercial
            • Government
            • Research
          • APAC Connected Ship Market by Regional Type
            • China
            • India
            • Japan
            • South Korea
            • Malaysia
            • Thailand
            • Indonesia
            • Rest of APAC
          • CHINA Outlook (USD Billion, 2019-2032)
          • CHINA Connected Ship Market by Technology Type
            • Internet of Things
            • Cloud Computing
            • Blockchain
            • Artificial Intelligence
            • Satellite Communication
          • CHINA Connected Ship Market by Ship Type
            • Cargo Ships
            • Passenger Ships
            • Fishing Vessels
            • Naval Ships
          • CHINA Connected Ship Market by Application Type
            • Fleet Management
            • Cargo Tracking
            • Safety and Security
            • Fuel Management
          • CHINA Connected Ship Market by End Use Type
            • Commercial
            • Government
            • Research
          • INDIA Outlook (USD Billion, 2019-2032)
          • INDIA Connected Ship Market by Technology Type
            • Internet of Things
            • Cloud Computing
            • Blockchain
            • Artificial Intelligence
            • Satellite Communication
          • INDIA Connected Ship Market by Ship Type
            • Cargo Ships
            • Passenger Ships
            • Fishing Vessels
            • Naval Ships
          • INDIA Connected Ship Market by Application Type
            • Fleet Management
            • Cargo Tracking
            • Safety and Security
            • Fuel Management
          • INDIA Connected Ship Market by End Use Type
            • Commercial
            • Government
            • Research
          • JAPAN Outlook (USD Billion, 2019-2032)
          • JAPAN Connected Ship Market by Technology Type
            • Internet of Things
            • Cloud Computing
            • Blockchain
            • Artificial Intelligence
            • Satellite Communication
          • JAPAN Connected Ship Market by Ship Type
            • Cargo Ships
            • Passenger Ships
            • Fishing Vessels
            • Naval Ships
          • JAPAN Connected Ship Market by Application Type
            • Fleet Management
            • Cargo Tracking
            • Safety and Security
            • Fuel Management
          • JAPAN Connected Ship Market by End Use Type
            • Commercial
            • Government
            • Research
          • SOUTH KOREA Outlook (USD Billion, 2019-2032)
          • SOUTH KOREA Connected Ship Market by Technology Type
            • Internet of Things
            • Cloud Computing
            • Blockchain
            • Artificial Intelligence
            • Satellite Communication
          • SOUTH KOREA Connected Ship Market by Ship Type
            • Cargo Ships
            • Passenger Ships
            • Fishing Vessels
            • Naval Ships
          • SOUTH KOREA Connected Ship Market by Application Type
            • Fleet Management
            • Cargo Tracking
            • Safety and Security
            • Fuel Management
          • SOUTH KOREA Connected Ship Market by End Use Type
            • Commercial
            • Government
            • Research
          • MALAYSIA Outlook (USD Billion, 2019-2032)
          • MALAYSIA Connected Ship Market by Technology Type
            • Internet of Things
            • Cloud Computing
            • Blockchain
            • Artificial Intelligence
            • Satellite Communication
          • MALAYSIA Connected Ship Market by Ship Type
            • Cargo Ships
            • Passenger Ships
            • Fishing Vessels
            • Naval Ships
          • MALAYSIA Connected Ship Market by Application Type
            • Fleet Management
            • Cargo Tracking
            • Safety and Security
            • Fuel Management
          • MALAYSIA Connected Ship Market by End Use Type
            • Commercial
            • Government
            • Research
          • THAILAND Outlook (USD Billion, 2019-2032)
          • THAILAND Connected Ship Market by Technology Type
            • Internet of Things
            • Cloud Computing
            • Blockchain
            • Artificial Intelligence
            • Satellite Communication
          • THAILAND Connected Ship Market by Ship Type
            • Cargo Ships
            • Passenger Ships
            • Fishing Vessels
            • Naval Ships
          • THAILAND Connected Ship Market by Application Type
            • Fleet Management
            • Cargo Tracking
            • Safety and Security
            • Fuel Management
          • THAILAND Connected Ship Market by End Use Type
            • Commercial
            • Government
            • Research
          • INDONESIA Outlook (USD Billion, 2019-2032)
          • INDONESIA Connected Ship Market by Technology Type
            • Internet of Things
            • Cloud Computing
            • Blockchain
            • Artificial Intelligence
            • Satellite Communication
          • INDONESIA Connected Ship Market by Ship Type
            • Cargo Ships
            • Passenger Ships
            • Fishing Vessels
            • Naval Ships
          • INDONESIA Connected Ship Market by Application Type
            • Fleet Management
            • Cargo Tracking
            • Safety and Security
            • Fuel Management
          • INDONESIA Connected Ship Market by End Use Type
            • Commercial
            • Government
            • Research
          • REST OF APAC Outlook (USD Billion, 2019-2032)
          • REST OF APAC Connected Ship Market by Technology Type
            • Internet of Things
            • Cloud Computing
            • Blockchain
            • Artificial Intelligence
            • Satellite Communication
          • REST OF APAC Connected Ship Market by Ship Type
            • Cargo Ships
            • Passenger Ships
            • Fishing Vessels
            • Naval Ships
          • REST OF APAC Connected Ship Market by Application Type
            • Fleet Management
            • Cargo Tracking
            • Safety and Security
            • Fuel Management
          • REST OF APAC Connected Ship Market by End Use Type
            • Commercial
            • Government
            • Research
          • South America Outlook (USD Billion, 2019-2032)
            • South America Connected Ship Market by Technology Type
              • Internet of Things
              • Cloud Computing
              • Blockchain
              • Artificial Intelligence
              • Satellite Communication
            • South America Connected Ship Market by Ship Type
              • Cargo Ships
              • Passenger Ships
              • Fishing Vessels
              • Naval Ships
            • South America Connected Ship Market by Application Type
              • Fleet Management
              • Cargo Tracking
              • Safety and Security
              • Fuel Management
            • South America Connected Ship Market by End Use Type
              • Commercial
              • Government
              • Research
            • South America Connected Ship Market by Regional Type
              • Brazil
              • Mexico
              • Argentina
              • Rest of South America
            • BRAZIL Outlook (USD Billion, 2019-2032)
            • BRAZIL Connected Ship Market by Technology Type
              • Internet of Things
              • Cloud Computing
              • Blockchain
              • Artificial Intelligence
              • Satellite Communication
            • BRAZIL Connected Ship Market by Ship Type
              • Cargo Ships
              • Passenger Ships
              • Fishing Vessels
              • Naval Ships
            • BRAZIL Connected Ship Market by Application Type
              • Fleet Management
              • Cargo Tracking
              • Safety and Security
              • Fuel Management
            • BRAZIL Connected Ship Market by End Use Type
              • Commercial
              • Government
              • Research
            • MEXICO Outlook (USD Billion, 2019-2032)
            • MEXICO Connected Ship Market by Technology Type
              • Internet of Things
              • Cloud Computing
              • Blockchain
              • Artificial Intelligence
              • Satellite Communication
            • MEXICO Connected Ship Market by Ship Type
              • Cargo Ships
              • Passenger Ships
              • Fishing Vessels
              • Naval Ships
            • MEXICO Connected Ship Market by Application Type
              • Fleet Management
              • Cargo Tracking
              • Safety and Security
              • Fuel Management
            • MEXICO Connected Ship Market by End Use Type
              • Commercial
              • Government
              • Research
            • ARGENTINA Outlook (USD Billion, 2019-2032)
            • ARGENTINA Connected Ship Market by Technology Type
              • Internet of Things
              • Cloud Computing
              • Blockchain
              • Artificial Intelligence
              • Satellite Communication
            • ARGENTINA Connected Ship Market by Ship Type
              • Cargo Ships
              • Passenger Ships
              • Fishing Vessels
              • Naval Ships
            • ARGENTINA Connected Ship Market by Application Type
              • Fleet Management
              • Cargo Tracking
              • Safety and Security
              • Fuel Management
            • ARGENTINA Connected Ship Market by End Use Type
              • Commercial
              • Government
              • Research
            • REST OF SOUTH AMERICA Outlook (USD Billion, 2019-2032)
            • REST OF SOUTH AMERICA Connected Ship Market by Technology Type
              • Internet of Things
              • Cloud Computing
              • Blockchain
              • Artificial Intelligence
              • Satellite Communication
            • REST OF SOUTH AMERICA Connected Ship Market by Ship Type
              • Cargo Ships
              • Passenger Ships
              • Fishing Vessels
              • Naval Ships
            • REST OF SOUTH AMERICA Connected Ship Market by Application Type
              • Fleet Management
              • Cargo Tracking
              • Safety and Security
              • Fuel Management
            • REST OF SOUTH AMERICA Connected Ship Market by End Use Type
              • Commercial
              • Government
              • Research
            • MEA Outlook (USD Billion, 2019-2032)
              • MEA Connected Ship Market by Technology Type
                • Internet of Things
                • Cloud Computing
                • Blockchain
                • Artificial Intelligence
                • Satellite Communication
              • MEA Connected Ship Market by Ship Type
                • Cargo Ships
                • Passenger Ships
                • Fishing Vessels
                • Naval Ships
              • MEA Connected Ship Market by Application Type
                • Fleet Management
                • Cargo Tracking
                • Safety and Security
                • Fuel Management
              • MEA Connected Ship Market by End Use Type
                • Commercial
                • Government
                • Research
              • MEA Connected Ship Market by Regional Type
                • GCC Countries
                • South Africa
                • Rest of MEA
              • GCC COUNTRIES Outlook (USD Billion, 2019-2032)
              • GCC COUNTRIES Connected Ship Market by Technology Type
                • Internet of Things
                • Cloud Computing
                • Blockchain
                • Artificial Intelligence
                • Satellite Communication
              • GCC COUNTRIES Connected Ship Market by Ship Type
                • Cargo Ships
                • Passenger Ships
                • Fishing Vessels
                • Naval Ships
              • GCC COUNTRIES Connected Ship Market by Application Type
                • Fleet Management
                • Cargo Tracking
                • Safety and Security
                • Fuel Management
              • GCC COUNTRIES Connected Ship Market by End Use Type
                • Commercial
                • Government
                • Research
              • SOUTH AFRICA Outlook (USD Billion, 2019-2032)
              • SOUTH AFRICA Connected Ship Market by Technology Type
                • Internet of Things
                • Cloud Computing
                • Blockchain
                • Artificial Intelligence
                • Satellite Communication
              • SOUTH AFRICA Connected Ship Market by Ship Type
                • Cargo Ships
                • Passenger Ships
                • Fishing Vessels
                • Naval Ships
              • SOUTH AFRICA Connected Ship Market by Application Type
                • Fleet Management
                • Cargo Tracking
                • Safety and Security
                • Fuel Management
              • SOUTH AFRICA Connected Ship Market by End Use Type
                • Commercial
                • Government
                • Research
              • REST OF MEA Outlook (USD Billion, 2019-2032)
              • REST OF MEA Connected Ship Market by Technology Type
                • Internet of Things
                • Cloud Computing
                • Blockchain
                • Artificial Intelligence
                • Satellite Communication
              • REST OF MEA Connected Ship Market by Ship Type
                • Cargo Ships
                • Passenger Ships
                • Fishing Vessels
                • Naval Ships
              • REST OF MEA Connected Ship Market by Application Type
                • Fleet Management
                • Cargo Tracking
                • Safety and Security
                • Fuel Management
              • REST OF MEA Connected Ship Market by End Use Type
                • Commercial
                • Government
                • Research
    Infographic

    Free Sample Request

    Kindly complete the form below to receive a free sample of this Report

    Get Free Sample

    Customer Strories

    “I am very pleased with how market segments have been defined in a relevant way for my purposes (such as "Portable Freezers & refrigerators" and "last-mile"). In general the report is well structured. Thanks very much for your efforts.”

    Victoria Milne

    Founder
    Case Study
    Chemicals and Materials