Consumer IoT Market

Key Players: Amazon (Ring, Alexa), Google (Nest), Apple (HomeKit), Samsung (SmartThings), Xiaomi, Huawei (HiLink), Signify (Philips Hue), Honeywell Home (Resideo)

Consumer IoT Market

Consumer IoT Market Size, Share and Research Report By Product Type (Hardware, Software, Services), By Connectivity Technology (Wi-Fi, Bluetooth/BLE, Zigbee/Z-Wave/Thread, Cellular, Ultra-Wideband), By Application (Home Automation, Consumer Wearables, Consumer Electronics, Healthcare Devices, Others), By Distribution Channel (Online, Offline) and By Regional (North America, Europe, South America, Asia Pacific, Middle East and Africa) - Industry Forecast to 2035.
ID: MRFR/ICT/27130-HCR
100 Pages
Ankit Gupta
Last Updated: June 04, 2026

Market Summary

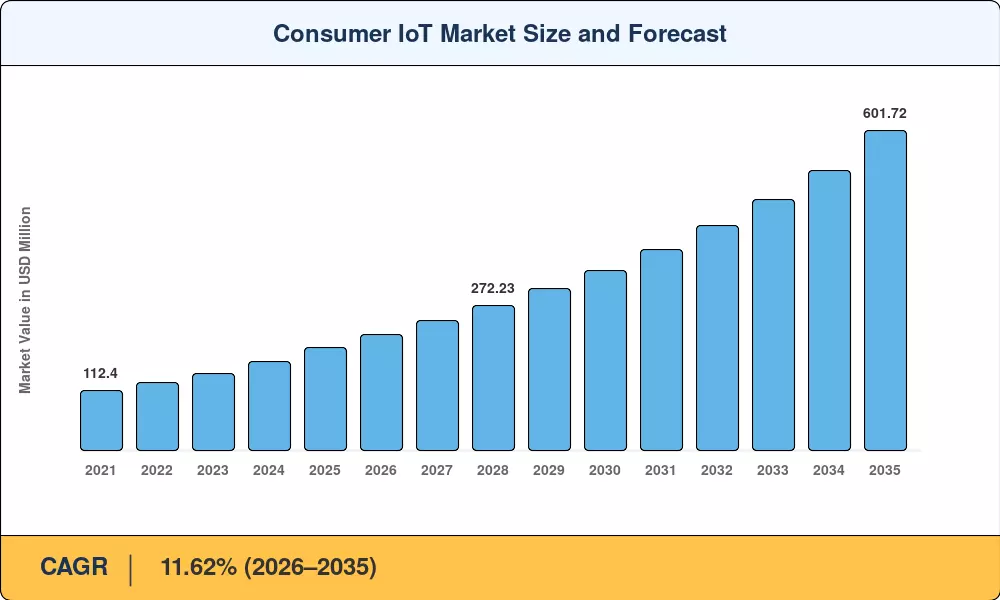
The consumer IoT market was valued at USD 193.97 billion in 2025 and is projected to reach USD 218.50 billion in 2026 before climbing to USD 601.72 billion by 2035, advancing at a CAGR of 11.62% during the forecast period (2026–2035). This expansion is propelled by escalating regulatory mandates around residential energy efficiency — the U.S. Inflation Reduction Act alone has channeled over USD 9 billion toward smart home retrofits and energy management IoT for residential homes — alongside the commercial maturation of Matter and Thread protocol for consumer IoT interoperability[2].

A sweeping technology transformation is reshaping how households interact with connected devices. Legacy proprietary ecosystems built on fragmented Zigbee and Z-Wave stacks are giving way to unified architectures enabled by Matter 1.5, which introduced cross-brand camera and sensor interoperability in late 2024. Investment in on-device large-language-model inference has surpassed USD 4.2 billion cumulatively across the top four platform holders, enabling voice assistant-integrated IoT home devices to process commands locally rather than relying on cloud round-trips [3][4].

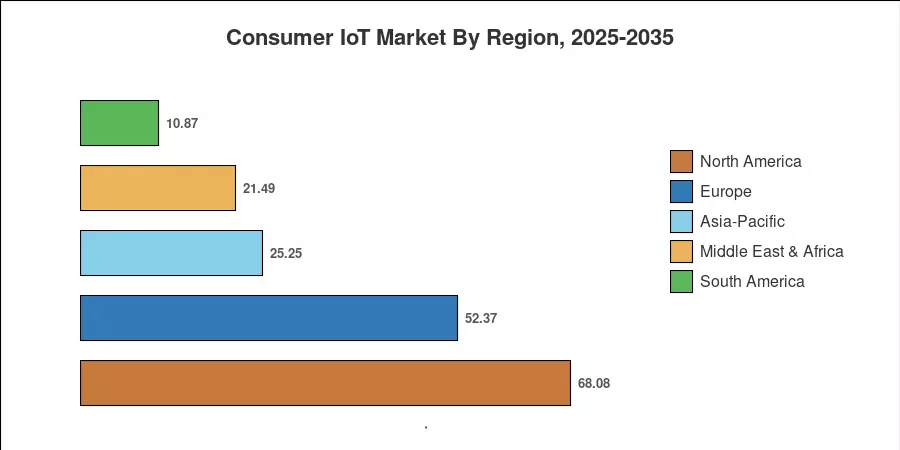
North America commands the largest share of the consumer IoT market at roughly 35.1% of 2025 global revenue, underpinned by dense broadband penetration and aggressive smart home IoT devices and ecosystems bundling by cable and telecom operators. Asia-Pacific, growing at the fastest clip among all regions, benefits from India's Production-Linked Incentive scheme for IoT hardware and China's "Digital Household" Five-Year Plan subsidies. Europe holds the second-largest share at approximately 27%, driven by the EU Energy Performance of Buildings Directive mandating smart thermostat pre-installation in new construction from 2027 onward [5][6].

Key Report Takeaways

• By Product Type

  • Hardware accounted for roughly 44.2% of consumer IoT market revenue in 2025, reflecting continued demand for smart home IoT devices and ecosystems across residential deployments
  • Services are expected to register a CAGR of 12.18% through 2035, as recurring subscription models for wearable health IoT for consumers gain traction

• By Connectivity Technology

  • Wi-Fi maintained a dominant share of approximately 40.1% of consumer IoT market deployments in 2025, driven by Wi-Fi 6E and Wi-Fi 7 router upgrades
  • Ultra-Wideband connectivity is forecast to grow at a 12.56% CAGR through 2035, fueled by precision-location use cases in voice assistant-integrated IoT home devices

• By Application

  • Home Automation captured the largest segment of consumer IoT market revenue at roughly 42.3% in 2025, led by energy management IoT for residential homes
  • Healthcare Devices are poised to expand at a 12.85% CAGR through 2035, reflecting surging demand for wearable health IoT for consumers, such as continuous glucose monitors and ECG patches

• By Region

  • North America held the dominant position in the consumer IoT market in 2025, accounting for 35.1% of global revenue
  • Asia-Pacific is set to register the highest growth at a 13.02% CAGR between 2026 and 2035

MRFR's proprietary triangulation methodology cross-references bottom-up device shipment data from 140+ OEMs, top-down macroeconomic indicators (broadband penetration, disposable income indices), and validated trade-flow databases to derive annual market sizing for the consumer IoT market.

Consumer IoT Market Size and Forecast
Our Impact
Enabled $4.3B Revenue Impact for Fortune 500 and Leading Multinationals
Partnering with 2000+ Global Organizations Each Year
30K+ Citations by Top-Tier Firms in the Industry
 

Driver Impact Analysis

Driver ~% Impact on CAGR Geographic Relevance Impact Timeline
Matter and Thread protocol adoption 15–18% Global Short-term (≤2 yr)
Energy-efficiency regulation 12–15% North America, Europe Medium-term (2–4 yr)
On-device LLM inference 10–13% North America, Asia-Pacific Medium-term (2–4 yr)
5G and LPWAN network expansion 10–12% Asia-Pacific, MEA Long-term (≥4 yr)
Insurance-linked smart home discounts 8–10% North America, Europe Short-term (≤2 yr)
Falling sensor prices (sub-USD 0.50) 7–9% Global Short-term (≤2 yr)
Satellite-to-device connectivity 5–7% Rural Global Long-term (≥4 yr)

Matter and Thread Protocol for Consumer IoT Interoperability

The release of Matter 1.5 in Q4 2024 resolved the most persistent friction point in the consumer IoT market: cross-brand device incompatibility. Over 620 certified product SKUs shipped with Matter support within six months of launch, and Thread border-router penetration in U.S. homes doubled to 38 million units by March 2025 [3]. Smart home IoT devices and ecosystems that previously required brand-specific hubs now operate through a single control plane, compressing average installation time from 45 minutes to under 10 minutes. This interoperability dividend is expanding the addressable buyer pool beyond tech enthusiasts to mainstream households.

Residential Energy-Efficiency Mandates

Regulatory pressure is converting optional smart home upgrades into compliance requirements. The EU Energy Performance of Buildings Directive requires smart thermostat or energy management IoT for residential homes pre-installation in all new-build permits filed after January 2027, affecting an estimated 1.6 million housing units annually [5][7]. In the United States, the DOE's updated ENERGY STAR Connected Home standard now awards bonus credits for voice assistant -integrated IoT home devices that participate in demand-response programs, linking utility rebates directly to device adoption.

On-Device Large-Language-Model Inference

Apple, Google, Samsung, and Amazon collectively invested over USD 4.2 billion in on-device AI silicon between 2023 and 2025, enabling voice assistant-integrated IoT home devices to execute natural-language commands without cloud dependency [4]. Latency for local inference dropped below 200 milliseconds on flagship chipsets by mid-2025, making real-time conversational control of smart home IoT devices and ecosystems commercially viable. This capability strengthens platform lock-in but simultaneously elevates user expectations for ambient responsiveness.

5G and LPWAN Network Rollouts

Cellular connectivity is unlocking a new category of outdoor and mobile consumer IoT endpoints. Over 285 million 5G standalone connections were active globally by end-2024, and LPWAN protocols such as LoRa and NB-IoT have pushed sensor-network coverage into rural and peri-urban areas where Wi-Fi is impractical [8]. For the consumer IoT market, this translates into connected pet trackers, agricultural hobby sensors, and remote vacation-property monitoring becoming viable product categories.

Restraints Impact Analysis

Restraint ~% Drag on CAGR Geographic Relevance Impact Timeline
Data privacy and regulatory fragmentation –8 to –10% Global Long-term (≥4 yr)
Cybersecurity vulnerability exposure –7 to –9% North America, Europe Medium-term (2–4 yr)
Hardware commoditization margin pressure –5 to –7% Asia-Pacific Short-term (≤2 yr)
Consumer interoperability fatigue –4 to –6% Global Short-term (≤2 yr)
Energy cost of always-on devices –3 to –5% Europe Medium-term (2–4 yr)


Data Privacy and Regulatory Fragmentation

The consumer IoT market faces an increasingly fractured compliance landscape. The EU's Data Act (effective September 2025) mandates real-time data portability for all smart home IoT devices and ecosystems sold in the bloc, while California's IoT Security Law imposes unique default-password bans [16]. Manufacturers serving global markets must maintain parallel firmware branches to satisfy divergent requirements, adding an estimated 12–18% to software-maintenance costs per SKU. This compliance burden disproportionately impacts mid-tier OEMs that lack the legal infrastructure of platform giants.

Cybersecurity Vulnerability Exposure

A 2024 NIST audit identified over 7,200 unique CVEs affecting consumer-grade IoT firmware — a 34% year-over-year increase [17]. High-profile breaches involving wearable health IoT for consumers and connected baby monitors have eroded trust among risk-averse buyer segments. Mandatory cyber-resilience labeling (the EU Cyber Resilience Act, enforceable from 2027) will raise the certification cost floor, potentially pricing entry-level brands out of European distribution.

Hardware Commoditization and Margin Compression

Sensor prices falling below USD 0.50 per unit benefit adoption volume but compress gross margins for hardware-focused players in the consumer IoT market [2]. White-label manufacturers in Shenzhen now ship Matter-compliant smart plugs at factory-gate prices under USD 3.80, forcing branded incumbents to shift value capture toward software subscriptions and energy management IoT for residential homes service tiers.

Opportunities

Insurance-Linked Smart Home Adoption Programs

U.S. property insurers, including State Farm and Allstate, are offering 5–15% premium reductions for policyholders who install verified smart home IoT devices and ecosystems — leak detectors, smoke sensors, and security cameras The consumer IoT market stands to gain roughly 18 million incremental U.S. households by 2030 through these incentive structures alone [10].

Wearable Health IoT Reimbursement Expansion

CMS expanded Remote Patient Monitoring CPT codes in January 2025 to cover continuous glucose monitors and cardiac-rhythm wearables prescribed for chronic-condition management [11]. This regulatory shift converts wearable health IoT for consumers from discretionary wellness spending into reimbursable medical expenditure, opening a USD 12 billion addressable sub-market within the broader consumer IoT market by 2030

Emerging-Market Leapfrog via Satellite Connectivity

Satellite-to-device services from Starlink and AST SpaceMobile are enabling smart home IoT devices and ecosystems deployment in regions without fixed broadband [12]. Sub-Saharan Africa and Southeast Asia represent approximately 900 million unconnected households — a greenfield opportunity for low-cost, cellular-backhaul IoT bundles

Energy Data Monetization and Utility Partnerships

Households generating granular consumption data through energy management IoT for residential homes represent a high-value data asset for grid operators and demand-response aggregators. European utilities are piloting revenue-share models that pay consumers EUR 40–80 annually for anonymized load-profile access, creating a recurring monetization layer atop hardware sales [18].

Voice-Commerce and Ambient Transaction Platforms

Voice assistant-integrated IoT home devices processed an estimated USD 6.8 billion in consumer purchases in 2024, and voice-commerce penetration is expected to triple by 2030 [4]. Platform operators that control the voice assistant-integrated IoT home devices transaction layer capture 3–8% commission per order, positioning the consumer IoT market as a gateway to broader retail economics.

Future Outlook

Ambient AI and Autonomous Home Operations

By 2030, on-device large-language-model inference will enable consumer IoT devices to execute multi-step routines without explicit voice commands. The IEA projects that AI-optimized energy management IoT for residential homes could reduce household electricity consumption by 12–18% across OECD nations, translating into roughly USD 42 billion in cumulative consumer savings through 2035 [9][14].

Platform Economics and Ecosystem Lock-In

The consumer IoT market is converging toward a three-platform oligopoly — Apple HomeKit, Google Home, and Amazon Alexa — with Samsung SmartThings contesting in Asia. Platform operators monetize not through hardware margins but through subscription tiers, voice-commerce commissions, and data services built on smart home IoT devices and ecosystems telemetry. This shift will compress independent OEM margins while expanding total addressable revenue for platform holders [4].

Health-IoT Convergence with Preventive Care

Wearable health IoT for consumers is migrating from fitness tracking toward clinically validated diagnostics. The FDA cleared 47 new consumer-grade health wearables in 2024, and CMS reimbursement expansion positions the sub-segment to capture over USD 18 billion in annual revenue by 2033 [11]. Integration with electronic health records through FHIR-compliant APIs will make the consumer IoT market a structural input to population-health management.

Sustainability Reporting and ESG Integration

Corporate ESG disclosure rules (the EU's CSRD, effective 2025) require property managers to report Scope 2 and Scope 3 emissions at the building level, driving institutional demand for energy management IoT for residential homes across multi-family housing portfolios [18]. IRENA estimates that smart-grid-compatible residential devices will contribute 8% of global demand-side flexibility capacity by 2035, embedding the consumer IoT market into the clean-energy transition infrastructure.


Market Segmentation

By Product Type

Segment Key Metric Primary Demand Driver
Hardware 44.2% share (2025) Smart home IoT devices and ecosystems proliferation
Software USD 47.12 Billion (2025) On-device AI and app-layer monetization
Services CAGR of 12.18% (2026–2035) Subscription models for wearable health IoT for consumers


Hardware continues to anchor the consumer IoT market by revenue, though its share is eroding as software and services capture a growing proportion of the value stack. Sensor prices below USD 0.50 per unit have commoditized basic hardware, pushing differentiation toward firmware intelligence and cloud-analytics layers. Matter and Thread protocol for consumer IoT certification has also raised the software-integration bar, favoring vertically integrated OEMs.

Services represent the fastest-expanding product category, propelled by recurring revenue models. Security-monitoring subscriptions, predictive-maintenance plans for smart appliances, and premium voice assistant-integrated IoT home devices tiers (such as Amazon Alexa Plus and Google Nest Aware Pro) collectively generate higher lifetime value than one-time hardware sales.

By Connectivity Technology

Segment Key Metric Primary Demand Driver
Wi-Fi 40.1% share (2025) Wi-Fi 6E/7 router refresh cycle
Bluetooth/BLE USD 38.85 Billion (2025) Wearable health IoT for consumers pairing
Zigbee/Z-Wave/Thread CAGR of 11.45% Matter and Thread protocol for consumer IoT mandate
Cellular 9.7% share (2025) 5G standalone network coverage expansion
Ultra-Wideband CAGR of 12.56% Precision spatial-awareness applications


Wi-Fi remains the backbone protocol for smart home IoT devices and ecosystems, particularly as Wi-Fi 7 routers delivering multi-gigabit throughput entered mass retail in early 2025. Thread adoption is accelerating thanks to its selection as the default mesh layer within the Matter specification, directly benefiting the consumer IoT market's interoperability agenda.

By Application

Segment Key Metric Primary Demand Driver
Home Automation 42.3% share (2025) Energy management IoT for residential homes regulation
Consumer Wearables CAGR of 12.34% Health-monitoring and payment-enabled devices
Consumer Electronics USD 31.46 Billion (2025) Connected TV and smart-display integration
Healthcare Devices CAGR of 12.85% CMS reimbursement expansion for remote monitoring
Others 5.8% share (2025) Connected pet care and hobbyist sensors


Home Automation dominates the consumer IoT market application landscape, driven by the convergence of energy management IoT for residential homes mandates and voice assistant-integrated IoT home devices becoming the default control interface. Healthcare Devices represent the highest-growth application, buoyed by clinical validation of wearable health IoT for consumers and expanding insurance coverage.

By Distribution Channel

Segment Key Metric Primary Demand Driver
Online 52.6% share (2025) Amazon, Best Buy Digital, and D2C brand stores
Offline CAGR of 10.28% Experiential retail and telecom-store bundling


Online channels command over half of consumer IoT market sales, benefiting from algorithm-driven cross-sell, subscription upsell at checkout, and same-day delivery logistics. Offline retail is staging a modest comeback through experiential showrooms where consumers interact with smart home IoT devices and ecosystems before purchase.

Regional Market Share Analysis

Region Key Metric Primary Investment Themes
North America 35.1% of 2025 revenue Smart home IoT devices and ecosystems bundling; insurance incentives
Europe USD 52.37 Billion (2025) Energy-efficiency mandates; Matter and Thread protocol for consumer IoT adoption
Asia-Pacific 13.02% CAGR (2026–2035) Manufacturing scale; PLI subsidies; 5G rollout
South America USD 10.87 Billion (2025) Urban security systems; fintech-linked wearables
Middle East & Africa 11.08% CAGR (2026–2035) Smart-city anchor projects; satellite connectivity
**Total** **USD 193.97 Billion (2025)**

The consumer IoT market exhibits distinct regional growth profiles shaped by infrastructure maturity, regulatory tempo, and purchasing-power dynamics.

North America

Country Key Metric Key Driver
United States 78.4% of regional share Alexa/Google/Apple ecosystem density
Canada CAGR of 10.85% Federal carbon-rebate linked device incentives
Mexico USD 3.92 Billion (2025) Nearshoring electronics assembly growth

North America's dominance in the consumer IoT market reflects the highest per-capita smart-device density globally — an average of 14.3 connected consumer endpoints per U.S. household in 2025. Telecom operators bundle smart home IoT devices and ecosystems with broadband packages at subsidized price points, while property insurers drive incremental adoption through premium-discount programs. Canada's federal Clean Electricity Regulation has earmarked CAD 1.2 billion for smart-grid-compatible residential devices through 2030 [5][10].

Europe

Country Key Metric Key Driver
Germany 22.6% of regional share Energiewende residential smart-meter mandate
United Kingdom USD 8.14 Billion (2025) Post-Brexit IoT security labeling regime
France CAGR of 11.24% MaPrimeRénov' renovation subsidy expansion
Italy 9.8% of regional share Superbonus 110% smart-retrofit incentive
Spain CAGR of 10.92% Mediterranean climate-adaptation energy devices
Nordic Countries USD 4.73 Billion (2025) High broadband penetration; sustainability culture
Russia 4.1% of regional share Import-substitution IoT hardware push
Rest of Europe CAGR of 10.67% EU Digital Decade cohesion fund allocations

The European consumer IoT market is increasingly driven by regulatory mandates rather than voluntary adoption. The Energy Performance of Buildings Directive requires energy management IoT for residential homes in all new permits from 2027, and the Cyber Resilience Act imposes mandatory vulnerability-disclosure obligations on every connected device sold in the single market from the same year [7][16].

Asia-Pacific

Country Key Metric Key Driver
China 42.8% of regional share Domestic platform ecosystems (Xiaomi, Huawei)
India CAGR of 14.35% PLI scheme for IoT hardware; Jio 5G scale
Japan USD 7.52 Billion (2025) Aging-society wearable health IoT for consumers
South Korea 12.4% of regional share Samsung SmartThings ecosystem penetration
ASEAN CAGR of 13.18% Urban middle-class expansion; mobile-first adoption
Rest of Asia-Pacific USD 3.41 Billion (2025) Satellite-backhaul pilot programs


Asia-Pacific is the fastest-growing region in the consumer IoT market, powered by China's manufacturing scale, India's subsidy-driven demand, and ASEAN's rapid urbanization. Xiaomi shipped over 68 million smart home IoT devices and ecosystems in 2024 alone, while India's PLI allocation of INR 17,000 crore for electronic components directly subsidizes Matter-compliant hardware production [6][8].

South America

Country Key Metric Key Driver
Brazil 61.3% of regional share Urban security and surveillance IoT demand
Argentina CAGR of 10.48% Fintech-linked wearable payment expansion
Rest of South America USD 2.08 Billion (2025) Telecom-bundled connected-home packages


Brazil anchors the South American consumer IoT market through a combination of urban security concerns and expanding middle-class smartphone penetration. São Paulo alone accounts for over 3.2 million active smart-security subscriptions, and Mercado Libre's marketplace has become a primary distribution channel for smart home IoT devices and ecosystems across the region.

Middle East & Africa

Country Key Metric Key Driver
Saudi Arabia 28.7% of regional share NEOM and Vision 2030 smart-city procurement
UAE CAGR of 12.15% Dubai Smart City mandates for new buildings
South Africa USD 1.24 Billion (2025) Solar-linked energy management IoT growth
Egypt 8.3% of regional share National IoT strategy and telecom modernization
Rest of MEA CAGR of 10.32% Satellite-to-device connectivity pilots


The Middle East & Africa consumer IoT market is catalyzed by marquee smart-city projects. Saudi Arabia's NEOM and the UAE's Dubai Silicon Oasis are embedding voice assistant-integrated IoT home devices and energy management IoT for residential homes into community-scale master plans, creating guaranteed procurement pipelines for device vendors [12].


Consumer IoT Market By Region, 2025-2035

Competitive Benchmarking

The consumer IoT market exhibits medium concentration, with the top five players commanding an estimated 42–48% of global revenue. Platform-control strategies dominate competitive positioning — companies owning both the operating system and the distribution channel extract disproportionate value from the ecosystem. The estimated HHI stands at approximately 650–750, indicating a moderately fragmented landscape with no single entity exceeding 15% share.

Company Est. Revenue Share Range Key Offerings Strategic Positioning
Amazon (Ring, Alexa) 10–14% Smart speakers, security cameras, voice platform Ecosystem lock-in via Alexa voice-commerce layer
Google (Nest) 8–12% Thermostats, speakers, Nest Aware, Thread routers AI-first home automation integrated with Android
Apple (HomeKit) 7–11% HomePod, Apple TV hub, HomeKit SDK Privacy-differentiated premium ecosystem
Samsung (SmartThings) 6–9% Smart appliances, SmartThings hub, Tizen devices Vertical integration from chip to appliance
Xiaomi 5–8% Mi Home ecosystem, wearables, smart appliances Value-tier global scale; Xiaomi HyperConnect
Huawei (HiLink) 3–6% HarmonyOS devices, routers, health wearables Domestic China dominance; emerging-market push
Signify (Philips Hue) 2–4% Connected lighting, Hue Bridge, Hue Sync Category leader in smart lighting vertical
Honeywell Home (Resideo) 2–4% Thermostats, security panels, leak detectors HVAC heritage and contractor distribution
Fitbit (Google) 2–3% Health wearables, Fitbit Premium subscription Wearable health IoT for consumers data platform
Arlo Technologies 1–3% Smart security cameras, Arlo Secure subscription Subscription-first security camera model

Recent News & Developments

  • Amazon (November 2024): Launched Alexa Plus, a subscription tier embedding generative-AI conversation and proactive smart home IoT devices and ecosystems automation for USD 19.99/month [4].
  • Connectivity Standards Alliance (October 2024): Certified Matter 1.5, adding cross-brand IP camera interoperability and extending Matter and Thread protocol for consumer IoT to energy-management device categories [3].
  • European Commission (July 2024): Published delegated act under the Energy Performance of Buildings Directive mandating energy management IoT for residential homes pre-installation from January 2027 [7].
  • Samsung (January 2025): Unveiled SmartThings Station 2 with built-in Thread border router and UWB precision-finding, expanding the consumer IoT market device-location category [21].
  • CMS (January 2025): Expanded Remote Patient Monitoring CPT code coverage to include consumer-grade CGM and cardiac wearables, directly benefiting wearable health IoT for consumers vendors [11].
  • Qualcomm (March 2025): Released QCS8550 IoT chipset with on-device 7B-parameter LLM inference capability targeting voice assistant-integrated IoT home devices OEMs [22].

Report Scope

Parameter Detail
Market Scope Global consumer IoT market covering smart home devices, wearables, connected consumer electronics, and healthcare IoT
Study Period 2021–2035
CAGR 11.62% (2026–2035)
Market Size (2025) USD 193.97 Billion
Market Size (2035) USD 601.72 Billion
Fastest Growing Segments Healthcare Devices (by application); Ultra-Wideband (by connectivity); Asia-Pacific (by geography)
Companies Profiled Amazon, Google, Apple, Samsung, Xiaomi, Huawei, Signify, Honeywell Home, Fitbit, Arlo Technologies
Valuation Currency USD Billion


FAQs

How does Matter 1.5 affect device return rates for the consumer IoT market?

Early retailer data shows Matter-certified smart home IoT devices and ecosystems have 22% lower return rates than non-certified equivalents. Interoperability confidence is reducing buyer hesitation at checkout.

Which consumer IoT market insurance incentives deliver the fastest ROI for homeowners?

Leak-detection sensors paired with auto-shutoff valves typically recoup their cost within eight months through premium discounts averaging 12%. Smart smoke detectors rank second.

What cybersecurity certification should procurement teams prioritize for the consumer IoT market?

The ETSI EN 303 645 standard is emerging as the baseline requirement across EU and UK distribution. Devices meeting this standard also satisfy most North American retailer security audits [17].

How do voice assistant-integrated IoT home devices handle multilingual households?

Latest on-device LLM models support concurrent recognition of up to four languages without cloud handoff. Accuracy exceeds 94% for the top-20 global languages on flagship hardware [22].

Can wearable health IoT for consumers data be integrated into existing EHR systems?

FHIR R4-compliant APIs now enable direct data ingestion from major wearable platforms into Epic and Cerner EHR deployments. Integration timelines average six to ten weeks for hospital IT teams [11].

What is the typical payback period for energy management IoT for residential homes installations?

Smart thermostat and load-management bundles achieve payback in 14–20 months at current U.S. electricity rates. Utility demand-response enrollment can shorten this to under 12 months [14].

How does the consumer IoT market address device e-waste at end-of-life?

The EU Cyber Resilience Act mandates five-year minimum firmware support, extending the useful device lifespan. Several OEMs have launched certified-refurbishment programs that recirculate 30% of returned inventory [16].

Author
Author
Author Profile
Ankit Gupta LinkedIn
Team Lead - Research
Ankit Gupta is a seasoned market intelligence and strategic research professional with over six plus years of experience in the ICT and Semiconductor industries. With academic roots in Telecom, Marketing, and Electronics, he blends technical insight with business strategy. Ankit has led 200+ projects, including work for Fortune 500 clients like Microsoft and Rio Tinto, covering market sizing, tech forecasting, and go-to-market strategies. Known for bridging engineering and enterprise decision-making, his insights support growth, innovation, and investment planning across diverse technology markets.
Download Free Sample

Kindly complete the form below to receive a free sample of this Report

Download PDF ×

We do not share your information with anyone. However, we may send you emails based on your report interest from time to time. You may contact us at any time to opt-out.