Download Free Sample
Kindly complete the form below to receive a free sample of this Report
Corporate Tax Services Market Research Report By Industry (Manufacturing, Technology, Healthcare, Financial Services), By Client Type (Corporations, Small and Medium Enterprises, Non-Profit Organizations, Government Entities), By Service Type (Tax Compliance, Tax Advisory, Tax Planning, Transfer Pricing), By Engagement Model (Retainer, Project-Based, Consultative, Outsourced) And By Region (North America, Europe, Asia-Pacific, And Rest Of The World) – Market Forecast Till 2035.
As per MRFR analysis, the Corporate Tax Services Market Size was estimated at 48.0 USD Billion in 2024. The Corporate Tax Services industry is projected to grow from 50.16 USD Billion in 2025 to 78.0 USD Billion by 2035, exhibiting a compound annual growth rate (CAGR) of 4.51% during the forecast period 2025 - 2035.
The Corporate Tax Services Market is experiencing a transformative shift towards digitalization and compliance.
| 2024 Market Size | 48.0 (USD Billion) |
| 2035 Market Size | 78.0 (USD Billion) |
| CAGR (2025 - 2035) | 4.51% |
Deloitte (US), PwC (GB), EY (GB), KPMG (NL), BDO (GB), Grant Thornton (GB), RSM (GB), Baker Tilly (GB), Crowe (US)
Our Impact
Enabled $4.3B Revenue Impact for Fortune 500 and Leading Multinationals
Partnering with 2000+ Global Organizations Each Year
30K+ Citations by Top-Tier Firms in the Industry
The Corporate Tax Services Market is currently experiencing a dynamic evolution, driven by various factors that shape the landscape of taxation and compliance. As businesses navigate an increasingly complex regulatory environment, the demand for specialized tax services has intensified. This market encompasses a wide range of offerings, including tax planning, compliance, and advisory services, which are essential for organizations aiming to optimize their tax positions while adhering to legal requirements. The integration of technology into tax processes is also becoming more prevalent, as firms seek to enhance efficiency and accuracy in their operations. Moreover, the Corporate Tax Services Market appears to be influenced by global economic trends and shifts in tax policies across different jurisdictions. Companies are increasingly seeking guidance on international tax matters, transfer pricing, and cross-border transactions. This trend suggests a growing need for expertise in navigating the complexities of global taxation. Additionally, the rise of sustainability and corporate social responsibility initiatives may lead to new considerations in tax strategy, as organizations strive to align their financial practices with broader societal goals. Overall, the Corporate Tax Services Market is poised for continued growth, reflecting the evolving needs of businesses in a multifaceted economic landscape.
The Corporate Tax Services Market is witnessing a notable shift towards digitalization. Firms are increasingly adopting technology-driven solutions to streamline tax compliance and reporting processes. This trend indicates a growing recognition of the benefits of automation, which can enhance accuracy and reduce the time spent on manual tasks.
As globalization continues to shape business operations, there is a heightened emphasis on international tax compliance. Organizations are seeking expert guidance to navigate the complexities of cross-border taxation, transfer pricing, and regulatory requirements in various jurisdictions. This trend highlights the necessity for specialized knowledge in global tax matters.
The Corporate Tax Services Market is beginning to reflect a shift towards integrating sustainability into tax strategies. Companies are increasingly considering the implications of their tax practices on environmental and social outcomes. This trend suggests a potential re-evaluation of tax planning approaches to align with corporate social responsibility objectives.
The landscape of tax incentives and credits is continually evolving, presenting both opportunities and challenges for businesses. The Corporate Tax Services Market is influenced by these changes as companies seek to leverage available incentives to optimize their tax liabilities. Recent data suggests that tax credits for research and development have increased by 15 percent, encouraging innovation and investment. As organizations navigate these incentives, the demand for specialized tax services that can identify and maximize these opportunities is likely to grow. This trend indicates a robust future for the Corporate Tax Services Market, as businesses increasingly rely on expert guidance to capitalize on evolving tax benefits.
There is a growing emphasis on tax transparency among corporations, driven by stakeholder expectations and regulatory pressures. The Corporate Tax Services Market is responding to this trend as companies strive to enhance their public image and comply with emerging transparency regulations. Recent surveys indicate that over 70 percent of consumers prefer to engage with companies that demonstrate responsible tax practices. This shift is prompting organizations to invest in tax services that can help them communicate their tax strategies effectively. As the demand for transparency continues to rise, the Corporate Tax Services Market is expected to expand, providing services that align with these evolving expectations.
The expansion of multinational corporations is a significant driver within the Corporate Tax Services Market. As businesses operate across borders, they encounter diverse tax systems and compliance requirements. This trend has led to an increased need for corporate tax services that can provide tailored solutions for international tax planning and compliance. According to recent data, the number of multinational enterprises has increased by over 20 percent in the last decade, highlighting the growing complexity of tax obligations. Consequently, the Corporate Tax Services Market is poised to benefit from this trend, as companies seek to optimize their tax strategies and mitigate risks associated with cross-border operations.
The Corporate Tax Services Market is experiencing a notable increase in the complexity of tax regulations across various jurisdictions. Governments are continuously updating tax laws to address economic changes and ensure compliance. This complexity necessitates businesses to seek expert guidance, thereby driving demand for corporate tax services. In recent years, the number of tax regulations has surged, with estimates indicating that companies face an average of 60 tax changes annually. As organizations strive to navigate this intricate landscape, the reliance on specialized tax services is likely to grow, positioning the Corporate Tax Services Market for sustained expansion.
Technological advancements are reshaping the Corporate Tax Services Market by enhancing efficiency and accuracy in tax compliance processes. The integration of artificial intelligence and machine learning into tax software allows for real-time data analysis and streamlined reporting. This shift not only reduces the time required for tax preparation but also minimizes the risk of errors, which can lead to costly penalties. Recent studies indicate that firms utilizing advanced tax technology experience a 30 percent reduction in compliance costs. As businesses increasingly adopt these technologies, the Corporate Tax Services Market is likely to witness significant growth driven by the demand for innovative solutions.
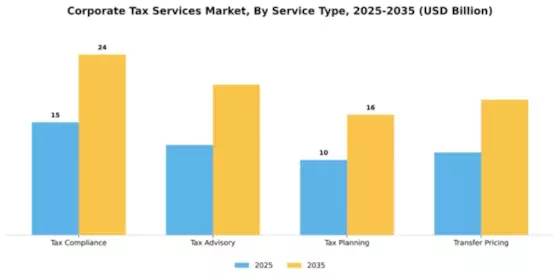
In the Corporate Tax Services Market, Tax Compliance stands out as the largest segment, capturing a significant portion of market share. Tax Compliance services are essential for businesses to fulfill their mandatory tax obligations accurately and timely. On the other hand, Tax Advisory services are gaining popularity, showcased as the fastest-growing segment. This growth is propelled by an increasing demand for strategic tax advice as companies navigate complex tax regulations and seek to optimize their tax strategies.
Tax Compliance: Dominant vs. Tax Advisory: Emerging
Tax Compliance services are characterized by their critical role in ensuring businesses meet their legal tax requirements, making them a dominant force in the market. These services provide peace of mind to organizations by minimizing the risk of non-compliance. In contrast, Tax Advisory services represent an emerging market trend, driven by the need for expert guidance in navigating tax complexities and maximizing tax efficiency. As regulations evolve, businesses increasingly seek tax advisors for strategic insights, thus contributing to the sector's rapid growth. The dual focus on compliance and advisory highlights a balanced approach in the Corporate Tax Services Market.
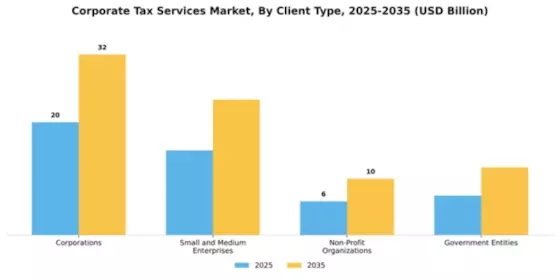
In the Corporate Tax Services Market, corporations represent the largest client type, commanding a significant share due to their complex tax scenarios and regulatory requirements. Small and Medium Enterprises (SMEs) are also a key player, showing a growing demand for specialized tax services as they expand their operations and seek to enhance their compliance measures. Non-Profit Organizations and Government Entities contribute to the market but do so at a slower rate than the aforementioned segments.
Corporations (Dominant) vs. Small and Medium Enterprises (Emerging)
Corporations, with their vast resources and intricate organizational structures, require comprehensive tax strategies to optimize their financial performance. They often need services that navigate international tax laws, mergers and acquisitions, and risk management, making them a dominant force in the corporate tax services market. In contrast, Small and Medium Enterprises are emerging as a vital segment, driven by the need for affordable and tailored tax solutions. SMEs face unique challenges, such as limited tax knowledge and fewer resources, prompting them to seek expert guidance to ensure compliance and maximize their growth potential.
In the Corporate Tax Services Market, the Manufacturing sector holds the largest share, driven by its intricate and diverse operations that require specialized tax strategies. Companies in manufacturing must navigate complex tax regulations both locally and internationally, positioning this segment as a significant contributor to overall market dynamics. Meanwhile, the Technology sector emerges as the fastest-growing segment as businesses in this field continuously innovate and expand, creating diverse tax needs that demand specialized consulting and compliance services.
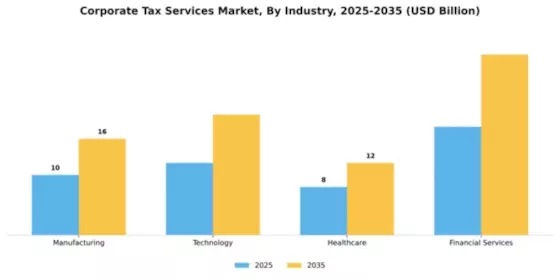
Manufacturing: Dominant vs. Technology: Emerging
The Manufacturing sector is characterized by established companies with longstanding operations, necessitating comprehensive tax services that cater to both federal and global tax obligations. This dominance is bolstered by ongoing investments in production efficiency and sustainability initiatives. In contrast, the Technology sector represents an emerging powerhouse, with startups and tech giants alike driving rapid growth. These companies demand agile tax consultation services due to their fast-paced nature and reliance on research and development credits, making them a dynamic area for corporate tax service providers.
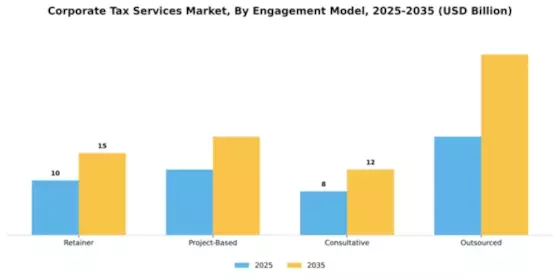
The Corporate Tax Services Market demonstrates a diverse engagement model landscape, where the Retainer model holds a significant share due to its stable revenue generation and long-term client relationships. This model is especially favored by corporations looking for ongoing support and guidance, resulting in a strong market presence. On the other hand, the Project-Based model is emerging rapidly, catering to businesses that prefer flexibility and specific tax solutions tailored to particular projects, leading to its status as the fastest-growing segment within the market.
Retainer (Dominant) vs. Project-Based (Emerging)
The Retainer engagement model in the Corporate Tax Services Market is characterized by its ability to deliver consistent and reliable service to clients, making it the dominant segment. Firms adopting this model benefit from predictable budgeting and foster deeper relationships with clients over time. Meanwhile, the Project-Based model is gaining traction as an emerging choice among businesses that seek specialized support for distinct projects. This model allows organizations to allocate resources more effectively and manage costs. The preference for agility and customized service in the ever-evolving corporate tax landscape makes Project-Based services increasingly popular.
Get more detailed insights about Corporate Tax Services Market Request Free Sample
North America continues to lead the Corporate Tax Services market, holding a significant share of 24.0 in 2024. The region's growth is driven by a robust economy, increasing compliance requirements, and a focus on digital transformation in tax processes. Regulatory changes and incentives for businesses are also fueling demand for tax advisory services, making it a dynamic market for corporate tax solutions. The competitive landscape is characterized by the presence of major players such as Deloitte, PwC, and EY, which dominate the market with their extensive service offerings. The U.S. is the primary contributor, supported by a strong regulatory framework that encourages transparency and compliance. This competitive environment fosters innovation and enhances service delivery, positioning North America as a hub for corporate tax services.
Europe's Corporate Tax Services market is evolving, with a market size of 12.0 in 2024. The region is experiencing growth driven by increasing regulatory scrutiny and the need for businesses to adapt to changing tax laws. Initiatives aimed at harmonizing tax regulations across EU member states are also contributing to the demand for corporate tax services, as companies seek compliance and efficiency in their operations. Leading countries in this market include the UK, Germany, and France, where firms like KPMG and BDO are prominent. The competitive landscape is marked by a mix of global and local players, each striving to offer tailored solutions. The presence of key players ensures a diverse range of services, catering to various business needs and enhancing the overall market dynamics.
The Asia-Pacific region is witnessing rapid growth in the Corporate Tax Services market, with a size of 8.0 in 2024. This growth is fueled by increasing foreign investments, economic development, and a rising awareness of tax compliance among businesses. Governments in the region are also implementing reforms to simplify tax processes, which is driving demand for professional tax services and advisory solutions. Countries like China, India, and Australia are leading the charge, with a competitive landscape featuring both local firms and international players such as EY and PwC. The presence of these key players enhances service offerings and fosters innovation in tax solutions. As businesses expand in this dynamic region, the demand for corporate tax services is expected to continue its upward trajectory.
The Middle East and Africa region is experiencing a growing demand for Corporate Tax Services, with a market size of 4.0 in 2024. This growth is driven by increasing economic diversification efforts and the need for businesses to comply with evolving tax regulations. Governments are implementing reforms to enhance tax collection and compliance, creating opportunities for tax service providers to offer their expertise in navigating these changes. Leading countries in this region include South Africa and the UAE, where firms like Grant Thornton and Crowe are establishing a strong presence. The competitive landscape is characterized by a mix of local and international players, each aiming to capture market share by providing tailored solutions. As the region continues to develop, the demand for corporate tax services is expected to rise significantly.
The Corporate Tax Services Market is characterized by a dynamic competitive landscape, driven by the increasing complexity of tax regulations and the growing demand for compliance and advisory services. Major players such as Deloitte (US), PwC (GB), and EY (GB) are strategically positioned to leverage their extensive global networks and technological capabilities. Deloitte (US) focuses on digital transformation and innovation, enhancing its service offerings through advanced analytics and AI-driven solutions. Meanwhile, PwC (GB) emphasizes sustainability and corporate responsibility, integrating these principles into its tax advisory services, which resonates with clients seeking to align with ESG standards. EY (GB) has adopted a strategy centered on mergers and acquisitions, aiming to expand its market share and enhance its service portfolio, thereby intensifying competition within the sector.The market structure appears moderately fragmented, with a mix of large multinational firms and regional players. Key tactics employed by these firms include localizing services to meet specific regional needs and optimizing their operational frameworks to enhance efficiency. This competitive structure allows for a diverse range of service offerings, catering to various client segments, from multinational corporations to small and medium-sized enterprises.In November Deloitte (US) announced a strategic partnership with a leading fintech company to develop a new tax compliance platform that utilizes blockchain technology. This initiative is poised to streamline tax reporting processes, reduce compliance risks, and enhance transparency for clients. The integration of blockchain is likely to position Deloitte as a frontrunner in tax technology, potentially reshaping client expectations and service delivery in the market.In October PwC (GB) launched a comprehensive sustainability tax advisory service aimed at helping businesses navigate the complexities of carbon taxes and other environmental regulations. This move underscores PwC's commitment to sustainability and reflects a growing trend among corporations to incorporate environmental considerations into their tax strategies. By aligning its services with the sustainability goals of its clients, PwC may strengthen its competitive edge in an increasingly eco-conscious market.In September EY (GB) completed the acquisition of a regional tax consultancy firm, enhancing its capabilities in providing specialized tax services to mid-sized enterprises. This acquisition not only expands EY's client base but also allows for the integration of local expertise into its broader service offerings. Such strategic moves indicate EY's focus on consolidating its market position and responding to the evolving needs of its clients.As of December the Corporate Tax Services Market is witnessing significant trends such as digitalization, AI integration, and a heightened focus on sustainability. Strategic alliances among key players are increasingly shaping the competitive landscape, fostering innovation and collaboration. The shift from price-based competition to a focus on technological advancement and supply chain reliability is evident, suggesting that firms that prioritize innovation and adaptability will likely emerge as leaders in this evolving market.






The Corporate Tax Services Market is projected to grow at a 4.51% CAGR from 2025 to 2035, driven by regulatory changes, digital transformation, and increasing globalization.
New opportunities lie in:
By 2035, the market is expected to be robust, reflecting substantial growth and innovation.
| MARKET SIZE 2024 | 48.0(USD Billion) |
| MARKET SIZE 2025 | 50.16(USD Billion) |
| MARKET SIZE 2035 | 78.0(USD Billion) |
| COMPOUND ANNUAL GROWTH RATE (CAGR) | 4.51% (2025 - 2035) |
| REPORT COVERAGE | Revenue Forecast, Competitive Landscape, Growth Factors, and Trends |
| BASE YEAR | 2024 |
| Market Forecast Period | 2025 - 2035 |
| Historical Data | 2019 - 2024 |
| Market Forecast Units | USD Billion |
| Key Companies Profiled | Deloitte (US), PwC (GB), EY (GB), KPMG (NL), BDO (GB), Grant Thornton (GB), RSM (GB), Baker Tilly (GB), Crowe (US) |
| Segments Covered | Service Type, Client Type, Industry, Engagement Model |
| Key Market Opportunities | Integration of artificial intelligence in compliance and reporting processes within the Corporate Tax Services Market. |
| Key Market Dynamics | Evolving regulatory frameworks and technological advancements reshape competitive dynamics in the Corporate Tax Services Market. |
| Countries Covered | North America, Europe, APAC, South America, MEA |
The Corporate Tax Services Market is valued at 48.0 USD Billion in 2024.
The market is projected to reach 78.0 USD Billion by 2035.
The expected CAGR for the market during 2025 - 2035 is 4.51%.
The Tax Compliance segment, valued at 15.0 USD Billion in 2024, is expected to grow to 24.0 USD Billion by 2035.
Small and Medium Enterprises contributed 15.0 USD Billion in 2024 and are projected to grow to 24.0 USD Billion by 2035.
Key players such as Deloitte and PwC are instrumental in shaping market trends and service offerings in the Corporate Tax Services sector.
The Transfer Pricing segment is expected to increase from 11.0 USD Billion in 2024 to 18.0 USD Billion by 2035.
The Financial Services industry, valued at 18.0 USD Billion in 2024, is projected to grow to 30.0 USD Billion by 2035.
The Outsourced engagement model, which was valued at 18.0 USD Billion in 2024, is expected to reach 33.0 USD Billion by 2035.
Non-Profit Organizations contributed 6.0 USD Billion in 2024 and are projected to grow to 10.0 USD Billion by 2035.


Kindly complete the form below to receive a free sample of this Report

“This is really good guys. Excellent work on a tight deadline. I will continue to use you going forward and recommend you to others. Nice job”


“Thanks. It’s been a pleasure working with you, please use me as reference with any other Intel employees.”


“Thanks for sending the report it gives us a good global view of the Betaïne market.”


“Thank you, this will be very helpful for OQS.”


“We found the report very insightful! we found your research firm very helpful. I'm sending this email to secure our future business.”


“I am very pleased with how market segments have been defined in a relevant way for my purposes (such as "Portable Freezers & refrigerators" and "last-mile"). In general the report is well structured. Thanks very much for your efforts.”


“I have been reading the first document or the study, ,the Global HVAC and FP market report 2021 till 2026. Must say, good info! I have not gone in depth at all parts, but got a good indication of the data inside!”


“We got the report in time, we really thank you for your support in this process. I also thank to all of your team as they did a great job.”


“The Automotive 48V ECU Components Procurement Intelligence Study” was a complex project, but the Market Research Future (MRFR) team handled it with quality, agility, and customer-centricity. They delivered all requested data on time and within the agreed scope. The team, including Shubhendra Anand and Rahul Gotadki, was always readily available to clarify questions and swiftly implement necessary adjustments, driving the project to a successful conclusion within a very demanding timeframe.
I would also like to specifically commend Akshay Agarwal for his responsiveness and support at every stage—from our initial inquiry on May 6th through to final delivery on June 18th. His dedication made the entire process seamless.”



