Corrosion Resistant Alloy Market Summary
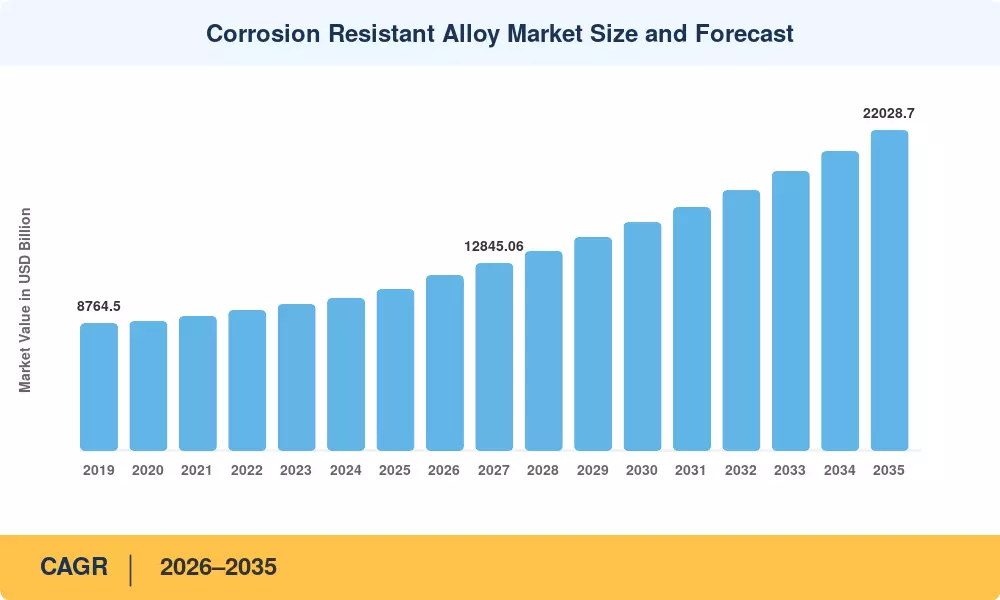
The global corrosion-resistant alloys market was valued at USD 11,107.27 million (USD 11.11 billion) in 2025 and is projected to reach USD 12,027.21 million in 2026, growing to USD 22,028.70 million (USD 22.03 billion) by 2035, at a CAGR of 6.96% during the 2026–2035 forecast period. Two structural drivers underpin this expansion: (i) sustained capital expenditure in global energy and power infrastructure—including upstream oil and gas, LNG terminals, and refinery modernization programs—and (ii) robust demand from chemical processing and industrial manufacturing, where aggressive media such as sulfuric acid, chlorides, and high-temperature flue gases necessitate alloys with superior corrosion performance [2]. Global pipeline and process-vessel investments exceeding USD 500 billion annually continue to support long-term demand for nickel-based, titanium, and duplex stainless steel alloys [3].
Stainless steel alloys, which accounted for USD 5,346.11 million in 2025 and nearly 48% of the global market, dominate the alloy-type landscape. However, due to growing use in next-generation chemical reactors, marine propulsion systems, and aircraft primary structures, titanium alloys are the alloy segment with the quickest rate of growth, with a compound annual growth rate (CAGR) of 7.66%. The vital significance of titanium alloys in modern airframe developments is highlighted by ATI Materials' July 2025 extension and expansion of its long-term titanium supply agreement with Boeing [5]. Another example of how material innovation is opening up new petrochemical and pressure-vessel applications is VDM Metals' October 2025 ASME Code Case certification for VDM Alloy 699 XA, a nickel alloy designed for metal dusting conditions [6].
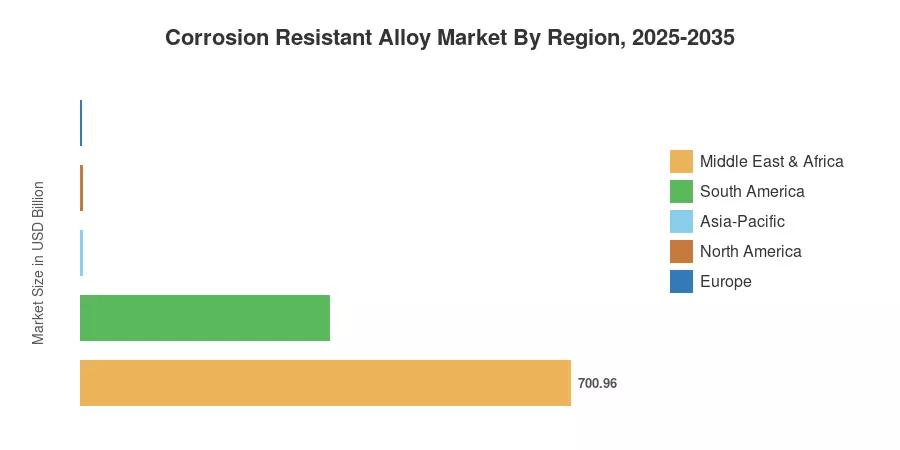
With USD 3,574.45 million in revenue in 2025 and the quickest CAGR of 7.86% through 2035, Asia-Pacific is the leading region, driven by increasing industrialization in Southeast Asia, China, and India. With a CAGR of 6.08% and USD 3,704.38 million in 2025, North America is the second-largest market, driven by defense-aerospace procurement and shale gas investment. With regulatory support from EU green-hydrogen infrastructure mandates, Europe contributed USD 2,771.18 million in 2025, expanding at a rate of 6.85%. By the conclusion of the forecast period, it is anticipated that the convergence of decarbonization imperatives and increasing industrial automation in all areas would maintain growth rates above 6% annually [7].
Key Report Takeaways
| Segment Dimension | Key Metric | Notes |
| Alloy Type — Dominant | Stainless Steel Alloys: USD 5,346.11 Mn (2025) | ~48.1% of the global market; driven by chemical processing and oil & gas |
| Alloy Type — Fastest Growing | Titanium Alloys: 7.66% CAGR | Aerospace and marine demand is accelerating the adoption |
| Application — Dominant | Oil & Gas: USD 3,828.92 Mn (2025) | ~34.5% market share; pipeline and refinery modernization |
| Application — Fastest Growing | Aerospace: 7.60% CAGR | Next-generation aircraft programs and defense expenditure |
| Production Process — Dominant | Forging: USD 4,647.01 Mn (2025) | ~41.8% market share; critical for pressure vessels and turbine components |
| Production Process — Fastest Growing | Powder Metallurgy: 7.79% CAGR | Additive manufacturing and near-net-shape demand |
| Region — Dominant | Asia-Pacific: USD 3,574.45 Mn (2025) | Led by China, India, and South Korea, industrialization |
| Region — Fastest Growing | Asia-Pacific: 7.86% CAGR | Infrastructure build-out and refinery capacity expansion |
| Region — Second Largest | North America: USD 3,704.38 Mn (2025) | Shale gas, LNG, and defense-aerospace procurement |
| Global Market 2035 | USD 22,028.70 Mn | 6.96% CAGR from 2026–2035 base |
Market Size and Forecast (2019–2035)
MRFR's market size estimates are derived from a bottom-up methodology combining primary interviews with alloy producers, distributors, and end-user procurement teams, validated against secondary sources including trade association statistics, national mineral survey data, and company financial disclosures. Historical values (2019–2024) reflect actual industry performance adjusted for currency effects, while the forecast period (2026–2035) is projected using segment-level demand models calibrated to the 2025 base year.





















.webp?v=1787579640)
