• Cat-intel
  • MedIntelliX
  • Resources
  • About Us
  • Hero Background
    English
    Chinese
    French
    Japanese
    Korean
    German
    Spanish

    Crash Barrier Systems Market Analysis

    ID: MRFR/CO/0912-HCR
    121 Pages
    Snehal Singh
    October 2025

    Crash Barrier Systems Market Research Report Information by Type (Movable barriers and Immovable barriers) By Technology (Rigid, Semi-rigid, and Flexible) by Device (Water & Sand –Filled Plastic Barrels, Crash Cushions, Gating & Non Gating end treatment, GEAT, and others) by Application (Median barriers, Roadside barriers, Bridge barriers, Work-zone barriers and others) and Region - For...

    Share:
    Download PDF ×

    We do not share your information with anyone. However, we may send you emails based on your report interest from time to time. You may contact us at any time to opt-out.

    Crash Barrier Systems Market Infographic
    $ 4,950.0
    $ 5,950.0
    $ 7,250.0

    Market Analysis

    In-depth Analysis of Crash Barrier Systems Market Industry Landscape

    The Crash Barrier Systems Market is changing due to variables that affect supply and demand. Transportation infrastructure globally relies on crash barrier devices to reduce vehicle crashes and improve road safety. The growing focus on road safety drives market dynamics. Crash barrier systems are being prioritized by governments and transportation authorities worldwide to minimize accidents and protect motorists, improving market dynamics.

    The crash barrier system market is heavily influenced by building and infrastructure development. Effective barrier solutions are needed as urbanization and highways grow. Guardrails and median barriers are essential to road infrastructure, affecting construction and infrastructure market dynamics.

    Regulatory standards and safety demands drive crash barrier system adoption, affecting market dynamics. Crash barriers are required by road safety regulations globally to avoid accidents and improve safety. Market dynamics depend on compliance with these restrictions, affecting crash barrier system demand across geographies.

    Another major crash barrier system market driver is the automotive industry. Vehicle safety regulations are changing, increasing demand for crashworthy barriers. Crash barrier devices protect occupants and reduce vehicle and infrastructure damage. The car industry's focus on safety ratings boosts market dynamics by boosting demand for sophisticated crash barrier technologies.

    Crash barrier systems market dynamics are shaped by material and technology innovation. Crash barrier manufacturers are investing in R&D to improve impact resistance, durability, and cost. High-strength steel and composite materials improve crash barrier system performance and lifetime, affecting market supply dynamics.

    Environmental concerns and sustainability are increasingly impacting crash barrier systems market dynamics. Barrier systems are increasingly using recyclable and eco-friendly materials. Sustainable manufacturers delivering eco-friendly crash barrier systems can affect market dynamics by addressing the growing need for environmentally friendly products.

    Smart transportation and infrastructure are changing market dynamics by incorporating technology into crash barrier solutions. Advanced crash barrier systems with sensors, communication devices, and automated functions improve road safety by monitoring traffic in real time. Technology in crash barrier systems supports smart infrastructure development, improving market dynamics.

    Manufacturing, quality control, and industry standards affect market dynamics on the supply side. Manufacturers that prioritize fast production, tight quality control, and safety requirements help meet crash barrier system demand. Delivering reliable and high-performance crash barrier technologies affects market supply dynamics.

    Author
    Snehal Singh
    Assistant Manager - Research

    High acumen in analyzing complex macro & micro markets with more than 6 years of work experience in the field of market research. By implementing her analytical skills in forecasting and estimation into market research reports, she has expertise in Packaging, Construction, and Equipment domains. She handles a team size of 20-25 resources and ensures smooth running of the projects, associated marketing activities, and client servicing.

    Leave a Comment

    FAQs

    What is the expected CAGR for the market during the period that ends in 2035?

    Crash Barrier Systems Market is projected to grow at a CAGR of 7.18% during the forecast period, 2025-2035

    Who are the prominent key players in the Crash Barrier Systems market report?

    Nucor Corporation, Bekaert SA, Delta Scientific Corporation, Avon Barrier Corporation Ltd, Transpo Industries Inc., FutureNet Group, Gibraltar, Arbus Ltd, Tata Steel Limited, Trinity Industries Inc., Automatic Systems SA, Lindsay Corporation

    What are the devices discussed in the Crash Barrier Systems market report?

    The device segment includes water & sand-filled plastic barrels, crash cushions, gating & non gating end treatment, GEAT (guardrails energy absorbent terminals), and others.

    Name the applications incorporated in the Crash Barrier Systems market report.

    The applications are Roadside barriers, Median barriers, Bridge barriers, Work-zone barriers, and others (pedestrian footpaths and hilly terrain barriers).

    Which region would trigger a better growth Crash Barrier Systems market?

    The APAC region would enjoy market control and would increase the growth margin.

    What are the types included in the Crash Barrier Systems market report?

    The types are movable and immovable barriers.

    Market Summary

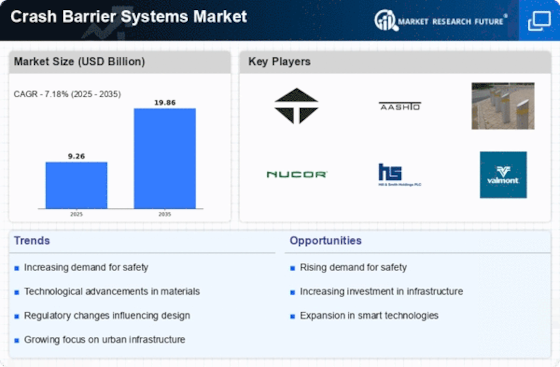
    The Global Crash Barrier Systems Market is projected to grow significantly from 9.26 USD Billion in 2024 to 19.86 USD Billion by 2035.

    Key Market Trends & Highlights

    Crash Barrier Systems Key Trends and Highlights

    • The market is expected to achieve a compound annual growth rate (CAGR) of 7.19 percent from 2025 to 2035.
    • By 2035, the market valuation is anticipated to reach 19.9 USD Billion, indicating robust growth potential.
    • in 2024, the market is valued at 9.26 USD Billion, reflecting a strong foundation for future expansion.
    • Growing adoption of advanced safety technologies due to increasing road safety regulations is a major market driver.

    Market Size & Forecast

    2024 Market Size 9.26 (USD Billion)
    2035 Market Size 19.86 (USD Billion)
    CAGR (2025-2035) 7.18%
    Largest Regional Market Share in 2024 south_america)

    Major Players

    Barrier1 Systems, LLC, Arbus Limited, Hill Smith Holdings PLC, Avon Barrier Corporation Ltd, Lindsay Corporation, Nucor Corporation, N.V. Bekaert S.A., Trinity Industries, Inc., Transpo Industries, Inc., Valmont Industries, Inc.

    Market Trends

    The ongoing emphasis on road safety and infrastructure resilience appears to drive the adoption of advanced crash barrier systems, reflecting a growing recognition of their role in mitigating vehicular accidents and enhancing public safety.

    U.S. Department of Transportation

    Crash Barrier Systems Market Market Drivers

    Increasing Road Safety Regulations

    The Global Crash Barrier Systems Market Industry is experiencing growth due to the implementation of stringent road safety regulations across various countries. Governments are increasingly mandating the installation of crash barriers on highways and urban roads to mitigate the risk of accidents. For instance, the Federal Highway Administration in the United States has established guidelines that necessitate the use of crash barriers in high-risk areas. This regulatory push is expected to contribute to the market's expansion, with the industry projected to reach 9.26 USD Billion in 2024, reflecting a growing awareness of road safety.

    Market Segment Insights

    By Type Insights

    The  crash barrier systems market segmentation, based on type, is portable and fixed. The  crash barrier systems market growth was prominently high under the fixed category in 2021. Fixed crash barriers operate as safety barriers to prevent crashes and collapses of automobiles into a valley or over the side of the road. The expansion of the portable crash barrier market is a result of recent technological advancements in several different industrial sectors.

    By Technology Insights

    The  crash barrier systems market segmentation, based on technology, is rigid, semi-rigid, and flexible. The rigid segment had a prominent share in 2021. Since kinetic energy is contained within the hitting vehicle, rigid barriers are defined by their limited dynamic deflection during an impact. These barriers have little movement, yield, or deformation during collisions and are constructed of concrete, steel, or a combination of both.

    By Application Insights

    Based on application, the  market is divided into roadside, bridge, median, and work zone. The roadside segment had a prominent share in 2021. Rigid barriers consisting of steel, concrete, or a combination of both are roadside barriers. They are mounted on highway buildings like bridges, retaining walls, or construction sites.

    Global Crash Barrier Systems Market Share, by Region, 2021 (%)

    the crash barrier systems market has been divided into North America, Europe, Asia-Pacific, and the Rest of the World. Europe accounted for the most extensive market share. Asia-Pacific is projected to exhibit the highest CAGR during the review period.

    Europe

    Europe was the most extensive market share in 2021. As there are more traffic accidents, the market expansion in Europe is due to the development of technologically improved buildings. For example, traffic injuries are a severe public health concern in the 53 nations that make up the WHO European Region. The market will also be further driven by European Union initiatives to expand the usage of cutting-edge materials to ensure the structural security of buildings.

    Get more detailed insights about Crash Barrier Systems Market Research Report - Forecast to 2032

    Regional Insights

    Key Companies in the Crash Barrier Systems Market market include

    Industry Developments

    September 2023: The National Highway Traffic Safety Administration (NHTSA) in the US proposed new regulations for stronger guardrails, aiming to improve occupant safety in side-impact crashes. This regulation could influence the design and materials used in crash barrier systems, potentially driving demand for advanced solutions. January 2024: Aximum Group, a global provider of road safety solutions, unveiled a new generation of water-filled crash barriers designed for enhanced safety and sustainability. These barriers utilize water instead of concrete, offering potential benefits in terms of weight reduction, installation ease, and environmental impact.

    Future Outlook

    Crash Barrier Systems Market Future Outlook

    The Crash Barrier Systems Market is projected to grow at a 7.18% CAGR from 2025 to 2035, driven by increasing road safety regulations and infrastructure investments.

    New opportunities lie in:

    • Develop smart crash barrier systems integrating IoT for real-time monitoring.
    • Expand product lines to include eco-friendly materials for sustainability.
    • Leverage advanced manufacturing technologies to reduce costs and enhance durability.

    By 2035, the market is expected to achieve substantial growth, reflecting enhanced safety measures and technological advancements.

    Market Segmentation

    By Type Outlook

    • Portable
    • Fixed

    By Region outlook

    • North America US Canada Mexico
    • US
    • Canada
    • Mexico
    • Europe UK Germany France Italy Spain Rest of Europe
    • UK
    • Germany
    • France
    • Italy
    • Spain
    • Rest of Europe
    • Asia-Pacific China India Japan Australia and New Zealand Rest of Asia-Pacific
    • China
    • India
    • Japan
    • Australia and New Zealand
    • Rest of Asia-Pacific
    • Rest of the World South America Middle East Africa
    • South America
    • Middle East
    • Africa
    • Crash Barrier Systems Market Forecast & Size
    • Market Landscape and Trends
    • Market Influencing Factors
    • Company Profiling
    • Manufacturers
    • Raw Material Suppliers
    • Retailers, Wholesalers, and Distributors
    • Governments, Associations, and Industrial Bodies
    • Investors and Trade Experts

    By Technology Outlook

    • Rigid
    • Semi-rigid
    • Flexible

    By Application Outlook

    • Roadside
    • Median
    • Bridge
    • Work zone

    Report Scope

    Attribute/Metric Details
    Market Size 2024 USD 9.26 Billion
    Market Size 2035 19.86 (Value (USD Billion))
    Compound Annual Growth Rate (CAGR) 7.18% (2025 - 2035)
    Base Year 2024
    Market Forecast Period 2025 - 2035
    Historical Data 2019 & 2020
    Market Forecast Units Value (USD Billion)
    Report Coverage Revenue Forecast, Competitive Landscape, Growth Factors, and Trends
    Segments Covered by Technology, by Application, by Material
    Geographies Covered North America, Europe, Asia-Pacific, and Rest of the World (RoW)
    Countries Covered The U.S, Canada, Germany, France, UK, Italy, Spain, China, Japan, India, Australia, South Korea, and Brazil
    Key Companies Profiled Nucor Corporation, Bekaert SA, Delta Scientific Corporation, Avon Barrier Corporation Ltd, Transpo Industries Inc., FutureNet Group, Gibraltar, Arbus Ltd, Tata Steel Limited, Trinity Industries Inc., Automatic Systems SA, Lindsay Corporation, FutureNet Group Inc., Hill & Smith Holdings PLC, Barrier1 Systems Inc. and Valmont Industries Inc., A-Safe Ltd
    Key Market Opportunities Increase in construction activities Increase in industrialization Rising urbanized population
    Key Market Dynamics Growing construction and automotive industry Increased awareness about road safety
    Market Size 2025 9.93 (Value (USD Billion))

    Market Highlights

    Author

    Snehal Singh
    Assistant Manager - Research

    She holds an experience of about 6+ years in market research and business consulting, working under the spectrum of information communication technology, telecommunications and semiconductor domains. aarti conceptualizes and implements a scalable business strategy and provides strategic leadership to the clients. her expertise lies in market estimation, competitive intelligence, pipeline analysis, customer assessment, etc.

    Leave a Comment

    Latest Comments

    John Doe
    john@example.com

    This is a great article! Really helped me understand the topic better.

    Posted on July 23, 2025, 10:15 AM
    Jane Smith
    jane@domain.com

    Thanks for sharing this. I’ve bookmarked it for later reference.

    Posted on July 22, 2025, 7:45 PM

    FAQs

    What is the expected CAGR for the market during the period that ends in 2035?

    Crash Barrier Systems Market is projected to grow at a CAGR of 7.18% during the forecast period, 2025-2035

    Who are the prominent key players in the Crash Barrier Systems market report?

    Nucor Corporation, Bekaert SA, Delta Scientific Corporation, Avon Barrier Corporation Ltd, Transpo Industries Inc., FutureNet Group, Gibraltar, Arbus Ltd, Tata Steel Limited, Trinity Industries Inc., Automatic Systems SA, Lindsay Corporation

    What are the devices discussed in the Crash Barrier Systems market report?

    The device segment includes water & sand-filled plastic barrels, crash cushions, gating & non gating end treatment, GEAT (guardrails energy absorbent terminals), and others.

    Name the applications incorporated in the Crash Barrier Systems market report.

    The applications are Roadside barriers, Median barriers, Bridge barriers, Work-zone barriers, and others (pedestrian footpaths and hilly terrain barriers).

    Which region would trigger a better growth Crash Barrier Systems market?

    The APAC region would enjoy market control and would increase the growth margin.

    What are the types included in the Crash Barrier Systems market report?

    The types are movable and immovable barriers.

    1. \r\n1.1.1. Global Crash Barrier Systems Market, by Type
      1. \r\n1.1.2.
    2. Global Crash Barrier Systems Market, by Technology
      1. \r\n1.1.3. Global Crash
    3. Barrier Systems Market, by Application
      1. \r\n1.1.4. Global Crash Barrier Systems
    4. Market, by Region.
      1. \r\n2. MARKET INTRODUCTION
      2. \r\n2.1. Definition
      3. \r\n2.2.
      4. Scope of the Study
      5. \r\n2.3. Market Structure
      6. \r\n2.4. Key Buying Criteria
      7. \r\n2.5.
      8. Macro Factor Analysis
      9. \r\n3. RESEARCH METHODOLOGY
      10. \r\n3.1. Research
      11. Process
      12. \r\n3.2. Primary Research
      13. \r\n3.3. Secondary Research
      14. \r\n3.4.
      15. Market Size Estimation
      16. \r\n3.5. Forecast Model
      17. \r\n3.6. List of Assumptions
      18. \r\n4.
    5. MARKET DYNAMICS
      1. \r\n4.1. Introduction
      2. \r\n4.2. Drivers
      3. \r\n4.2.1.
      4. Construction and infrastructure sector recovery
      5. \r\n4.2.2. The expansion of
      6. the real estate industry
      7. \r\n4.3. Restraints
      8. \r\n4.3.1. High maintenance
      9. and repair
      10. \r\n4.4. Opportunities
      11. \r\n4.4.1. Growth potential in developing
      12. and emerging economies
      13. \r\n4.5. Covid 19 Impact Analysis
      14. \r\n4.5.1.
      15. Impact on Overall Global Crash Barrier Systems Industry
      16. \r\n4.5.1.1. Economic
      17. Impact
      18. \r\n4.5.2. Impact on Global Crash Barrier Systems Market
      19. \r\n4.5.3.
      20. Impact on Supply Chain
      21. \r\n4.5.3.1. Price Variation of Key Raw Materials
      22. \r\n4.5.3.2.
      23. Production Shutdown
      24. \r\n4.5.3.3. Cash Flow Constraints
      25. \r\n4.5.3.4.
      26. Impact on Import/Export
      27. \r\n4.5.4. Impact on Market Demand
      28. \r\n4.5.4.1.
      29. Impact due to restrictions/lockdown
      30. \r\n4.5.4.2. Consumer Sentiments
      31. \r\n4.5.5.
      32. Impact on Pricing
      33. \r\n5. MARKET FACTOR ANALYSIS
      34. \r\n5.1. Value
      35. Chain Analysis/Supply Chain Analysis
      36. \r\n5.2. Porter’s Five Forces Model
      37. \r\n5.2.1.
      38. Bargaining Power of Suppliers
      39. \r\n5.2.2. Bargaining Power of Buyers
      40. \r\n5.2.3.
      41. Threat of New Entrants
      42. \r\n5.2.4. Threat of Substitutes
      43. \r\n5.2.5. Intensity
      44. of Rivalry
      45. \r\n6. GLOBAL CRASH BARRIER SYSTEMS MARKET ESTIMATES & FORECAST,
      46. BY TYPE
      47. \r\n6.1. Introduction
      48. \r\n6.2. Portable
      49. \r\n6.3. Fixed
      50. \r\n7.
    6. GLOBAL CRASH BARRIER SYSTEMS MARKET ESTIMATES & FORECAST, BY TECHNOLOGY
      1. \r\n7.1.
      2. Introduction
      3. \r\n7.2. Rigid
      4. \r\n7.3. Flexible
      5. \r\n7.4. Semi-Rigid
      6. \r\n8.
    7. GLOBAL CRASH BARRIER SYSTEMS MARKET ESTIMATES & FORECAST, BY APPLICATION
      1. \r\n8.1.
      2. Introduction
      3. \r\n8.2. Roadside
      4. \r\n8.3. Median
      5. \r\n8.4.
      6. Bridge
      7. \r\n8.5. Work Zone
      8. \r\n9. GLOBAL CRASH BARRIER SYSTEMS
    8. MARKET ESTIMATES & FORECAST, BY REGION
      1. \r\n9.1. Introduction
      2. \r\n9.2.
      3. North America
      4. \r\n9.2.1. North America Global Crash Barrier Systems by Type
      5. (USD Billion, 2018 -2032)
      6. \r\n9.2.2. North America Global Crash Barrier Systems
      7. by Technology (USD Billion, 2018 -2032)
      8. \r\n9.2.3. North America Global Crash
      9. Barrier Systems by Application (USD Billion, 2018 -2032)
      10. \r\n9.2.4. US
      11. \r\n9.2.4.1.
      12. US Global Crash Barrier Systems by Type (USD Billion, 2018 -2032)
      13. \r\n9.2.4.2.
      14. US Global Crash Barrier Systems by Technology (USD Billion, 2018 -2032)
      15. \r\n9.2.4.3.
      16. US Global Crash Barrier Systems by Application (USD Billion, 2018 -2032)
      17. \r\n9.2.5.
      18. Canada
      19. \r\n9.2.5.1. Canada Global Crash Barrier Systems by Type (USD Billion,
      20. \r\n9.2.5.2. Canada Global Crash Barrier Systems by Technology
      21. (USD Billion, 2018 -2032)
      22. \r\n9.2.5.3. Canada Global Crash Barrier Systems
      23. by Application (USD Billion, 2018 -2032)
      24. \r\n9.2.6. Mexico
      25. \r\n9.2.6.1.
      26. Mexico Global Crash Barrier Systems by Type (USD Billion, 2018 -2032)
      27. \r\n9.2.6.2.
      28. Mexico Global Crash Barrier Systems by Technology (USD Billion, 2018 -2032)
      29. \r\n9.2.6.3.
      30. Mexico Global Crash Barrier Systems by Application (USD Billion, 2018 -2032)
      31. \r\n9.3.
      32. Europe
      33. \r\n9.3.1. Europe Global Crash Barrier Systems by Type (USD Billion,
      34. \r\n9.3.2. Europe Global Crash Barrier Systems by Technology (USD
      35. Billion, 2018 -2032)
      36. \r\n9.3.3. Europe Global Crash Barrier Systems by Application
      37. (USD Billion, 2018 -2032)
      38. \r\n9.3.4. Germany
      39. \r\n9.3.4.1. Germany Global
      40. Crash Barrier Systems by Type (USD Billion, 2018 -2032)
      41. \r\n9.3.4.2. Germany
      42. Global Crash Barrier Systems by Technology (USD Billion, 2018 -2032)
      43. \r\n9.3.4.3.
      44. Germany Global Crash Barrier Systems by Application (USD Billion, 2018 -2032)
      45. \r\n9.3.5.
      46. France
      47. \r\n9.3.5.1. France Global Crash Barrier Systems by Type (USD Billion,
      48. \r\n9.3.5.2. France Global Crash Barrier Systems by Technology
      49. (USD Billion, 2018 -2032)
      50. \r\n9.3.5.3. France Global Crash Barrier Systems
      51. by Application (USD Billion, 2018 -2032)
      52. \r\n9.3.6. UK
      53. \r\n9.3.6.1.
      54. UK Global Crash Barrier Systems by Type (USD Billion, 2018 -2032)
      55. \r\n9.3.6.2.
      56. UK Global Crash Barrier Systems by Technology (USD Billion, 2018 -2032)
      57. \r\n9.3.6.3.
      58. UK Global Crash Barrier Systems by Application (USD Billion, 2018 -2032)
      59. \r\n9.3.7.
      60. Italy
      61. \r\n9.3.7.1. Italy Global Crash Barrier Systems by Type (USD Billion,
      62. \r\n9.3.7.2. Italy Global Crash Barrier Systems by Technology
      63. (USD Billion, 2018 -2032)
      64. \r\n9.3.7.3. Italy Global Crash Barrier Systems
      65. by Application (USD Billion, 2018 -2032)
      66. \r\n9.3.8. Spain
      67. \r\n9.3.8.1.
      68. Spain Global Crash Barrier Systems by Type (USD Billion, 2018 -2032)
      69. \r\n9.3.8.2.
      70. Spain Global Crash Barrier Systems by Technology (USD Billion, 2018 -2032)
      71. \r\n9.3.8.3.
      72. Spain Global Crash Barrier Systems by Application (USD Billion, 2018 -2032)
      73. \r\n9.3.9.
      74. Rest of Europe
      75. \r\n9.3.9.1. Rest of Europe Global Crash Barrier Systems by
      76. Type (USD Billion, 2018 -2032)
      77. \r\n9.3.9.2. Rest of Europe Global Crash Barrier
      78. Systems by Technology (USD Billion, 2018 -2032)
      79. \r\n9.3.9.3. Rest of Europe
      80. Global Crash Barrier Systems by Application (USD Billion, 2018 -2032)
      81. \r\n9.4.
      82. Asia-Pacific
      83. \r\n9.4.1. Asia-Pacific Global Crash Barrier Systems by Type
      84. (USD Billion, 2018 -2032)
      85. \r\n9.4.2. Asia-Pacific Global Crash Barrier Systems
      86. by Technology (USD Billion, 2018 -2032)
      87. \r\n9.4.3. Asia-Pacific Global Crash
      88. Barrier Systems by Application (USD Billion, 2018 -2032)
      89. \r\n9.4.4. China
      90. \r\n9.4.4.1.
      91. China Global Crash Barrier Systems by Type (USD Billion, 2018 -2032)
      92. \r\n9.4.4.2.
      93. China Global Crash Barrier Systems by Technology (USD Billion, 2018 -2032)
      94. \r\n9.4.4.3.
      95. China Global Crash Barrier Systems by Application (USD Billion, 2018 -2032)
      96. \r\n9.4.5.
      97. India
      98. \r\n9.4.5.1. India Global Crash Barrier Systems by Type (USD Billion,
      99. \r\n9.4.5.2. India Global Crash Barrier Systems by Technology
      100. (USD Billion, 2018 -2032)
      101. \r\n9.4.5.3. India Global Crash Barrier Systems
      102. by Application (USD Billion, 2018 -2032)
      103. \r\n9.4.6. Japan
      104. \r\n9.4.6.1.
      105. Japan Global Crash Barrier Systems by Type (USD Billion, 2018 -2032)
      106. \r\n9.4.6.2.
      107. Japan Global Crash Barrier Systems by Technology (USD Billion, 2018 -2032)
      108. \r\n9.4.6.3.
      109. Japan Global Crash Barrier Systems by Application (USD Billion, 2018 -2032)
      110. \r\n9.4.7.
      111. Australia & New Zealand
      112. \r\n9.4.7.1. Australia & New Zealand Global
      113. Crash Barrier Systems by Type (USD Billion, 2018 -2032)
      114. \r\n9.4.7.2. Australia
      115. & New Zealand Global Crash Barrier Systems by Technology (USD Billion, 2018
      116. -2032)
      117. \r\n9.4.7.3. Australia & New Zealand Global Crash Barrier Systems
      118. by Application (USD Billion, 2018 -2032)
      119. \r\n9.4.8. Rest of Asia-Pacific
      120. \r\n9.4.8.1.
      121. Rest of Asia-Pacific Global Crash Barrier Systems by Type (USD Billion, 2018 -2032)
      122. \r\n9.4.8.2.
      123. Rest of Asia-Pacificl Global Crash Barrier Systems by Technology (USD Billion, 2018
      124. -2032)
      125. \r\n9.4.8.3. Rest of Asia-Pacific Global Crash Barrier Systems by Application
      126. (USD Billion, 2018 -2032)
      127. \r\n9.5. Middle East and Africa
      128. \r\n9.5.1.
      129. Middle East and Africa Global Crash Barrier Systems by Type (USD Billion, 2018 -2032)
      130. \r\n9.5.2.
      131. Middle East and Africa Global Crash Barrier Systems by Technology (USD Billion,
      132. \r\n9.5.3. Middle East and Africa Global Crash Barrier Systems
      133. by Application (USD Billion, 2018 -2032)
      134. \r\n9.5.4. Saudi Arabia
      135. \r\n9.5.4.1.
      136. Saudi Arabia Global Crash Barrier Systems by Type (USD Billion, 2018 -2032)
      137. \r\n9.5.4.2.
      138. Saudi Arabia Global Crash Barrier Systems by Technology (USD Billion, 2018 -2032)
      139. \r\n9.5.4.3.
      140. Saudi Arabia Global Crash Barrier Systems by Application (USD Billion, 2018 -2032)
      141. \r\n9.5.5.
      142. South Africa
      143. \r\n9.5.5.1. South Africa Global Crash Barrier Systems by Type
      144. (USD Billion, 2018 -2032)
      145. \r\n9.5.5.2. South Africa Global Crash Barrier Systems
      146. by Technology (USD Billion, 2018 -2032)
      147. \r\n9.5.5.3. South Africa Global Crash
      148. Barrier Systems by Application (USD Billion, 2018 -2032)
      149. \r\n9.5.6. UAE
      150. \r\n9.5.6.1.
      151. UAE Global Crash Barrier Systems by Type (USD Billion, 2018 -2032)
      152. \r\n9.5.6.2.
      153. UAE Global Crash Barrier Systems by Technology (USD Billion, 2018 -2032)
      154. \r\n9.5.6.3.
      155. UAE Global Crash Barrier Systems by Application (USD Billion, 2018 -2032)
      156. \r\n9.5.7.
      157. Rest of MEA
      158. \r\n9.5.7.1. Rest of MEA Global Crash Barrier Systems by Type
      159. (USD Billion, 2018 -2032)
      160. \r\n9.5.7.2. Rest of MEA Global Crash Barrier Systems
      161. by Technology (USD Billion, 2018 -2032)
      162. \r\n9.5.7.3. Rest of MEA Global Crash
      163. Barrier Systems by Application (USD Billion, 2018 -2032)
      164. \r\n9.6. South America
      165. \r\n9.6.1.
      166. South America Global Crash Barrier Systems by Type (USD Billion, 2018 -2032)
      167. \r\n9.6.2.
      168. South America Global Crash Barrier Systems by Technology (USD Billion, 2018 -2032)
      169. \r\n9.6.3.
      170. South America Global Crash Barrier Systems by Application (USD Billion, 2018 -2032)
      171. \r\n9.6.4.
      172. Brazil
      173. \r\n9.6.4.1. Brazil Global Crash Barrier Systems by Type (USD Billion,
      174. \r\n9.6.4.2. Brazil Global Crash Barrier Systems by Technology
      175. (USD Billion, 2018 -2032)
      176. \r\n9.6.4.3. Brazil Global Crash Barrier Systems
      177. by Application (USD Billion, 2018 -2032)
      178. \r\n9.6.5. Argentina
      179. \r\n9.6.5.1.
      180. Argentina Global Crash Barrier Systems by Type (USD Billion, 2018 -2032)
      181. \r\n9.6.5.2.
      182. Argentina Global Crash Barrier Systems by Technology (USD Billion, 2018 -2032)
      183. \r\n9.6.5.3.
      184. Argentina Global Crash Barrier Systems by Application (USD Billion, 2018 -2032)
      185. \r\n9.6.6.
      186. Rest of South America
      187. \r\n9.6.6.1. Rest of South America Global Crash Barrier
      188. Systems by Type (USD Billion, 2018 -2032)
      189. \r\n9.6.6.2. Rest of South America
      190. Global Crash Barrier Systems by Technology (USD Billion, 2018 -2032)
      191. \r\n9.6.6.3.
      192. Rest of South America Global Crash Barrier Systems by Application (USD Billion,
      193. \r\n10. COMPETITIVE LANDSCAPE
      194. \r\n10.1. Introduction
      195. \r\n10.2.
      196. Key Players Market Share Analysis, 2022 (%)
      197. \r\n10.3. Competitive Benchmarking
      198. \r\n10.4.
      199. Competitor Dashboard
      200. \r\n10.5. Major Growth Strategy in the Market
      201. \r\n10.6.
      202. Key Developments & Growth Strategies
      203. \r\n10.6.1. New Product Development
      204. \r\n10.6.2.
      205. Mergers & Acquisitions
      206. \r\n10.6.3. Contracts & Agreements
      207. \r\n10.6.4.
      208. Expansions & Investments
      209. \r\n11. COMPANY PROFILES
      210. \r\n11.1. Nucor
      211. Corporation
      212. \r\n11.1.1. Company Overview
      213. \r\n11.1.2. Financial Overview
      214. \r\n11.1.3.
      215. Products Offered
      216. \r\n11.1.4. Key Developments
      217. \r\n11.1.5. SWOT Analysis
      218. \r\n11.1.6.
      219. Key Strategies
      220. \r\n11.2. Bekaert SA
      221. \r\n11.2.1. Company Overview
      222. \r\n11.2.2.
      223. Financial Overview
      224. \r\n11.2.3. Products Offered
      225. \r\n11.2.4. Key Developments
      226. \r\n11.2.5.
      227. SWOT Analysis
      228. \r\n11.2.6. Key Strategies
      229. \r\n11.3. Delta Scientific
      230. Corporation
      231. \r\n11.3.1. Company Overview
      232. \r\n11.3.2. Financial Overview
      233. \r\n11.3.3.
      234. Products Offered
      235. \r\n11.3.4. Key Developments
      236. \r\n11.3.5. SWOT Analysis
      237. \r\n11.3.6.
      238. Key Strategies
      239. \r\n11.4. Avon Barrier Corporation Ltd
      240. \r\n11.4.1. Company
      241. Overview
      242. \r\n11.4.2. Financial Overview
      243. \r\n11.4.3. Products Offered
      244. \r\n11.4.4.
      245. Key Developments
      246. \r\n11.4.5. SWOT Analysis
      247. \r\n11.4.6. Key Strategies
      248. \r\n11.5.
      249. Transpo Industries Inc.
      250. \r\n11.5.1. Company Overview
      251. \r\n11.5.2. Financial
      252. Overview
      253. \r\n11.5.3. Products Offered
      254. \r\n11.5.4. Key Developments
      255. \r\n11.5.5.
      256. SWOT Analysis
      257. \r\n11.5.6. Key Strategies
      258. \r\n11.6. FutureNet Group
      259. \r\n11.6.1.
      260. Company Overview
      261. \r\n11.6.2. Financial Overview
      262. \r\n11.6.3. Products
      263. Offered
      264. \r\n11.6.4. Key Developments
      265. \r\n11.6.5. SWOT Analysis
      266. \r\n11.6.6.
      267. Key Strategies
      268. \r\n11.7. Gibraltar
      269. \r\n11.7.1. Company Overview
      270. \r\n11.7.2.
      271. Financial Overview
      272. \r\n11.7.3. Products Offered
      273. \r\n11.7.4. Key Developments
      274. \r\n11.7.5.
      275. SWOT Analysis
      276. \r\n11.7.6. Key Strategies
      277. \r\n11.8. Arbus Ltd
      278. \r\n11.8.1.
      279. Company Overview
      280. \r\n11.8.2. Financial Overview
      281. \r\n11.8.3. Products
      282. Offered
      283. \r\n11.8.4. Key Developments
      284. \r\n11.8.5. SWOT Analysis
      285. \r\n11.8.6.
      286. Key Strategies
      287. \r\n11.9. Tata Steel Limited
      288. \r\n11.9.1. Company Overview
      289. \r\n11.9.2.
      290. Financial Overview
      291. \r\n11.9.3. Products Offered
      292. \r\n11.9.4. Key Developments
      293. \r\n11.9.5.
      294. SWOT Analysis
      295. \r\n11.9.6. Key Strategies
      296. \r\n11.10. Trinity Industries
      297. Inc.
      298. \r\n11.10.1. Company Overview
      299. \r\n11.10.2. Financial Overview
      300. \r\n11.10.3.
      301. Products Offered
      302. \r\n11.10.4. Key Developments
      303. \r\n11.10.5. SWOT Analysis
      304. \r\n11.10.6.
      305. Key Strategies
      306. \r\n
      307. \r\nLIST OF TABLES
      308. \r\nTable 1: Global
    9. Crash Barrier Systems Market, By Region, 2018 -2032
      1. \r\nTable 2: North America:
    10. Global Crash Barrier Systems Market, By Technology, 2018 -2032
      1. \r\nTable 3:
    11. North America: Global Crash Barrier Systems Market, By Application, 2018 -2032
      1. \r\nTable
    12. 4: North America: Global Crash Barrier Systems Market, By Type, 2018 -2032
      1. \r\nTable
    13. 5: Europe: Global Crash Barrier Systems Market, By Technology, 2018 -2032
      1. \r\nTable
    14. 6: Europe: Global Crash Barrier Systems Market, By Application, 2018 -2032
      1. \r\nTable
    15. 7: Europe: Global Crash Barrier Systems Market, By Type, 2018 -2032
      1. \r\nTable
    16. 8: Asia-Pacific: Global Crash Barrier Systems Market, By Technology, 2018 -2032
      1. \r\nTable
    17. 9: Asia-Pacific: Global Crash Barrier Systems Market, By Application, 2018 -2032
      1. \r\nTable
    18. 10: Asia-Pacific: Global Crash Barrier Systems Market, By Type, 2018 -2032
      1. \r\nTable
    19. 11: Middle East & Africa: Global Crash Barrier Systems Market, By Technology,
      1. \r\nTable 12: Middle East & Africa: Global Crash Barrier Systems
    20. Market, By Application, 2018 -2032
      1. \r\nTable 13: Middle East & Africa:
    21. Global Crash Barrier Systems Market, By Type, 2018 -2032
      1. \r\nTable 14: South
    22. America: Global Crash Barrier Systems Market, By Technology, 2018 -2032
      1. \r\nTable
    23. 15: South America: Global Crash Barrier Systems Market, By Application, 2018 -2032
      1. \r\nTable
    24. 16: South America: Global Crash Barrier Systems Market, By Type, 2018 -2032
      1. \r\n
      2. \r\n
      3. \r\n
      4. \r\nList
      5. Of Figures
      6. \r\nFIGURE 1 MARKET SYNOPSIS
      7. \r\nFIGURE 2 MARKET ATTRACTIVENESS
      8. ANALYSIS: GLOBAL CRASH BARRIER SYSTEMS MARKET
      9. \r\nFIGURE 3 GLOBAL CRASH
    25. BARRIER SYSTEMS MARKET ANALYSIS, BY TYPE
      1. \r\nFIGURE 4 GLOBAL CRASH BARRIER
    26. SYSTEMS MARKET ANALYSIS, BY TECHNOLOGY
      1. \r\nFIGURE 5 GLOBAL CRASH BARRIER SYSTEMS
    27. MARKET ANALYSIS, BY APPLICATION
      1. \r\nFIGURE 6 GLOBAL CRASH BARRIER SYSTEMS
    28. MARKET ANALYSIS, BY REGION
      1. \r\nFIGURE 7 GLOBAL CRASH BARRIER SYSTEMS MARKET:
      2. STRUCTURE
      3. \r\nFIGURE 8 RESEARCH PROCESS
      4. \r\nFIGURE 9 TOP-DOWN AND BOTTOM-UP
      5. APPROACHES
      6. \r\nFIGURE 10 MARKET DYNAMICS: GLOBAL CRASH BARRIER SYSTEMS MARKET
      7. \r\nFIGURE
    29. DRIVERS: IMPACT ANALYSIS
      1. \r\nFIGURE 12 RESTRAINT: IMPACT ANALYSIS
      2. \r\nFIGURE
    30. SUPPLY CHAIN ANALYSIS: GLOBAL CRASH BARRIER SYSTEMS MARKET
      1. \r\nFIGURE 14
      2. PORTER'S FIVE FORCES ANALYSIS: GLOBAL CRASH BARRIER SYSTEMS MARKET
      3. \r\nFIGURE
    31. GLOBAL CRASH BARRIER SYSTEMS MARKET, BY TYPE, 2022 (% SHARE)
      1. \r\nFIGURE
    32. GLOBAL CRASH BARRIER SYSTEMS MARKET, BY TECHNOLOGY, 2022 (% SHARE)
      1. \r\nFIGURE
    33. GLOBAL CRASH BARRIER SYSTEMS MARKET, BY APPLICATION, 2022 (% SHARE)
      1. \r\nFIGURE
    34. GLOBAL CRASH BARRIER SYSTEMS MARKET SHARE, BY REGION, 2022 (% SHARE)
      1. \r\nFIGURE
    35. NORTH AMERICA: GLOBAL CRASH BARRIER SYSTEMS MARKET SHARE, BY COUNTRY, 2022 (%
      1. SHARE)
      2. \r\nFIGURE 20 EUROPE: GLOBAL CRASH BARRIER SYSTEMS MARKET SHARE, BY
      3. COUNTRY, 2022 (% SHARE)
      4. \r\nFIGURE 21 ASIA PACIFIC: GLOBAL CRASH BARRIER SYSTEMS
    36. MARKET SHARE, BY COUNTRY, 2022 (% SHARE)
      1. \r\nFIGURE 22 MIDDLE EAST & AFRICA:
    37. GLOBAL CRASH BARRIER SYSTEMS MARKET SHARE, BY COUNTRY, 2022 (% SHARE)
      1. \r\nFIGURE
    38. SOUTH AMERICA: GLOBAL CRASH BARRIER SYSTEMS MARKET SHARE, BY COUNTRY, 2022 (%
      1. SHARE)
      2. \r\nFIGURE 24 MAJOR MANUFACTURERS MARKET SHARE ANALYSIS, 2022
      3. \r\nFIGURE
    39. CONTRACTS & AGREEMENTS: THE MAJOR STRATEGY ADOPTED BY KEY PLAYERS IN THE
    40. GLOBAL CRASH BARRIER SYSTEMS MARKET
      1. \r\nFIGURE 26 NUCOR CORPORATION:
      2. FINANCIAL OVERVIEW SNAPSHOT
      3. \r\nFIGURE 27 NUCOR CORPORATION:
    41. SWOT ANALYSIS
      1. \r\nFIGURE 28 BEKAERT SA: FINANCIAL OVERVIEW SNAPSHOT
      2. \r\nFIGURE
    42. BEKAERT SA: SWOT ANALYSIS
      1. \r\nFIGURE 30 DELTA SCIENTIFIC CORPORATION: FINANCIAL
      2. OVERVIEW SNAPSHOT
      3. \r\nFIGURE 31 DELTA SCIENTIFIC CORPORATION: SWOT ANALYSIS
      4. \r\nFIGURE
    43. AVON BARRIER CORPORATION LTD: FINANCIAL OVERVIEW SNAPSHOT
      1. \r\nFIGURE 33
      2. AVON BARRIER CORPORATION LTD: SWOT ANALYSIS
      3. \r\nFIGURE 34 TRANSPO INDUSTRIES
      4. INC.: FINANCIAL OVERVIEW SNAPSHOT
      5. \r\nFIGURE 35 TRANSPO INDUSTRIES INC.: SWOT
      6. ANALYSIS
      7. \r\nFIGURE 36 FUTURENET GROUP: FINANCIAL OVERVIEW SNAPSHOT
      8. \r\nFIGURE
    44. FUTURENET GROUP: SWOT ANALYSIS
      1. \r\nFIGURE 38 GIBRALTAR: FINANCIAL OVERVIEW
      2. SNAPSHOT
      3. \r\nFIGURE 39 GIBRALTAR: SWOT ANALYSIS
      4. \r\nFIGURE 40 ARBUS
      5. LTD: FINANCIAL OVERVIEW SNAPSHOT
      6. \r\nFIGURE 41 ARBUS LTD: SWOT ANALYSIS
      7. \r\nFIGURE
    45. TATA STEEL LIMITED: FINANCIAL OVERVIEW SNAPSHOT
      1. \r\nFIGURE 43 TATA STEEL
      2. LIMITED: SWOT ANALYSIS
      3. \r\nFIGURE 44 TRINITY INDUSTRIES INC.: FINANCIAL OVERVIEW
      4. SNAPSHOT
      5. \r\nFIGURE 45 TRINITY INDUSTRIES INC.: SWOT ANALYSIS
      6. \r\n
      7. \r\n
      8. \r\n
      9. \r\n
      10. \r\n

    Crash Barrier Systems Market Segmentation

    Market Segmentation Overview

    • Detailed segmentation data will be available in the full report
    • Comprehensive analysis by multiple parameters
    • Regional and country-level breakdowns
    • Market size forecasts by segment
    Infographic

    Free Sample Request

    Kindly complete the form below to receive a free sample of this Report

    Get Free Sample

    Customer Strories

    “I am very pleased with how market segments have been defined in a relevant way for my purposes (such as "Portable Freezers & refrigerators" and "last-mile"). In general the report is well structured. Thanks very much for your efforts.”

    Victoria Milne

    Founder
    Case Study
    Chemicals and Materials