Customer Information System Market

Key Players: Oracle Corporation, SAP SE, Hansen Technologies, Itineris (Group), Open International, Gentrack Group, Cayenta (Harris Computer), Fluentgrid

Customer Information System Market

Customer Information System Market Size, Share and Research Report: By Deployment Model (On-Premises, Cloud-Based, Hybrid), By Components (Software, Services), By Application Domains (Retail, Telecommunications, Banking and Financial Services, Healthcare, Education), By User Type (Small and Medium Enterprises (SMEs), Large Enterprises), By Functionality (Customer Data Management, Analytics and Reporting, Lead Management, Customer Engagement) and By Regional (North America, Europe, South America, Asia Pacific, Middle East and Africa) - Industry Forecast to 2035
ID: MRFR/ICT/29732-HCR
128 Pages
Nirmit Biswas, Aarti Dhapte
Last Updated: June 22, 2026

Customer Information System Market Summary

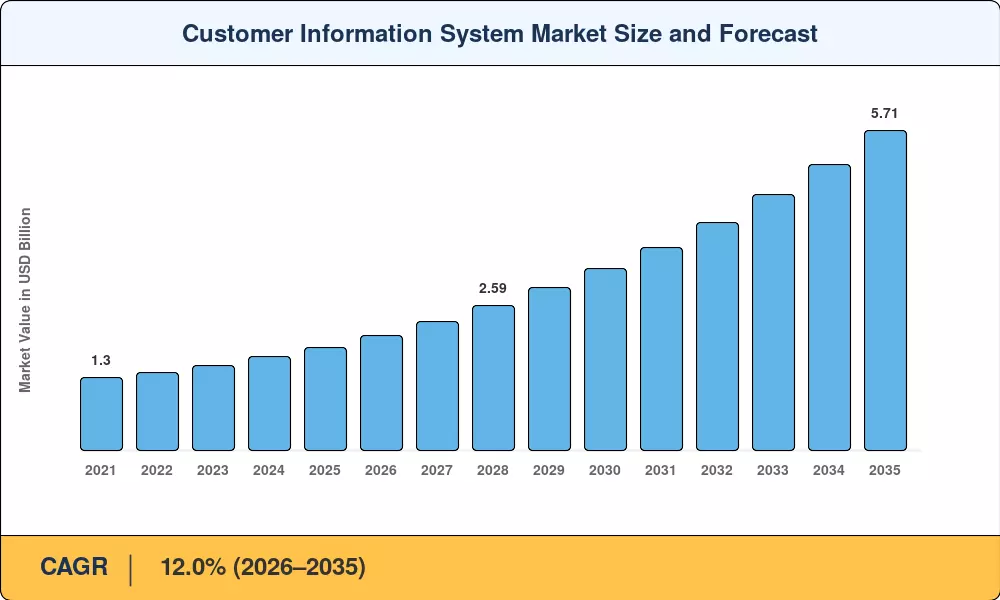
The customer information system market reached an estimated USD 1.84 billion in 2025 and is projected to grow from USD 2.06 billion in 2026 to USD 5.71 billion by 2035, registering a compound annual growth rate of 12.0% during the forecast period. Regulatory mandates on billing transparency — including FERC Order 2222 provisions and state-level consumer protection statutes — have compelled utilities and large enterprises to replace aging account management platforms with modern, API-driven architectures [1]. Capital expenditure commitments from the top 20 North American investor-owned utilities alone exceeded USD 4.8 billion for IT modernization programs between 2023 and 2025 [2].

The transformation reshaping the customer information system market centers on migrating from monolithic, on-premises billing engines — many of them 15 to 25 years old — toward cloud-native platforms that unify metering, billing, and real-time engagement layers. Southern California Gas Company's multi-year CIS replacement program, budgeted at over USD 300 million, illustrates the scale of these transitions [3]. Similar programs are underway at Enel, Tokyo Electric Power, and several UK water authorities, signaling that this is a global phenomenon rather than a North American outlier.

North America commands roughly 36.4% of the customer information system market, anchored by early smart-grid adoption and complex rate structures that demand sophisticated billing logic. Asia-Pacific is the fastest-growing region at a projected 16.4% CAGR, fueled by smart-city initiatives across India, China, and Southeast Asia. Europe holds the second-largest share at approximately 26.1%, driven by EU energy market deregulation timelines. The next decade will see competitive intensity sharpen as cloud vendors and legacy incumbents converge on the same digital-core value proposition.


Key Report Takeaways

• By Deployment

  • On-premises installations accounted for 64.5% of customer information system market revenue in 2025, reflecting the entrenched nature of legacy billing infrastructure across regulated utilities.
  • Cloud-based CIS deployments are forecast to expand at a 19.4% CAGR through 2035, outpacing the overall customer information system market growth rate by a significant margin.

• By Component

  • The solutions segment held 74.6% revenue share of the customer information system market in 2025, encompassing billing engines, meter-data management modules, and customer self-service portals.
  • Services — including implementation, migration consulting, and managed operations — are expected to register a 15.6% CAGR to 2035.

• By End-User

  • Energy and utilities represented 47.8% of the customer information system market in 2025, making it the largest vertical by a wide margin.
  • The retail CRM vertical is projected to post the fastest growth at a 17.2% CAGR, driven by omnichannel engagement demands.

• By Region

  • North America led the customer information system market with a 36.4% share in 2025, supported by advanced metering infrastructure rollouts.
  • Asia-Pacific is positioned as the fastest-growing region at 16.4% CAGR, underpinned by urbanization and national digitization agendas.


Market Size and Forecast (2021–2035)

Market Research Future employs a triangulated research methodology combining primary interviews with CIS vendors and utility CIOs, bottom-up revenue modeling from disclosed contract values, and top-down validation against macroeconomic IT-spending benchmarks published by and.

Customer Information System Market Size and Forecast
Our Impact
Enabled $4.3B Revenue Impact for Fortune 500 and Leading Multinationals
Partnering with 2000+ Global Organizations Each Year
30K+ Citations by Top-Tier Firms in the Industry

Driver Impact Analysis

Driver ~% Impact on CAGR Geographic Relevance Impact Timeline
Regulatory billing accuracy mandates +2.8% North America, Europe Short-term (≤2 yr)
Cloud-native platform migration +2.5% Global Medium-term (2–4 yr)
Smart-meter and AMI data integration +2.1% North America, Asia-Pacific Short-term (≤2 yr)
Distributed energy resource management +1.7% Europe, North America Medium-term (2–4 yr)
Real-time customer self-service portals +1.4% Global Medium-term (2–4 yr)
Prepaid and flexible billing models +1.1% Asia-Pacific, Africa Long-term (≥4 yr)
AI-powered demand forecasting +0.9% Global Long-term (≥4 yr)


Regulatory Billing Accuracy Mandates

Public utility commissions across more than 30 US states now enforce billing-accuracy thresholds that require utilities to demonstrate error rates below 0.5% on residential accounts [1]. The California Public Utilities Commission, for instance, mandated that all investor-owned utilities deploy modernized CIS platforms capable of supporting time-of-use rate structures by 2026, with non-compliance penalties reaching USD 10 million per incident [3]. These regulatory pressures are accelerating replacement cycles for the customer information system market, particularly among mid-tier utilities that previously relied on manual billing adjustments.

Cloud-Native Platform Migration

estimates that 45% of utility enterprises will run their primary CIS workloads on public or hybrid cloud infrastructure by 2028, up from just 18% in 2023 [6]. The economic case is compelling: cloud deployments reduce total cost of ownership by 25–35% over a seven-year horizon while cutting upgrade cycles from 18 months to continuous delivery. This structural shift is the single largest growth catalyst for the customer information system market, and it disproportionately benefits vendors with multi-tenant SaaS architectures.

Smart-Meter and AMI Data Integration

The global installed base of smart meters surpassed 1.3 billion units by the end of 2024, generating terabytes of interval data that legacy CIS platforms were never designed to ingest [7]. Utilities deploying advanced metering infrastructure require CIS solutions capable of processing 15-minute or sub-hourly meter reads, calculating complex rate schedules in real time, and pushing usage alerts to customer-facing mobile applications. The US Department of Energy's Grid Modernization Initiative allocated USD 3.5 billion specifically for metering and data infrastructure between 2022 and 2025 [14].

Distributed Energy Resource Management

As rooftop solar penetration exceeds 10% of residential customers in markets like Germany, Australia, and California, CIS platforms must handle net-metering credits, feed-in tariffs, and bi-directional billing in real time [12]. The International Energy Agency projects that distributed solar capacity will triple globally by 2030, adding 740 GW of behind-the-meter generation that directly increases CIS transaction volumes and complexity [15].


Restraints Impact Analysis

Restraint ~% Impact on CAGR Geographic Relevance Impact Timeline
High switching costs and vendor lock-in −1.8% Global Long-term (≥4 yr)
Data-migration complexity and risk −1.5% North America, Europe Medium-term (2–4 yr)
Cybersecurity and data-privacy concerns −1.2% Global Short-term (≤2 yr)
Shortage of CIS integration specialists −0.9% Asia-Pacific, Africa Medium-term (2–4 yr)
Regulatory fragmentation across jurisdictions −0.7% Europe, South America Long-term (≥4 yr)


High Switching Costs and Vendor Lock-In

Many utilities operate CIS platforms that have been customized over 15 to 20 years with thousands of bespoke rate configurations, workflow rules, and integration touchpoints [11]. A 2024 survey by Utility Dive found that 62% of utility CIOs cited vendor lock-in as the primary barrier to CIS replacement, with average migration budgets exceeding USD 40 million for utilities serving more than one million accounts [16]. These switching costs dampen the pace at which the customer information system market can convert its addressable pipeline into contracted revenue.

Data-Migration Complexity

Converting decades of historical billing records, customer correspondence, and payment data from legacy schemas to modern platforms remains one of the riskiest phases of any CIS project. Failed or delayed migrations at utilities such as BC Hydro and Western Power Distribution have cost between USD 50 million and USD 150 million in budget overruns and service disruptions [16]. This risk profile makes procurement committees conservative, extending average sales cycles in the customer information system market to 18–24 months.

Cybersecurity and Data-Privacy Concerns

CIS platforms store personally identifiable information for millions of residential and commercial customers, making them high-value targets for cyberattacks. The European Union's Network and Information Systems Directive (NIS2), effective 2024, classifies utility billing systems as essential-service infrastructure subject to mandatory penetration testing and breach-notification protocols [17]. Compliance costs add 8–12% to implementation budgets for the customer information system market in EU member states.


Customer Information System Market Opportunities

SaaS Micro-Utility Platforms for Emerging Markets

In developing nations in Sub-Saharan Africa and South Asia, municipal or cooperative utilities supply nearly 400 million utility connections and have no contemporary billing platform [10]. “Lightweight, SaaS-based CIS solutions that are priced on a per-connection, per-month basis can unlock this segment at price points below USD 0.50 per account per month, opening a greenfield opportunity for the customer information system market worth an estimated USD 600 million by 2032.”


Data Monetization and Energy-as-a-Service Models

Utilities that have granular consumption data can work with demand-response aggregators, insurers and home-automation companies to establish new revenue streams [13]. Vendors embedding analytics APIs and consent-management frameworks in their CIS platforms are well placed to take a slice of the larger energy-data market, which BloombergNEF puts at USD 14 billion by 2030.


AI-Driven Proactive Customer Engagement

Billing pattern machine-learning models can predict payment defaults, detect meter irregularities, and offer customized conservation suggestions prior to the consumer reaching out to the call center [9]. Early adopters like Duke Energy are already seeing 22% reductions in call-center volumes following the rollout of AI-augmented CIS modules.


Water-Sector Digitization Wave

The global water and wastewater sector is still very under-digitized, with less than 20% of water utilities in OECD nations operating current CIS systems [20]. The infrastructure legislation in the US (Bipartisan Infrastructure Law) and EU (Urban Wastewater Treatment Directive amendment) is providing billions for water-utility IT modernization, generating a parallel development vector for the customer information system market.


Unified Multi-Service CIS Platforms

Converged utilities offering electricity, gas, water, and broadband on a single bill are seeking unified CIS platforms that eliminate redundant systems. This trend toward multi-commodity billing is strongest in Western Europe and Australia, where integrated utility models are expanding.


Customer Information System Market Future Outlook

AI-Augmented Billing and Autonomous Operations

Artificial intelligence will move from a supplementary analytics layer to the operational core of CIS platforms by the early 2030s. projects that 60% of Tier-1 utility billing transactions will be processed through AI-driven exception-handling engines by 2032, reducing manual intervention by 70% [9]. The customer information system market will see vendors competing on the sophistication of their embedded AI capabilities rather than traditional billing functionality alone.

Platform Economics and Ecosystem Consolidation

The CIS landscape is converging around platform-as-a-service models where billing, metering, and engagement modules are consumed as composable microservices. This shift favors vendors who control broad ecosystems — expect the top five players to increase their combined share from approximately 38% in 2025 to over 50% by 2032 [11]. Smaller niche vendors will increasingly operate as white-label solution providers or seek acquisition.

Electrification Supercycle and Grid-Edge Complexity

The International Energy Agency forecasts global electricity demand to grow 75% by 2050, driven by electric vehicle charging, heat-pump adoption, and data-center expansion [15]. Each of these load types introduces billing complexity — time-of-use rates, demand charges, vehicle-to-grid credits — that will sustain demand for the customer information system market well beyond the current forecast window. Vendors capable of handling millions of real-time micro-transactions per day will hold a structural advantage.

ESG Reporting and Green Billing Integration

Mandatory Scope 2 and Scope 3 emissions reporting under frameworks such as the EU Corporate Sustainability Reporting Directive and SEC climate-disclosure rules will require CIS platforms to produce carbon-attributed billing statements [21]. Utilities and large commercial customers will demand CIS modules that calculate and display emissions intensity alongside consumption data, creating a differentiated product tier within the customer information system market by 2028.


Customer Information System Market Segmentation

By Deployment

Segment Key Metric (2025) Primary Demand Driver
On-Premises 64.5% share Regulatory data-residency requirements
Cloud 19.4% CAGR (2026–2035) TCO reduction and continuous upgrades


On-premises CIS installations continue to dominate because many regulated utilities face data-sovereignty constraints that prevent customer information from residing on shared cloud infrastructure. However, the customer information system market is tilting rapidly toward cloud as hybrid-deployment models address residency concerns while delivering the agility benefits of SaaS. By 2030, cloud deployments are expected to surpass on-premises in new-contract revenue.

By Component

Segment Key Metric (2025) Primary Demand Driver
Solutions 74.6% share Core billing and MDM platform licensing
Services 15.6% CAGR (2026–2035) Migration consulting and managed operations


The solutions category — encompassing billing engines, customer portals, and analytics dashboards — generates the majority of customer information system market revenue. Services are growing faster because the complexity of migrating from legacy platforms requires extended system-integration engagements that often span 18 to 36 months. Managed-service contracts, where vendors operate the CIS on behalf of the utility, are an emerging delivery model gaining traction among smaller utilities.

By End-User

Segment Key Metric (2025) Primary Demand Driver
Energy and Utilities 47.8% share Rate-structure complexity, AMI integration
Water and Wastewater Management USD 0.28 Billion Infrastructure legislation, loss reduction
BFSI 12.5% share Regulatory KYC and billing compliance
Retail 17.2% CAGR (2026–2035) Omnichannel CRM, loyalty-program billing
Telecommunications USD 0.15 Billion Convergent billing, 5G service tiers
Others 9.8% CAGR (2026–2035) Government and healthcare digitization


Energy and utilities remain the bedrock of the customer information system market, reflecting the sector's unique combination of high transaction volumes, complex tariff schedules, and strict regulatory oversight. The retail CRM segment is emerging as the fastest-growing vertical, as large retailers adopt CIS-style platforms to manage subscription billing, loyalty credits, and real-time promotional pricing across physical and digital channels.


Regional Market Share Analysis

Region Key Metric (2025) Primary Investment Themes
North America 36.4% share AMI integration, regulatory compliance, cloud migration
Europe 26.1% share Market deregulation, NIS2 compliance, multi-commodity billing
Asia-Pacific 16.4% CAGR (2026–2035) Smart-city programs, rural electrification, prepaid metering
South America USD 0.13 Billion Utility privatization, billing-loss reduction
Middle East & Africa USD 0.14 Billion Smart-metering rollouts, water-sector modernization
Total USD 1.84 Billion

The customer information system market exhibits a distinct geographic hierarchy shaped by regulatory maturity, smart-grid penetration, and utility-sector structure.


North America

Country Key Metric Key Driver
US 78.2% of regional share FERC Order 2222, state PUC modernization mandates
Canada 13.8% of regional share Provincial smart-grid programs
Mexico 8.0% of regional share CFE billing modernization


The US dominates North America's customer information system market, driven by a fragmented utility landscape of over 3,000 entities facing simultaneous pressure from regulators and ratepayers to modernize billing accuracy [1]. Canada's CIS spending is concentrated among provincial crown corporations undertaking cloud migrations, while Mexico's Comisión Federal de Electricidad has initiated a multi-phase billing overhaul linked to its smart-meter deployment program [8].

Europe

Country Key Metric Key Driver
Germany 12.7% CAGR Energiewende digital integration
UK USD 0.11 Billion Ofgem switching-program compliance
France 11.8% CAGR Linky meter rollout billing integration
Italy USD 0.06 Billion Multi-utility billing consolidation
Spain 11.5% CAGR Renewable self-consumption billing
Nordic Countries USD 0.05 Billion Real-time settlement mandates
Russia 9.2% CAGR Grid digitization programs
Rest of Europe USD 0.07 Billion EU-funded utility modernization


Europe's customer information system market is shaped by the EU's Clean Energy Package, which requires member states to implement dynamic electricity pricing by 2027, forcing billing-system upgrades across the continent [19]. The UK's Ofgem-mandated faster-switching program, reducing supplier transitions to one business day, has placed significant demands on CIS interoperability.

Asia-Pacific

Country Key Metric Key Driver
China 31.5% of regional share State Grid digital transformation
India 17.8% CAGR RDSS scheme and smart-metering mandates
Japan USD 0.07 Billion Electricity market liberalization
South Korea 15.2% CAGR K-Smart Grid initiative
ASEAN USD 0.04 Billion Utility privatization and modernization
Rest of Asia-Pacific 14.6% CAGR Digital infrastructure investment


Asia-Pacific represents the fastest-growing opportunity for the customer information system market. India's Revamped Distribution Sector Scheme (RDSS), backed by USD 38 billion in central government funding, mandates smart-meter deployment across 250 million connections by 2027 — each requiring CIS integration [8]. China's State Grid Corporation has committed to full digital billing transformation across its 1.1 billion customer accounts by 2030.

South America

Country Key Metric Key Driver
Brazil 58.4% of regional share ANEEL billing modernization
Argentina 13.2% CAGR Utility subsidy reform
Rest of South America USD 0.04 Billion Regional electrification programs


Brazil anchors South America's customer information system market as its regulator, ANEEL enforces increasingly strict billing-accuracy and consumer-transparency requirements across distribution concessionaires [19]. Argentine utilities are modernizing billing systems in response to subsidy-reform programs that introduce consumption-based tariff structures.

Middle East & Africa

Country Key Metric Key Driver
Saudi Arabia 32.8% of regional share Vision 2030 smart-utility programs
UAE 14.9% CAGR DEWA and ADDC digital platforms
South Africa USD 0.03 Billion Revenue-protection and prepaid billing
Egypt 13.5% CAGR National smart-grid roadmap
Rest of MEA USD 0.04 Billion Donor-funded utility modernization


Saudi Arabia's Vision 2030 initiative includes a comprehensive smart-utility modernization program targeting full digital billing coverage by 2028, making it the anchor market in the MEA region for the customer information system market [10]. South Africa's municipalities are investing in CIS platforms with prepaid-metering capabilities to address chronic revenue-collection losses exceeding 30% in some service areas.


Customer Information System Market By Region, 2025-2035

Competitive Benchmarking

The customer information system market exhibits medium concentration, with an estimated Herfindahl-Hirschman Index (HHI) of approximately 1,100. The top five vendors collectively hold around 38% of global revenue, while a long tail of regional specialists and niche players serves localized utility markets [11]. Competition is intensifying as legacy ERP vendors expand their CIS modules and cloud-native startups challenge incumbents on deployment speed and user experience.

Company Est. Revenue Share Range Key Offerings Strategic Positioning
Oracle Corporation ~8–11% Oracle Utilities Customer Cloud Service, MDM Integrated cloud suite for large utilities
SAP SE ~7–10% SAP IS-U, S/4HANA Utilities ERP-embedded CIS for complex tariff environments
Hansen Technologies ~5–8% Hansen CIS, Enoro Mid-market utility specialist, strong in APAC
Itineris (Group) ~4–6% UMAX Platform European water and multi-utility focus
Open International ~3–5% Open Smartflex Latin American and emerging-market specialist
Gentrack Group ~3–5% Gentrack Velocity Cloud-native platform for deregulated markets
Cayenta (Harris Computer) ~2–4% Cayenta Utilities Suite North American municipal and co-op utilities
Fluentgrid ~2–3% Fluentgrid Actilligence Indian market leader, smart-grid integration
NorthStar Utilities Solutions ~2–3% CIS and MDM Suite Mid-tier North American utilities
Ferranti Computer Systems ~1–3% Ferranti Billing Platform Belgian-headquartered, European niche player


Recent News & Developments


  • SAP SE (June 2024): Announced a strategic partnership with Amazon Web Services to deliver SAP IS-U workloads on AWS GovCloud, addressing US federal and municipal data-sovereignty requirements for the customer information system market [23].


  • India Ministry of Power (August 2024): Issued revised RDSS guidelines mandating CIS integration with all smart meters deployed under the scheme, impacting procurement for 250 million connections [8].


  • European Commission (April 2024): Published implementing guidelines for the EU Electricity Market Design Reform, requiring all member-state utilities to support dynamic tariff billing in CIS platforms by Q1 2027 [19].


Customer Information System Market Report Scope

Parameter Details
Market Scope Global customer information system market by deployment, component, end-user, and geography
Study Period 2021–2035
CAGR 12.0% (2026–2035)
Base Year Size USD 1.84 Billion (2025)
Forecast Endpoint USD 5.71 Billion (2035)
Fastest Growing Segment Cloud deployment (19.4% CAGR); Retail end-user (17.2% CAGR)
Companies Profiled Oracle, SAP, Hansen Technologies, Itineris, Open International, Gentrack, Cayenta, Fluentgrid, NorthStar, Ferranti
Valuation Currency USD Billion


FAQs

How long does a typical CIS platform replacement take for a mid-size utility?

Most mid-size utility implementations span 18 to 30 months from contract signing through go-live, including data migration and parallel-run testing [16]. Phased rollouts that convert customer segments incrementally tend to reduce risk compared to big-bang cutovers.

What pricing models do CIS cloud vendors typically offer?

Leading vendors offer per-account-per-month subscription pricing, typically ranging from USD 0.40 to USD 1.20 depending on module scope [4]. Enterprise licenses with volume tiers remain available for utilities exceeding five million accounts.

How does the customer information system market address multi-commodity billing for converged utilities?

Modern platforms use configurable product catalogs that abstract service types, allowing a single engine to bill electricity, gas, water, and broadband on one invoice [11]. This eliminates the need for parallel billing systems.

What role does blockchain play in the customer information system market today?

Blockchain adoption remains limited to pilot programs for peer-to-peer energy trading settlement and renewable-energy certificate tracking [13]. Production-scale CIS deployments have not yet integrated blockchain into core billing workflows.

Which compliance standards must CIS vendors meet for the North American utility sector?

Vendors must support NERC CIP cybersecurity standards, SOC 2 Type II audit requirements, and state-specific PUC billing-accuracy thresholds [1]. FedRAMP authorization is increasingly required for federal or municipal contracts.

How are CIS vendors differentiating on customer-experience features in the customer information system market?

Differentiation centers on mobile-first self-service portals, proactive outage and usage alerts, and AI-powered chatbots that resolve billing disputes without agent intervention [9]. Vendors with embedded analytics score highest in utility RFP evaluations.

What is the typical return on investment for a cloud CIS migration in the customer information system market?

Utilities report 25–35% total-cost-of-ownership savings over a seven-year horizon, driven by reduced infrastructure spend and faster upgrade cycles [6]. Payback periods average three to four years.    
Author
Author
Author Profile
Nirmit Biswas LinkedIn
Senior Research Analyst
With 5+ years of expertise in Market Intelligence and Strategic Research, Nirmit Biswas specializes in ICT, Semiconductors, and BFSI. Backed by an MBA in Financial Services and a Computer Science foundation, Nirmit blends technical depth with business acumen. He has successfully led 100+ projects for global enterprises and startups, including Amazon, Cisco, L&T and Huawei, delivering market estimations, competitive benchmarking, and GTM strategies. His focus lies in transforming complex data into clear, actionable insights that drive growth, innovation, and investment decisions. Recognized for bridging engineering innovation with executive strategy, Nirmit helps businesses navigate dynamic markets with confidence.
Co-Author
Co-Author Profile
Aarti Dhapte LinkedIn
AVP - Research
A consulting professional focused on helping businesses navigate complex markets through structured research and strategic insights. I partner with clients to solve high-impact business problems across market entry strategy, competitive intelligence, and opportunity assessment. Over the course of my experience, I have led and contributed to 100+ market research and consulting engagements, delivering insights across multiple industries and geographies, and supporting strategic decisions linked to $500M+ market opportunities. My core expertise lies in building robust market sizing, forecasting, and commercial models (top-down and bottom-up), alongside deep-dive competitive and industry analysis. I have played a key role in shaping go-to-market strategies, investment cases, and growth roadmaps, enabling clients to make confident, data-backed decisions in dynamic markets.

Research Approach

Secondary Research

The secondary research process involved comprehensive analysis of regulatory databases, industry standards, government technology reports, and authoritative IT research publications. Key sources included the US Department of Commerce National Telecommunications and Information Administration (NTIA), National Institute of Standards and Technology (NIST) Cybersecurity Framework, Federal Communications Commission (FCC) reports on telecommunications infrastructure, European Commission Digital Economy and Society Index (DESI), European Union Agency for Cybersecurity (ENISA), UK National Cyber Security Centre (NCSC), Australian Cyber Security Centre (ACSC), Singapore Infocomm Media Development Authority (IMDA), Japan Ministry of Internal Affairs and Communications (MIC), India Ministry of Electronics and Information Technology (MeitY), US Bureau of Labor Statistics (BLS) technology employment data, US Census Bureau ICT sector statistics, World Bank Digital Development indicators, International Telecommunication Union (ITU) World Telecommunication/ICT Indicators Database, Organisation for Economic Co-operation and Development (OECD) Digital Economy Outlook, and national statistical offices from key markets. These sources were used to collect digital infrastructure adoption statistics, regulatory compliance requirements, cloud computing penetration data, enterprise IT spending trends, and market landscape analysis for on-premises, cloud-based, and hybrid deployment models across software and services components.

Primary Research

Qualitative and quantitative insights were obtained by interviewing supply-side and demand-side stakeholders during the primary research process. CEOs, CTOs, VPs of Product Development, cloud infrastructure leaders, and commercial directors from CIS software vendors, system integrators, and cloud service providers comprised the supply-side sources. Retail chains, telecommunications operators, banking institutions, healthcare providers, educational institutions, and enterprise end-users across SMEs and large enterprises comprised demand-side sources, which included Chief Information Officers (CIOs), IT directors, customer experience heads, digital transformation leads, and procurement managers. Market segmentation was verified, product roadmap timelines were confirmed, and insights regarding cloud migration patterns, pricing strategies, and compliance implementation dynamics were obtained through primary research.

Primary Respondent Breakdown:

By Designation: C-level Primaries (32%), Director Level (31%), Others (37%)

By Region: North America (32%), Europe (30%), Asia-Pacific (28%), Rest of World (10%)

Market Size Estimation

Global market valuation was derived through revenue mapping and enterprise adoption analysis. The methodology included:

Identification of 50+ key technology vendors and service providers across North America, Europe, Asia-Pacific, and Latin America

Product mapping across on-premises, cloud-based, and hybrid deployment models, covering both software platforms and professional services

Analysis of reported and modeled annual revenues specific to customer information management portfolios

Coverage of vendors representing 72-78% of global market share in 2024

Extrapolation using bottom-up (enterprise license count × ASP by deployment type and region) and top-down (vendor revenue validation) approaches to derive segment-specific valuations for customer data management, analytics & reporting, lead management, and customer engagement functionalities

Download Free Sample

Kindly complete the form below to receive a free sample of this Report

Download PDF ×

We do not share your information with anyone. However, we may send you emails based on your report interest from time to time. You may contact us at any time to opt-out.