Data Center Market Summary
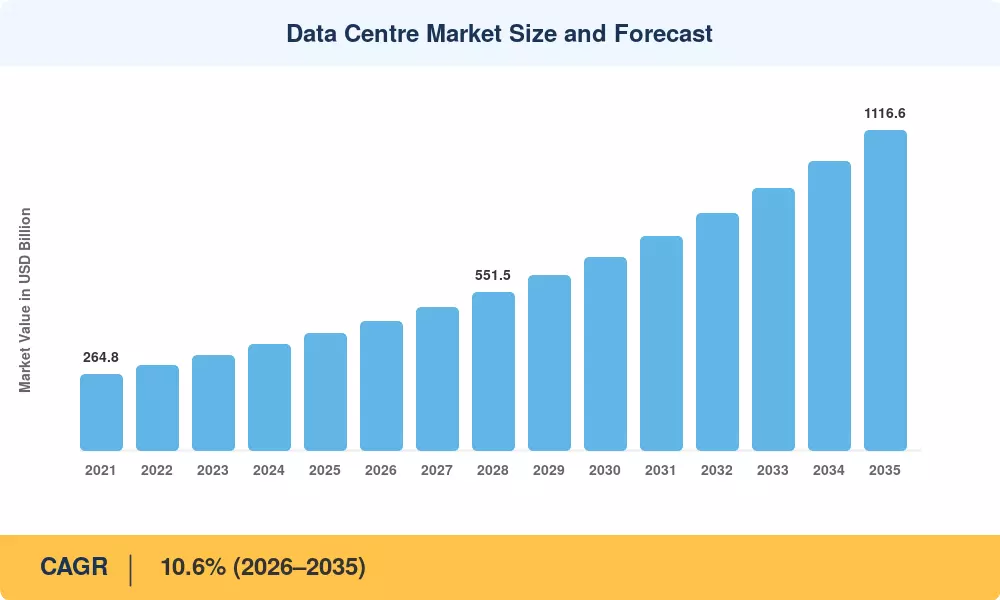
The Data Center Market reached USD 407.6 billion in 2025 and opens the forecast window at USD 450.8 billion in 2026, climbing to USD 1,116.6 billion by 2035 at a 10.6% CAGR. Two catalysts anchor that trajectory. The first is the accelerator buildout: hyperscalers committed more than USD 320 billion in combined 2025 capital expenditure guidance, the majority of it steered toward compute halls and the power infrastructure feeding them. The second is grid policy — FERC Order 1920 and comparable European connection reforms have made interconnection queue position, not land, the binding constraint on new capacity [2].
Underneath the headline spend, a genuine architectural replacement cycle is running. Air-cooled raised-floor halls designed for 6–10 kW racks cannot host 100 kW-plus GPU cabinets, so operators are retiring perimeter CRAC units in favour of rear-door heat exchangers and direct-to-chip liquid loops. The U.S. Department of Energy estimates data center electricity demand could reach 6.7–12.0% of national consumption by 2028, up from roughly 4.4% in 2023 [3]. That single statistic explains why energy-efficient data center infrastructure now sits on the capital committee agenda rather than the facilities budget.
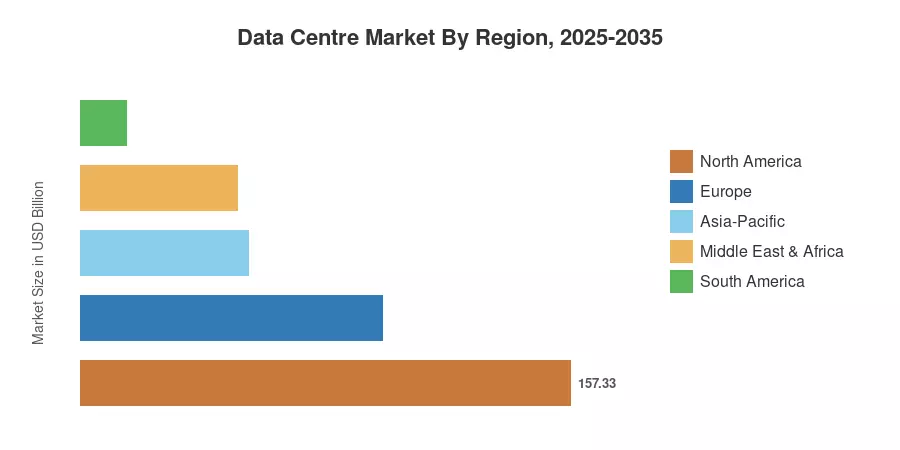
Regionally, North America holds 38.6% of global value on the strength of Northern Virginia, Dallas and Phoenix absorption. Asia-Pacific compounds fastest at 13.2%, propelled by Johor, Mumbai and Osaka. Europe follows as the second-largest bloc, where the Energy Efficiency Directive's mandatory reporting regime is reshaping site selection more than price. Expect scarcity of powered shells — not demand — to set pricing through 2030.
Key Report Takeaways
The Data Center Market breaks down across four disclosure dimensions, summarised below.
• By Data Center Type and By Tier Type
- Hyperscale/Self-built facilities command 44.8% of global value, the largest single deployment archetype in the Data Center Market
- Enterprise/Edge capacity is expanding at a 12.9% CAGR as latency-sensitive inference workloads move closer to users
- Tier 3 installations account for USD 210.3 billion of 2025 value, reflecting the enterprise preference for concurrent maintainability over full fault tolerance.
• By End User
- IT and ITES buyers contribute 24.3% of demand, the anchor vertical across every major metro.
- BFSI capacity generates USD 71.7 billion, driven by data residency mandates and real-time settlement systems
- E-Commerce is scaling at an 11.8% CAGR on the back of recommendation-engine retraining cycles.
• By Region
- North America leads the Data Center Market with a 38.6% share
- Asia-Pacific posts the fastest regional CAGR at 13.2%
- Middle East & Africa reaches USD 18.8 billion, concentrated in Riyadh, Dubai and Johannesburg
Market Size and Forecast (2021–2035)
Figures below are triangulated from operator capacity disclosures, utility interconnection filings, regional power authority load forecasts and colocation lease registries, then reconciled against IT load capacity (MW) commissioned per metro. Historical years reflect commissioned capacity; forecast years apply announced-pipeline probability weighting.





















.webp?v=1787579612)
