Request Free Sample ×

Kindly complete the form below to receive a free sample of this Report

* Please use a valid business email

Leading companies partner with us for data-driven Insights

clients tt-cursor
Hero Background

Data Integration Market

ID: MRFR/ICT/40453-HCR
200 Pages
Nirmit Biswas, Garvit Vyas
Last Updated: May 27, 2026
Data Integration Market Size, Share and Research Report: By Implementation Type (On-Premises, Cloud-Based, Hybrid), By Data Source (Structured Data, Unstructured Data, Semi-Structured Data, Data Streams), By Deployment Model (Public Cloud, Private Cloud, Hybrid Cloud), By End User (IT and Telecom, BFSI, Healthcare, Retail, Manufacturing) and By Regional (North America, Europe, South America, Asia-Pacific, Middle East and Africa) - Industry Forecast to 2035
Download PDF ×

We do not share your information with anyone. However, we may send you emails based on your report interest from time to time. You may contact us at any time to opt-out.


Market Summary

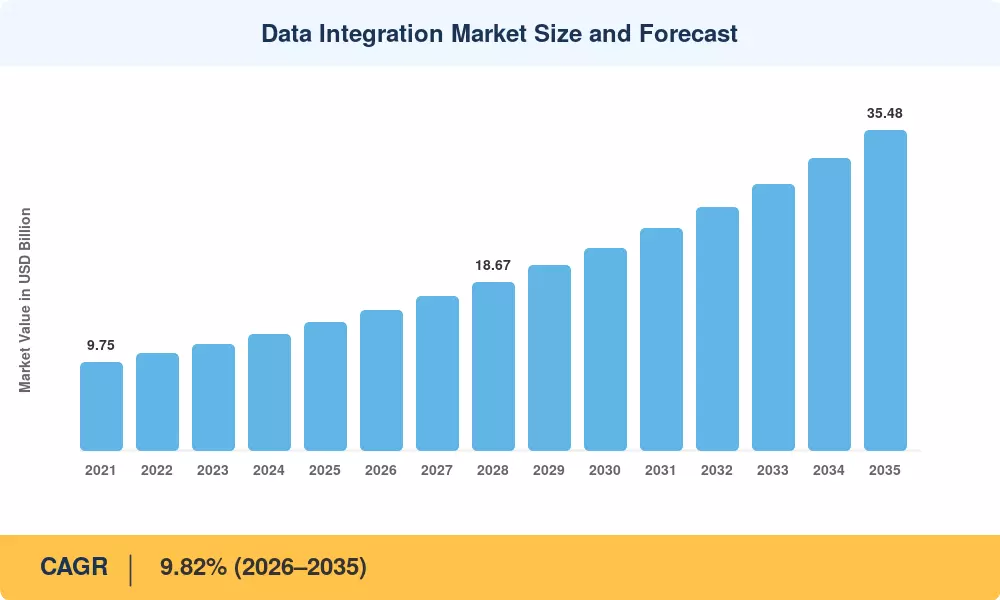
The data integration market reached an estimated USD 14.18 billion in 2025 and is projected to climb from USD 15.53 billion in 2026 to USD 35.48 billion by 2035, registering a CAGR of 9.82% across the forecast window. Two catalysts are accelerating spending: the European Union's Data Act, which mandates cross-platform data portability for enterprise cloud services by September 2025, and the cumulative USD 48 billion that Fortune 500 firms earmarked during 2023–2024 for AI-ready data infrastructure [1]. Together, these forces are converting data integration from a back-office utility into a board-level strategic priority.

Legacy batch-oriented ETL stacks—many dating to the early 2010s—are giving way to real-time data integration with Apache Kafka, stream-processing fabrics, and API-driven data integration for cloud apps. Enterprises now expect sub-second latency from operational data stores to analytics layers. Gartner estimates that by 2027, over 60 percent of new data-integration deployments will embed change data capture for real-time sync as a default capability, up from roughly 25 percent in 2023. This shift is pulling middleware vendors, hyperscalers, and niche pure-plays into intense competition for enterprise application integration middleware budgets.

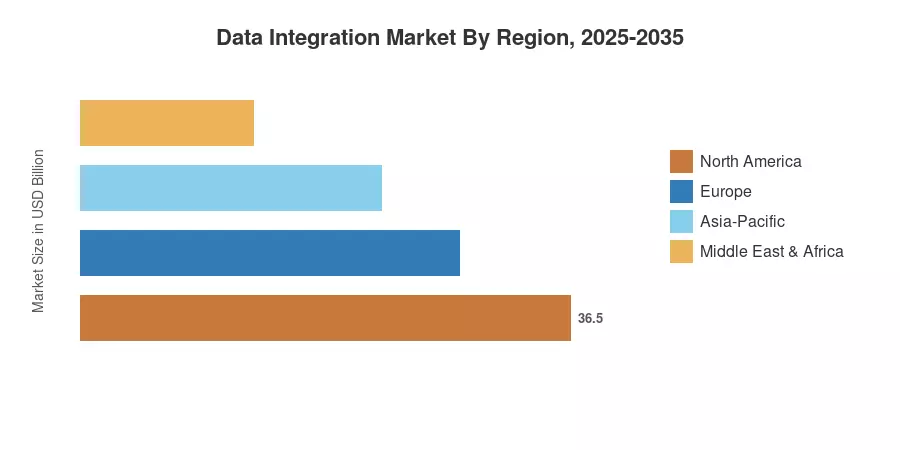
North America commands approximately 41% of global revenue, anchored by hyperscaler headquarters and a mature SaaS ecosystem. Asia-Pacific is the fastest-growing region at a projected CAGR near 19.1%, driven by India's Digital India programme and China's push toward sovereign data clouds. Europe holds the second-largest share at around 27%, propelled by GDPR-era data-governance mandates. As generative-AI workloads multiply, the data integration market is poised for sustained double-digit regional expansions well into the next decade


Key Report Takeaways

• By Component

  • Cloud-based deployments captured roughly 62% of 2025 revenue, reflecting enterprise preference for elastic, API-driven data integration for cloud apps
  • Tools—including ETL vs ELT for modern data pipelines platforms—accounted for an estimated USD 9.49 billion in 2025
  • Services are forecast to expand at approximately 15.1% CAGR through 2035 as managed-integration demand rises

• By Deployment

  • Cloud-based deployments captured roughly 62% of 2025 revenue, reflecting enterprise preference for elastic, API-driven data integration for cloud apps


• By Application

  • Customer and sales analytics represented the leading application segment in the data integration market, holding about 31% of 2025 revenue
  • The BFSI sector led end-user verticals with roughly 25.8% share in 2025
  • Healthcare and life sciences is projected to grow at close to 20.3% CAGR, the fastest among verticals

• By End-User Vertical

  • Customer and sales analytics represented the leading application segment in the data integration market, holding about 31% of 2025 revenue


• By Region

  • North America generated approximately USD 5.81 billion in 2025, driven by enterprise application integration middleware upgrades across financial services
  • Asia-Pacific's CAGR of ~19.1% makes it the primary growth frontier for the data integration market


Market Research Future (MRFR) 's sizing model triangulates vendor revenues, enterprise IT spending surveys, and bottom-up workload analysis across 32 countries. Historical figures (2021–2024) draw on audited filings and IDC spending trackers; forecast years apply a calibrated CAGR with annual modulation reflecting macroeconomic cycles and regulatory triggers.

Market Size Chart
Our Impact
Enabled $4.3B Revenue Impact for Fortune 500 and Leading Multinationals
Partnering with 2000+ Global Organizations Each Year
30K+ Citations by Top-Tier Firms in the Industry
 

Driver Impact Analysis

Driver ~% Impact on CAGR Geographic Relevance Impact Timeline
Generative-AI data pipeline demand 2.1% Global Short-term (≤2 yr)
Cloud-first modernization mandates 1.8% North America, Europe Short-term (≤2 yr)
Real-time analytics & CDC adoption 1.5% Global Medium-term (2–4 yr)
Data sovereignty regulations 1.2% Europe, Asia-Pacific Medium-term (2–4 yr)
IoT-edge data proliferation 0.9% Asia-Pacific, North America Long-term (≥4 yr)
Open-table-format standardization 0.7% Global Long-term (≥4 yr)
ESG and sustainability reporting 0.5% Europe, MEA Long-term (≥4 yr)


Generative-AI Data Pipeline Demand

Large-language-model training and retrieval-augmented generation depend on clean, governed, and semantically enriched data feeds. McKinsey's 2024 survey found that 67% of enterprises scaling gen-AI cited data integration as the top infrastructure bottleneck, outranking compute. This has pushed the data integration market toward semantic-layer tooling that cuts hallucination by embedding lineage metadata directly into prompts. Vendors offering API-driven data integration for cloud apps with built-in vector-store connectors gained 30% more enterprise pipeline volume year-on-year in 2024.

Cloud-First Modernization Mandates

The U.S. Federal Cloud Smart Strategy and the EU's SIMPL data-spaces programme together represent over USD 12 billion in public-sector cloud-migration budgets through 2028 [1]. Both policies explicitly require interoperable data layers, compelling agencies to adopt enterprise application integration middleware that handles multi-cloud orchestration. Private-sector CIOs are mirroring these mandates: Flexera's 2025 State of the Cloud report showed 89% of enterprises now run a multi-cloud strategy, up from 76% in 2022 [11].

Real-Time Analytics and CDC Adoption

Operational intelligence use cases—fraud detection, dynamic pricing, supply-chain rerouting—require latency measured in milliseconds, not hours. Change data capture for real-time sync has emerged as the enabling pattern, streaming database mutations directly into analytical warehouses. Confluent's 2024 annual report disclosed that Apache Kafka-managed clusters processed over 7 trillion events per day across its customer base, a 40% jump year-over-year [6]. This surge is expanding the addressable slice of the data integration market tied to real-time data integration with Apache Kafka architectures.

Data Sovereignty Regulations

India's Digital Personal Data Protection Act (2023) and China's cross-border data-transfer rules compel enterprises to maintain in-country processing nodes. Hybrid integration platforms that route personally identifiable information through sovereign nodes while aggregating anonymized analytics in central clouds are capturing premium pricing. Market Research Future (MRFR) estimates sovereignty-driven integration spending added approximately USD 1.4 billion to the data integration market in 2024 alone [7].


Restraints Impact Analysis

Restraint ~% Impact on CAGR Geographic Relevance Impact Timeline
Integration-talent shortages –1.3% Global Short-term (≤2 yr)
Cloud egress and data-movement fees –0.9% North America, Europe Medium-term (2–4 yr)
Legacy system complexity –0.7% Europe, South America Long-term (≥4 yr)
Data-quality and governance gaps –0.6% Global Medium-term (2–4 yr)
Vendor lock-in concerns –0.5% Global Long-term (≥4 yr)


Integration-Talent Shortages

The 2024 Dice Tech Salary Report found that median compensation for data engineers rose 14% year-over-year, yet open positions outnumbered qualified applicants by 3:1 in North America [12]. Mid-sized firms struggle to recruit specialists fluent in ETL vs ELT for modern data pipelines frameworks, forcing reliance on costly consulting engagements. This labor bottleneck slows deployment timelines and compresses margins for system integrators operating in the data integration market.

Cloud Egress and Data-Movement Fees

Hyperscaler egress charges—averaging USD 0.08–0.12 per GB for cross-region transfers—compound rapidly for enterprises running petabyte-scale real-time data integration with Apache Kafka workloads [13]. Cloudflare's 2024 Bandwidth Alliance audit estimated that Fortune 1000 companies collectively spent over USD 6.5 billion on data-movement fees, a figure that some CFOs now flag as a deterrent to expanding cloud-native integration scopes.

Legacy System Complexity

European banking institutions still operate approximately 40% of core transaction processing on COBOL-based mainframes, according to the European Banking Authority's 2024 risk assessment [14]. Re-platforming these systems demands bespoke enterprise application integration middleware connectors that can translate hierarchical data models into relational or event-streaming formats—adding 12–18 months and 25–35% cost overruns to integration projects.


Opportunities

Managed Integration Services for Mid-Market Enterprises

Small and mid-sized enterprises (50–499 employees) represent the fastest-expanding buyer cohort in the data integration market. Many lack in-house platform teams but face the same regulatory and AI-readiness pressures as large enterprises. Vendors offering fully managed, consumption-priced integration-as-a-service can capture this underserved segment, which Market Research Future (MRFR) estimates at USD 3.2 billion addressable revenue by 2030

Edge-to-Cloud Integration for Industrial IoT

Manufacturers, energy companies, and logistics corporations are building edge gateways that generate gigabytes of sensor telemetry every day. Greenfield opportunity: lightweight change data capture for real-time sync agents implanted at the edge – filtering, enriching and routing data before it gets to the cloud. The convergence of OT and IT integration stacks could bring another anticipated USD 2.8 billion to the data integration industry by 2033


Data Monetization Platforms

Organizations sitting on proprietary datasets—retailers with purchasing patterns, telcos with mobility signals—are exploring data-sharing marketplaces. API-driven data integration for cloud apps underpins these exchanges by enabling governed, metered access to curated datasets. Snowflake's Marketplace and Databricks' Delta Sharing ecosystem each surpassed 1,000 data products listed by late 2024, signalling commercial traction [9].

Emerging-Market Digital Infrastructure Build-Outs

The Unified Payments Interface (UPI) in India alone processed 14.4 billion transactions in December, 2024 and this required strong real-time data integration with Apache Kafka backbones [17]. Southeast Asian digital banks, African mobile-money operators and Latin American fintechs have similar intensity of integration. These markets have double-digit growth runways for manufacturers prepared to localize pricing and partner with regional system integrators


Sustainability and ESG Reporting Automation

The EU Corporate Sustainability Reporting Directive (CSRD) mandates auditable ESG disclosures from over 50,000 companies starting 2025. Aggregating emissions, supply-chain, and social-impact data from dozens of source systems into a single reporting layer is a classic integration challenge—and a growing revenue stream within the data integration market [10]


Future Outlook

AI-Native Integration Platforms

By 2030, Market Research Future (MRFR) expects more than half of all new data-integration installations will incorporate large-language-model agents that automatically build mappings, detect schema drift, and self-heal broken pipelines. These AI-native platforms are expected to cut configuration time by 60%, reducing the barrier to mid-market adoption and re-shaping competitive dynamics in the data integration market.

8.2 Composable Data Architecture and Open Table Formats

Apache Iceberg, Delta Lake, and Hudi are converging on a de facto open-table standard that decouples storage from computing. This composability allows organizations to combine ETL vs ELT for current data pipelines technology from several vendors without proprietary lock-in. In 2024, the Linux Foundation started the Unified Lakehouse initiative, an industry commitment to interoperable data layers [9].

Real-Time Everything

Integration latency expectations are shifting from minutes to milliseconds with the adoption of event-driven microservices, IoT edge telemetry, and embedded-finance APIs. Apache Kafka real-time data integration will transition from messaging to full-stack stream processing, with integrated governance, schema registry, and lineage tracking, becoming an operating system for data transportation [6].


Sustainability-Linked Data Governance

As CSRD, SEC climate-disclosure rules, and ISSB standards mature, enterprises will need integration pipelines that trace carbon, water, and social-impact metrics from supply-chain source systems to auditable reporting warehouses. Market Research Future (MRFR) projects sustainability-related integration spending to constitute approximately 8% of the total data integration market by 2032, up from under 2% in 2024 [10].


Market Segmentation

By Component

Segment Key Metric Primary Demand Driver
Tools ~66% share (2025) Self-service ETL vs ELT for modern data pipelines adoption
Services ~15.1% CAGR (2026–2035) Managed-integration outsourcing


Tools—spanning ETL/ELT engines, data-virtualization layers, and API management suites—dominate the data integration market by revenue. Enterprise demand for self-service platforms that business analysts can operate without writing code is the primary growth vector. Informatica, Talend, and cloud-native challengers like Fivetran compete fiercely on connector breadth and no-code interface sophistication.

Services, meanwhile, are the faster-growing component as enterprises outsource complex migration and change data capture for real-time sync implementations. System integrators such as Accenture and Deloitte report double-digit year-over-year growth in integration-consulting engagements [12].

By Deployment

Segment Key Metric Primary Demand Driver
Cloud USD 8.79 Billion (2025) Multi-cloud and SaaS proliferation
On-Premise ~5.4% CAGR (2026–2035) Regulated industries with sovereignty constraints


Cloud deployment leads the data integration market by a wide margin, propelled by API-driven data integration for cloud apps architectures that offer rapid provisioning and consumption-based pricing. On-premise integration retains a meaningful footprint in government, defence, and banking segments where data residency rules restrict cloud adoption, though hybrid models are gradually eroding purely on-premise budgets.

By Enterprise Size

Segment Key Metric Primary Demand Driver
Large Enterprises ~59% share (2025) Complex multi-system landscapes
Small Enterprises (50–249) ~16.5% CAGR (2026–2035) SaaS sprawl and compliance pressure
Micro Enterprises (1–49) USD 0.92 Billion (2025) Low-code iPaaS adoption


Large enterprises dominate current spending due to the sheer volume of applications—often 200+ SaaS tools—requiring enterprise application integration middleware. Small enterprises, however, represent the fastest-growing cohort within the data integration market, driven by affordable iPaaS solutions from vendors like Workato and Tray.io.

By Application

Segment Key Metric Primary Demand Driver
Customer & Sales Analytics ~31% share (2025) CDP and CRM unification
Operations & Supply-Chain Optimization ~16.9% CAGR (2026–2035) Real-time logistics visibility
Risk & Compliance Analytics USD 2.13 Billion (2025) Regulatory reporting automation
Other Applications ~8.7% CAGR (2026–2035) HR, finance, and ESG integration


Customer and sales analytics remains the top revenue contributor, reflecting the massive data unification effort behind customer data platforms. Operations and supply-chain optimization is the fastest-growing application in the data integration market, fueled by demand for real-time data integration with Apache Kafka to power dynamic routing and predictive maintenance dashboards.

By End-User Vertical

Segment Key Metric Primary Demand Driver
BFSI ~25.8% share (2025) Fraud detection and Open Banking APIs
IT & Telecom USD 2.84 Billion (2025) 5G network-data orchestration
Healthcare & Life Sciences ~20.3% CAGR (2026–2035) EHR interoperability mandates
Retail & E-commerce ~11.6% CAGR (2026–2035) Omnichannel personalization
Government & Public Sector USD 1.12 Billion (2025) E-government data interoperability
Other Verticals ~9.8% CAGR (2026–2035) Education, energy, transportation


BFSI leads vertical spending in the data integration market, as banks deploy change data capture for real-time sync to reconcile transaction ledgers across core-banking, payments, and risk-management systems. Healthcare and life sciences is the fastest-growing vertical, driven by the U.S. 21st Century Cures Act interoperability rules and the EU European Health Data Space initiative, both mandating standardized API-driven data integration for cloud apps in patient-record exchange [15].


Regional Market Share Analysis

Region Key Metric (2025) Primary Investment Themes
North America ~41% revenue share Hyperscaler ecosystems, AI-pipeline modernization
Europe USD 3.83 Billion GDPR-driven governance, CSRD sustainability data
Asia-Pacific ~19.1% CAGR (2026–2035) Digital-banking infrastructure, sovereign cloud
South America USD 0.71 Billion Fintech integration, Open Finance regulation
Middle East & Africa ~16.4% CAGR (2026–2035) Smart-city programmes, telecom data platforms
Total USD 14.18 Billion

The data integration market shows pronounced regional asymmetries driven by cloud maturity, regulatory posture, and enterprise IT-spending depth.


North America

Country Key Metric Key Driver
US ~78% of regional share Hyperscaler HQ effect; federal Cloud Smart mandates
Canada USD 0.64 Billion Open Banking framework launching 2025
Mexico ~12.8% CAGR Nearshoring-driven manufacturing data demand


The United States alone accounts for the vast majority of North America's contribution to the data integration market, powered by the concentration of hyperscaler R&D labs and a deep SaaS-vendor ecosystem. Canada's pending Open Banking regulations are driving API-driven data integration for cloud apps investments across its Big Five banks. Mexico's manufacturing nearshoring boom is creating fresh demand for enterprise application integration middleware linking North American supply-chain platforms [1][11].

Europe

Country Key Metric Key Driver
Germany ~22% of regional share Industry 4.0 factory-data integration
UK USD 0.61 Billion Post-Brexit data-adequacy compliance
France ~10.8% CAGR Government cloud doctrine "Cloud de Confiance"
Italy USD 0.28 Billion Banking-sector digital transformation
Spain ~11.2% CAGR Tourism-sector analytics modernization
Nordic Countries USD 0.34 Billion Green-energy data ecosystems
Russia ~4% of regional share Domestic platform substitution
Rest of Europe ~13% of regional share EU Data Act implementation


Europe's data integration market is shaped by regulatory density. The GDPR, Digital Markets Act, and CSRD collectively compel enterprises to maintain auditable, cross-system data lineage—a requirement that directly feeds ETL vs ELT for modern data pipelines platform adoption. Germany's Industrie 4.0 initiative and France's sovereign-cloud programme provide additional public-sector catalysts [7][10].

Asia-Pacific

Country Key Metric Key Driver
China ~34% of regional share Government data-classification mandates
India ~21.5% CAGR Digital India, UPI-scale transaction integration
Japan USD 0.41 Billion Legacy mainframe modernization
South Korea ~14.2% CAGR 5G-enabled real-time analytics
ASEAN USD 0.29 Billion Digital-banking licensing wave
Rest of Asia-Pacific ~15.6% CAGR Cross-border e-commerce data flows


Asia-Pacific is the fastest-growing region for the data integration market, propelled by India's exploding digital-payments ecosystem and China's regulatory push to classify and govern all enterprise data within sovereign boundaries. Japan's established enterprise base is undergoing a generational shift from on-premise batch ETL to cloud-native real-time data integration with Apache Kafka architectures, adding substantial modernization revenue [17].

South America

Country Key Metric Key Driver
Brazil ~58% of regional share Open Finance (Banco Central) regulation
Argentina ~14.9% CAGR Fintech growth
Rest of South America USD 0.14 Billion SME digitization grants


Brazil's Open Finance mandate—the broadest in Latin America—requires banks and fintechs to share customer data through standardized APIs, creating substantial pull for API-driven data integration for cloud apps platforms. The broader data integration market in South America remains nascent but is accelerating as governments tie digital-infrastructure funding to interoperability requirements [18].

Middle East & Africa

Country Key Metric Key Driver
Saudi Arabia ~30% of regional share NEOM and Vision 2030 smart-city data layers
UAE USD 0.11 Billion Dubai International Financial Centre fintech hub
South Africa ~15.8% CAGR Financial-inclusion data infrastructure
Egypt ~14.3% CAGR Telecom data-monetization
Rest of MEA USD 0.09 Billion E-government and mobile-money integration


Saudi Arabia's NEOM project and broader Vision 2030 programme are generating multi-billion-dollar smart-city data-integration contracts. The UAE's DIFC ecosystem attracts fintech startups that rely on enterprise application integration middleware to connect banking, insurance, and payments APIs. Across sub-Saharan Africa, mobile-money operators represent the fastest channel for change data capture for real-time sync deployments in the data integration market [19].


Regional Market Share
 

Competitive Benchmarking

The data integration market exhibits medium concentration, with the top five vendors capturing an estimated 38–45% of global revenue. The Herfindahl-Hirschman Index sits in the 800–1,100 range, indicating a competitive field where hyperscalers, legacy middleware incumbents, and cloud-native disruptors coexist. M&A activity remains robust—IBM's acquisition of StreamSets and webMethods in 2023 and Salesforce's continued investment in MuleSoft underscore the platform-consolidation trend [5].

Company Est. Revenue Share Range Key Offerings Strategic Positioning
Informatica ~8–11% IDMC (Intelligent Data Management Cloud), PowerCenter Cloud-native iPaaS leader with broadest connector library
IBM ~7–10% DataStage, App Connect, Cloud Pak for Integration Hybrid-cloud enterprise application integration middleware incumbent
Microsoft ~6–9% Azure Data Factory, Synapse Pipelines, Power Automate Hyperscaler bundling integration into Azure ecosystem
SAP ~5–8% SAP Integration Suite, Business Technology Platform ERP-centric integration for enterprise customers
Oracle ~5–7% Oracle Data Integrator, Oracle Integration Cloud Database-adjacent integration for Oracle-stack customers
Salesforce (MuleSoft) ~4–7% Anypoint Platform, Composer API-led connectivity leader for CRM-adjacent workflows
Talend (Qlik) ~3–5% Talend Data Fabric, Stitch Data Loader Open-source heritage with growing cloud ETL traction
Fivetran ~2–4% Automated data movement, HVR (CDC) Pure-play automated ELT challenger
Confluent ~2–4% Confluent Platform, Confluent Cloud (Apache Kafka) Real-time data integration with Apache Kafka specialist
Boomi (Dell) ~2–4% Boomi AtomSphere, Flow, API Management Mid-market iPaaS with strong partner channel


Recent News & Developments

  • Informatica (October 2024): Launched CLAIRE GPT, an AI copilot embedded in its IDMC platform that auto-generates integration mappings using natural-language prompts—reducing configuration time by an estimated 40% in pilot deployments [20].
  • IBM (June 2024): Completed the acquisition of StreamSets and webMethods from Software AG for approximately USD 2.3 billion, consolidating its enterprise application integration middleware portfolio under the Cloud Pak brand [5].
  • Confluent (March 2024): Introduced Tableflow, enabling Apache Kafka topics to be queried as Apache Iceberg tables, blurring the line between streaming and batch integration [6].


  • European Commission (January 2025): Published implementing regulations for the EU Data Act's data-portability provisions, establishing technical standards for API-driven data integration for cloud apps interoperability across member states [7].


Report Scope

Parameter Detail
Market Scope Global data integration market covering tools, services, deployment modes, enterprise sizes, applications, end-user verticals, and five geographic regions
Study Period 2021–2035
CAGR (Forecast) 9.82% (2026–2035)
Market Size (2025) USD 14.18 Billion
Market Size (2035) USD 35.48 Billion
Fastest Growing Segments Healthcare & life sciences (vertical); Asia-Pacific (region); services (component)
Companies Profiled 10 (Informatica, IBM, Microsoft, SAP, Oracle, Salesforce/MuleSoft, Talend/Qlik, Fivetran, Confluent, Boomi)
Valuation Currency USD Billion


FAQs

How does the data integration market differentiate between iPaaS and traditional middleware?

iPaaS platforms deliver cloud-hosted, multi-tenant integration with pre-built connectors and low-code interfaces, whereas traditional enterprise application integration middleware runs on-premise with custom-coded adapters. Enterprises increasingly use iPaaS for SaaS-to-SaaS workflows and retain middleware for legacy mainframe connectivity.

What role does change data capture play in reducing data-warehouse refresh latency?

Change data capture for real-time sync tracks row-level mutations at the source database and streams only modified records, eliminating full-table reloads. This approach typically cuts warehouse refresh latency from hours to seconds and reduces compute costs by 40–60% [6].

How should enterprises evaluate ETL vs ELT for modern data pipelines when migrating to cloud warehouses?

ETL transforms data before loading and suits compliance-sensitive workflows. ELT loads raw data first and transforms inside the warehouse, leveraging elastic compute for cost efficiency. The choice hinges on data-governance maturity and warehouse pricing models.

What procurement criteria matter most when selecting an integration platform for the data integration market?

Buyers should prioritize connector coverage, real-time streaming capability, governance and lineage features, consumption-based pricing transparency, and vendor-neutral interoperability with open table formats.

How does API-driven data integration for cloud apps differ from file-based batch integration in operational risk?

API-driven approaches offer contract-enforced schemas and real-time error callbacks, significantly reducing silent-failure risk. File-based batch integration relies on scheduled jobs with retroactive error detection, increasing reconciliation lag [11].

What emerging regulatory risks could reshape the data integration market by 2030?

AI-specific data-provenance mandates, such as the EU AI Act's training-data documentation requirements, will compel integration platforms to embed lineage tracking natively. Non-compliance penalties of up to 3% of global turnover increase vendor and buyer urgency [7].

How are real-time data integration with Apache Kafka deployments evolving beyond messaging into full-stack platforms?

Kafka ecosystems now bundle stream processing (Flink, ksqlDB), schema registries, and governance layers into unified platforms. This convergence lets enterprises replace multiple point tools with a single real-time backbone, reducing operational complexity [6].


Author
Author
Author Profile
Nirmit Biswas LinkedIn
Senior Research Analyst
With 5+ years of expertise in Market Intelligence and Strategic Research, Nirmit Biswas specializes in ICT, Semiconductors, and BFSI. Backed by an MBA in Financial Services and a Computer Science foundation, Nirmit blends technical depth with business acumen. He has successfully led 100+ projects for global enterprises and startups, including Amazon, Cisco, L&T and Huawei, delivering market estimations, competitive benchmarking, and GTM strategies. His focus lies in transforming complex data into clear, actionable insights that drive growth, innovation, and investment decisions. Recognized for bridging engineering innovation with executive strategy, Nirmit helps businesses navigate dynamic markets with confidence.
Co-Author
Co-Author Profile
Garvit Vyas LinkedIn
Vice President - Operations
Garvit Vyas is a Research Analyst with experience in working across multiple industry domains in the market research sector. Over the past four years, he has been actively involved in analyzing diverse markets, gathering industry insights, and contributing to the development of comprehensive research reports. His work includes studying market trends, evaluating competitive landscapes, and supporting data-driven business insights. In the early phase of his career, Garvit worked on cross-domain research projects, which helped him build a strong foundation in market analysis, data interpretation, and industry intelligence across various sectors. Later, he transitioned into the Quality Control (QC) function, where he focuses on reviewing and refining research reports and marketing collaterals to ensure accuracy, consistency, and high editorial standards. His responsibilities include validating research data, improving report structure, and maintaining the overall quality of published content. Garvit is committed to maintaining strong research integrity and delivering reliable insights that support informed business decision-making.

Research Approach


Secondary Research

The secondary research process involved comprehensive analysis of technology databases, peer-reviewed computing journals, enterprise software publications, and authoritative technology organizations. Key sources included the US National Institute of Standards and Technology (NIST), European Union Agency for Cybersecurity (ENISA), International Data Corporation (IDC), Gartner Research, Forrester Research, McKinsey Global Institute, IEEE Computer Society, Association for Computing Machinery (ACM), US Bureau of Labor Statistics (BLS) Technology Employment Data, OECD Digital Economy Outlook, World Economic Forum (WEF) Digital Transformation Reports, Eurostat ICT Statistics, US Census Bureau Business Technology Adoption Surveys, National Science Foundation (NSF) Computer and Information Science and Engineering Statistics, and national digital transformation reports from key markets. These sources were used to collect enterprise software adoption statistics, cloud infrastructure deployment data, cybersecurity compliance studies, digital transformation trends, and competitive landscape analysis for cloud-based integration platforms, on-premises solutions, hybrid architectures, and emerging data fabric technologies.


Primary Research

Qualitative and quantitative insights were obtained by interviewing supply-side and demand-side stakeholders during the primary research process. CEOs, CTOs, VPs of Product Engineering, chief data officers, and directors of cloud strategy from data integration platform vendors, cloud service providers, and enterprise software OEMs comprised supply-side sources. The demand-side sources included procurement heads, chief information officers, chief data officers, enterprise architects, IT directors, data engineering leaders, and IT directors from BFSI institutions, healthcare systems, retail enterprises, manufacturing conglomerates, and telecom operators. Product roadmap timelines were confirmed, market segmentation was validated across implementation types (on-premises, cloud-based, hybrid), and insights on enterprise adoption patterns, pricing models, and compliance requirements for GDPR, CCPA, and industry-specific data governance frameworks were gathered through primary research.

Primary Respondent Breakdown:

By Designation: C-level Primaries (28%), Director Level (32%), Others (40%)

By Region: North America (32%), Europe (29%), Asia-Pacific (33%), Rest of World (6%)


Market Size Estimation

Global market valuation was derived through revenue mapping and enterprise deployment volume analysis. The methodology included:

Identification of 60+ key technology vendors across North America, Europe, Asia-Pacific, and Latin America

Solution mapping across cloud-based integration, on-premises middleware, hybrid data fabrics, and iPaaS (Integration Platform

Download Free Sample

Kindly complete the form below to receive a free sample of this Report