Dental 3D Printing Market Summary
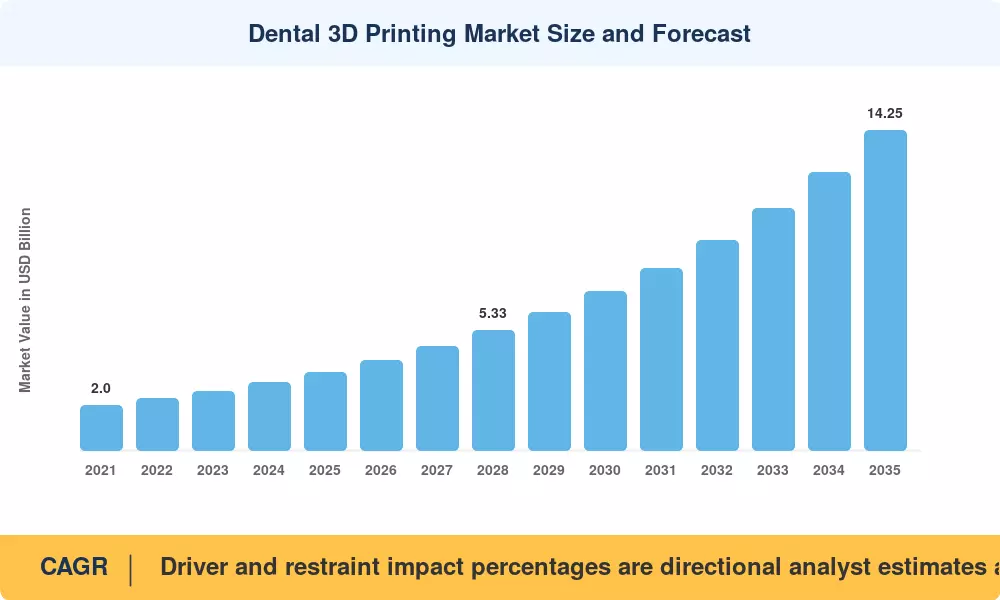
The Dental 3D Printing Market was valued at USD 3.49 billion in 2025 and opens the forecast window at USD 4.02 billion in 2026, climbing to USD 14.25 billion by 2035 at a 15.1% CAGR. Two catalysts anchor that trajectory. The U.S. FDA cleared more than 40 dental-specific photopolymer resins and printer systems through the 510(k) pathway between 2021 and 2025 [1], while the European Commission's EUR 5.3 billion EU4Health envelope funnelled digital-health capital into clinical infrastructure across member states [2].
Legacy milling centres and hand-poured stone models are giving way to digital dental fabrication lines that run intraoral scan data straight into a build tray. Straumann Group alone committed roughly USD 320 million to digital workflow expansion across 2023–2025 [3], and roughly 62% of North American commercial laboratories now operate at least one production-grade printer [4].
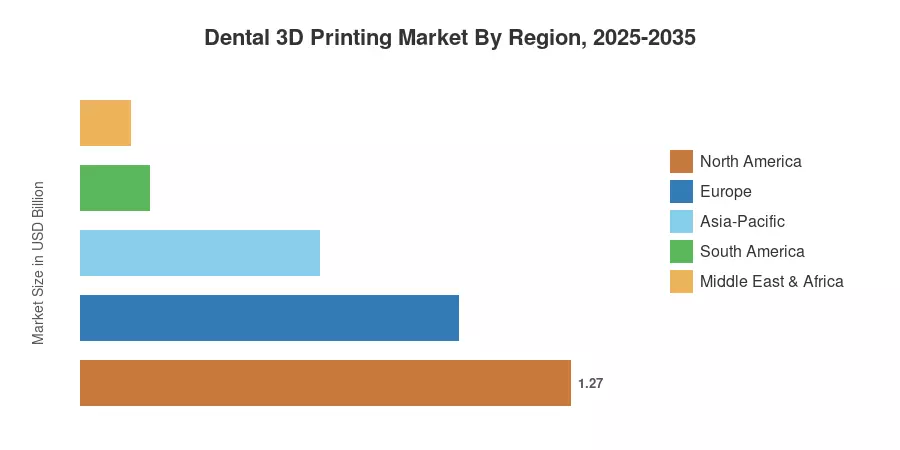
Regionally, North America holds 36.5% of the Dental 3D Printing Market, supported by dense private-pay orthodontic demand. Asia-Pacific compounds fastest at 17.8%, led by Chinese and Indian aligner volumes, while Europe remains the second-largest bloc at USD 0.98 billion in 2025 under MDR-driven quality upgrades. The next decade belongs to whoever industrialises post-processing.
Key Report Takeaways
• By Printing Technology
- Stereolithography commands 34.8% of the Dental 3D Printing Market on resolution consistency for crown-and-bridge patterns
- Digital Light Processing posts the fastest technology CAGR at 17.4%, driven by build-speed gains in aligner model farms
- Selective Laser Sintering contributed USD 0.41 billion in 2025 across metal framework production
• By Application
- Orthodontics represents the largest application at a 31.2% share
- Prosthodontics is forecast to reach USD 3.86 billion by 2035
- Surgical guides expand at 16.9% CAGR as implantology standardises on guided placement
• By Region
- North America leads the Dental 3D Printing Market with 36.5% share
- Asia-Pacific grows at 17.8% CAGR through 2035
- Middle East & Africa contributed USD 0.13 billion in 2025
Market Size and Forecast (2021–2035)
Estimates blend audited vendor disclosures, customs-level printer and resin import data, laboratory census surveys across 14 countries, and reimbursement filings. Historical values are reconciled bottom-up against installed-base counts; forecast years apply a demand model weighted to align with aligner case starts, implant placements, and clinic digitisation rates.