Dental Anesthesia Market (2026 - 2035)

Dental Anesthesia Market Research Report Information by Product Type (Lidocaine, Mepivacaine, Prilocaine, Bupivacaine 0.5% with epinephrine1:200,000, Articaine and Others), by Mode of Administration (Maxillary, Mandibular and Others) by Technique (Local Infiltration, Field Block and Nerve Block), by Duration of Action (Short, Medium and Long), by End User (Hospital Clinics, Clinics and Other), by Distribution Channel (Pharmacies And Drug Stores, E-Commerce and Other) and Region (Americas, Europe, Asia-Pacific, and Middle East & Africa)—Forecast till 2035

Forecast Period
2026-2035
CAGR
5.42%
2025 Market Size
USD 1.85 Billion
2035 Market Size
USD 3.14 Billion
Pharmaceutical ● Updated August 25, 2026 Report ID: MRFR/Pharma/0271-CR | Pages: 110 | Author: Rahul Gotadki, Nidhi Mandole

Dental Anesthesia Market Summary

The Dental Anesthesia Market was valued at USD 1.85 Billion in 2025 and is projected to open the forecast window at USD 1.95 Billion in 2026 before reaching USD 3.14 Billion by 2035, expanding at a 5.42% CAGR. Two catalysts anchor that trajectory. The World Health Organization's Global Oral Health Status Report placed untreated oral disease at roughly 3.5 billion cases worldwide, pushing ministries of health toward funded restorative programs [1]. India's Ayushman Bharat network, meanwhile, has widened subsidised procedural dentistry across more than 1,700 empanelled facilities [2].

Clinical practice is shifting underneath those volumes. Aspirating glass cartridges and hand-pressure syringes still dominate chairside routines, but computer-controlled delivery units, buffered chairside mixing, and needle-free jet systems are displacing them in higher-throughput settings. Milestone Scientific and Dentsply Sirona have together committed upward of USD 40 million to device platforms and articaine-line capacity since 2023 [3][4]. Europe's F-Gas and inhalational-emissions agenda adds a second push, steering practices away from nitrous oxide toward lower-impact regimens [5].

Geographically, North America holds 39.2% of the Dental Anesthesia Market, supported by dense dental service organisation networks. Asia-Pacific grows fastest at a 6.76% CAGR, while Europe remains second largest at 27.6% share on the strength of publicly funded dental schemes. Through 2035, the Dental Anesthesia Market rewards suppliers who pair pharmacological reliability with measurable chair-time savings.


Key Report Takeaways

• By Anesthesia Type

  • Local anesthesia commanded 69.6% of the Dental Anesthesia Market in 2025, reflecting its default status in restorative and periodontal workflows
  • General anesthesia is the fastest-expanding type at a 7.80% CAGR through 2035, driven by special-needs and pediatric caseloads

• By Delivery Mode

  • Injectable formats accounted for 61.2% of 2025 revenue across the Dental Anesthesia Market
  • Computer-controlled local anesthetic delivery systems posted the strongest 8.32% CAGR to 2035
  • Topical formats generated USD 0.31 Billion in 2025

• By End User

  • Dental clinics represented 57.4% of 2025 revenue
  • Ambulatory surgical centres lead growth at an 8.87% CAGR

• By Region

  • North America held 39.2% share in 2025
  • Asia-Pacific advances at a 6.76% CAGR through 2035
  • South America contributed USD 0.11 Billion in 2025


Market Size and Forecast (2021–2035)

Estimates combine dental procedure volumes from national health statistics agencies, cartridge and vial shipment data disclosed by manufacturers, customs-level trade flows for articaine and lidocaine actives, and practitioner surveys across 24 countries. Historical values were reconciled against audited segment revenue where publicly reported; forecast values apply procedure-growth elasticities weighted by reimbursement coverage.
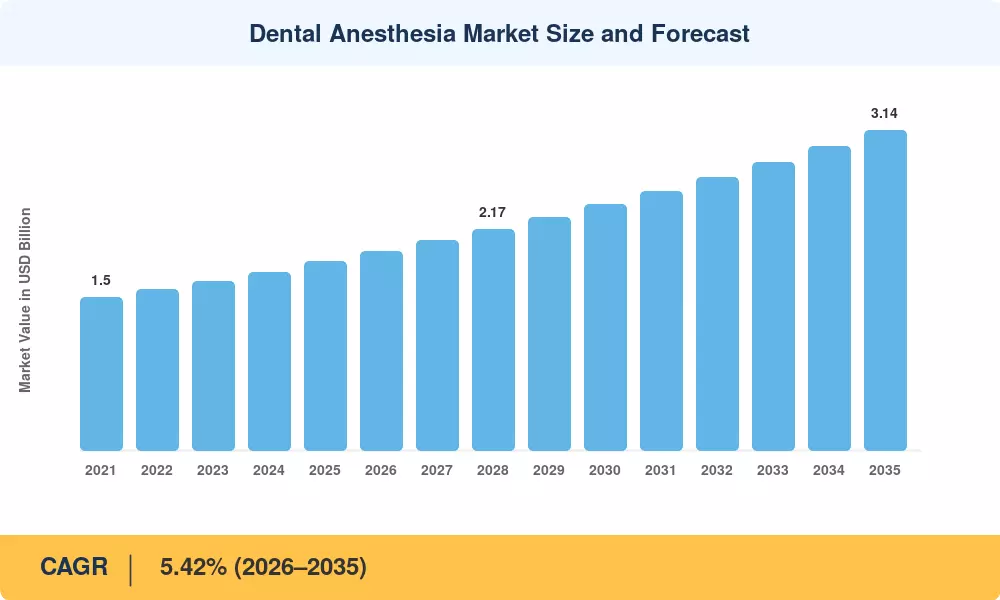
Dental Anesthesia Market Size and Forecast
Our Impact
Enabled $4.3B Revenue Impact for Fortune 500 and Leading Multinationals
Partnering with 2000+ Global Organizations Each Year
30K+ Citations by Top-Tier Firms in the Industry

Driver Impact Analysis

Driver ~% Impact on CAGR Geographic Relevance Impact Timeline
Rising global burden of caries and periodontal disease 1.10 Global Long-term (≥4 yr)
Expansion of implant and cosmetic dentistry 0.90 North America, Europe, APAC Medium-term (2–4 yr)
Adoption of computer-controlled and buffered delivery 0.80 North America, Europe Medium-term (2–4 yr)
Dental service organisation consolidation 0.60 North America Short-term (≤2 yr)
Public dental coverage expansion in emerging economies 0.70 APAC, South America Long-term (≥4 yr)
Ageing populations and geriatric dentistry 0.50 Europe, Japan Long-term (≥4 yr)
Pediatric behavioural management protocols 0.40 Global Short-term (≤2 yr)


Oral Disease Burden and Public Programme Funding

With an estimated 2 billion people affected, untreated caries in permanent teeth continues to be the most common disease monitored by WHO [1]. Instead of sending out messages, governments have replied with cash. Over the course of its 2023–2025 cycle, Brazil's Brasil Sorridente contribution exceeded BRL 3 billion, supporting restorative treatment in towns that had previously exclusively provided extraction services [13]. Program funding is strongly correlated with the size of the dental anesthesia market since each of those converted procedures uses anesthetic when none was previously utilized.


Implant and Aesthetic Procedure Growth

By 2024, the number of implant placements in the US exceeded 3.5 million per year, with a three-year increase in guided surgery cases of almost 18% [8]. Longer appointments favor longer-acting medications like bupivacaine and higher-concentration articaine, and guided protocols lengthen appointments. In this market, suppliers who focus on duration rather than onset speed have a disproportionate amount of market share.


Delivery Technology Modernisation

Computer-controlled units regulate flow rate below the pain threshold, and published trials report patient-discomfort score reductions near 40% against manual syringes [3]. Practices adopting them report fewer supplementary injections per case, which trims both waste and rebooking. Milestone Scientific's installed base grew past 5,000 handpieces by late 2024, a modest absolute number that nonetheless signals durable clinical acceptance.

Consolidated Buying Through Dental Groups

Dental service organisations now manage roughly 33% of US practices, up from about 22% in 2019 [10]. Centralised formularies favour a narrow set of validated suppliers and multi-year contracts. Consolidation compresses per-cartridge pricing while raising volume certainty, a trade most manufacturers have accepted.


Restraints Impact Analysis

Restraint weightings represent directional drag on growth momentum. They are analytical estimates, not subtractive components of the published CAGR.

Restraint ~% Impact on CAGR Geographic Relevance Impact Timeline
Environmental restrictions on nitrous oxide -0.60 Europe Medium-term (2–4 yr)
Pediatric dosing and adverse-event scrutiny -0.40 North America Short-term (≤2 yr)
Reimbursement gaps and out-of-pocket burden -0.55 Global Long-term (≥4 yr)
Active ingredient supply concentration -0.30 Global Short-term (≤2 yr)
Shortage of sedation-credentialed practitioners -0.35 APAC, MEA Medium-term (2–4 yr)


Environmental Pressure on Inhalational Agents

According to guidelines, trusts should decommission piped manifolds when portable options are adequate because nitrous gas has a 100-year global warming potential of 273 [5]. A few of Nordic health regions have gone so far as to restrict inhalational sedation to specific pediatric purposes. As a result, even when the larger Dental Anesthesia Market grows, there is a structural ceiling on one revenue stream.


Affordability and Coverage Limits

Dental care has the highest out-of-pocket percentage of any health service among member states, averaging close to 55%, according to OECD data [14]. First, patients postpone elective restorative procedures, which completely eliminates the need instead of changing it. In middle-class markets where private-pay dentistry surpasses insured volume, this restriction is most severe.


Ingredient and Cartridge Supply Concentration

Articaine hydrochloride production concentrates among fewer than eight qualified sites worldwide, and glass cartridge conversion is similarly narrow [7]. A single 2023 European plant stoppage lengthened lead times by roughly 11 weeks. Buyers have since begun dual-sourcing, but qualification cycles run six to nine months.


Dental Anesthesia Market Opportunities

Buffered Chairside Formulations

Sodium bicarbonate buffering raises anesthetic pH toward the physiological range, shortening onset to under two minutes in mandibular blocks. Practices billing by the hour convert that saving directly into throughput, which makes buffering one of the clearest value propositions in the Dental Anesthesia Market.

Needle-Free and Micro-Jet Delivery

Dental anxiety affects an estimated 36% of adults, with roughly 12% reporting severe fear [16]. Jet-injection and vibration-assisted platforms address the specific trigger rather than the procedure, opening a patient cohort that currently avoids care altogether.

Emerging-Market Clinic Networks

Southeast Asian and Gulf chain dentistry is scaling quickly, with Saudi Arabia's Vision 2030 health privatisation targeting private delivery of a substantial share of outpatient care [17]. Suppliers that register dossiers early and localise cartridge labelling capture shelf position before tender pricing hardens.

Data-Enabled Service Models

Connected delivery handpieces log dose, flow rate, and re-injection frequency. Vendors are beginning to bundle that telemetry into subscription analytics for group practices, shifting revenue from consumable margin toward recurring software — a business model with no precedent in this category five years ago.

Longer-Acting Agents for Single-Visit Dentistry

Chairside CAD/CAM milling has made two-hour single-visit restorations routine. Formulations validated for extended pulpal anesthesia beyond 90 minutes command premium pricing and face limited competition.


Dental Anesthesia Market Future Outlook

Precision Dosing and Clinical Decision Support

Connected handpieces already capture flow-rate telemetry, and the next decade will see that data feed dose-recommendation engines calibrated to patient weight, anxiety score, and procedure class. Regulators are preparing: FDA's device software guidance now covers adaptive dosing logic explicitly [21]. Expect the Dental Anesthesia Market to bifurcate between commodity cartridges and instrumented delivery systems carrying software margins.

Subscription and Consumable-Bundling Economics

Group practices increasingly prefer per-chair monthly contracts over purchase orders. Bundles combining handpieces, cartridges, and analytics shift supplier revenue toward predictable recurring streams and raise switching costs considerably. Vendors without a device anchor will find bundling difficult to replicate.

Decarbonising Sedation

Healthcare accounts for roughly 4.4% of global net emissions, and anesthetic gases are a visible line item within that total [22]. Destruction technologies and nitrous oxide capture systems are entering dental settings after hospital pilots. Practices that document reductions gain advantage in public tenders across Europe.

Manufacturing Regionalisation

Supply shocks between 2022 and 2024 pushed buyers toward geographic redundancy. India and Brazil are both adding qualified cartridge lines, and the Dental Anesthesia Market should see import dependence fall meaningfully in those economies by 2030. Regional capacity trades some scale efficiency for resilience — a trade most procurement leaders now accept.


Dental Anesthesia Market Segmentation

By Anesthesia Type

Segment Metric Primary Demand Driver
Local Anesthesia 69.6% share (2025) Default for restorative and periodontal care
General Anesthesia 7.80% CAGR (2026–2035) Special-needs and complex pediatric cases


Local formulations dominate the Dental Anesthesia Market because nearly every restorative appointment requires them and almost none requires more. Articaine has steadily displaced lidocaine in infiltration technique across Europe and increasingly in North America, though a well-established lidocaine dental anesthetic remains the reference standard for block administration. General anesthesia is small but compounding fastest, propelled by hospital-affiliated programmes serving patients who cannot tolerate conscious treatment.

By Delivery Mode

Segment Metric Primary Demand Driver
Injectable 61.2% share (2025) Universal requirement for pulpal anesthesia
Topical USD 0.31 Billion (2025) Pre-injection comfort and hygiene procedures
Inhalation & Conscious-Sedation Agents 4.10% CAGR (2026–2035) Anxiety management, constrained by emissions policy
Computer-Controlled Local Anesthetic Delivery Systems 8.32% CAGR (2026–2035) Discomfort reduction and dose precision


Injectable products remain the revenue core, but growth has migrated to the delivery apparatus rather than the drug. Topical dental numbing agents function as an on-ramp, sustaining steady volume through hygiene appointments and pediatric pre-treatment even where injection volumes plateau.

By End User

Segment Metric Primary Demand Driver
Dental Clinics 57.4% share (2025) Highest procedure throughput per site
Hospitals USD 0.42 Billion (2025) Maxillofacial surgery and medically complex patients
Ambulatory Surgical Centres 8.87% CAGR (2026–2035) Case migration from inpatient settings
Others 5.00% CAGR (2026–2035) Academic and military dental services


Clinics anchor the Dental Anesthesia Market through sheer volume, and consolidated groups within that channel now dictate formulary composition. Ambulatory surgical centres grow fastest as payers push third-molar extraction and implant surgery out of hospital theatres, where the same case costs substantially more to deliver.


Regional Market Share Analysis

Region Metric (2025) Primary Investment Themes
North America 39.2% share DSO formulary contracts, buffered systems, ASC sedation capacity
Europe 27.6% share Green anesthesia compliance, public scheme tenders
Asia-Pacific 6.76% CAGR (2026–2035) Clinic-chain rollout, domestic cartridge manufacturing
South America USD 0.11 Billion Public restorative programmes, generic articaine supply
Middle East & Africa 6.10% CAGR (2026–2035) Medical tourism dentistry, private hospital build-out
Total USD 1.85 Billion

Regional performance across the Dental Anesthesia Market tracks reimbursement architecture more closely than population size.


North America

Country Metric Key Driver
US 84.5% of region Implant and cosmetic procedure density
Canada USD 0.09 Billion Canadian Dental Care Plan enrolment
Mexico 6.20% CAGR Cross-border dental tourism corridors


Canada's federal dental plan began phased enrolment covering roughly nine million uninsured residents, a demand shock the North American Dental Anesthesia Market had not previously modelled [18]. US growth is steadier and contract-driven, with group practices renegotiating three-year cartridge agreements. Mexican border-city clinics serve US patients at 60–70% discounts, sustaining unusually high per-chair anesthetic consumption.

Europe

Country Metric Key Driver
Germany 22.1% of region Statutory insurance restorative coverage
UK USD 0.08 Billion NHS contract reform and access recovery
France 17.4% of region 100% Santé zero-copay dental basket
Italy 11.8% of region Private clinic consolidation
Spain 9.6% of region Implant tourism inflows
Nordic Countries 5.85% CAGR Green anesthesia procurement rules
Russia USD 0.03 Billion Domestic generic substitution
Rest of Europe 4.90% CAGR CEE private dentistry expansion


France's 100% Santé reform eliminated patient copayment on a defined prosthetic basket, lifting treated volumes materially in its first full years [19]. Germany's statutory funds continue to reimburse conservative dentistry broadly, keeping cartridge consumption stable. Nordic procurement now scores carbon intensity alongside price, an evaluation criterion that barely existed in 2020.

Asia-Pacific

Country Metric Key Driver
China 34.8% of region Volume-based procurement and clinic chains
India 8.40% CAGR Ayushman Bharat dental empanelment
Japan USD 0.09 Billion Geriatric restorative caseload
South Korea 12.3% of region Implant penetration among over-65s
ASEAN 7.10% CAGR Medical tourism and private chains
Rest of Asia-Pacific 5.60% CAGR Urban clinic formalisation


South Korea reimburses implants for patients above 65 at a 30% copayment, producing the world's highest per-capita implant rate and a correspondingly deep anesthetic pull [20]. China's provincial volume-based procurement has cut unit prices sharply while multiplying tendered quantities. India's expansion is the fastest in the Dental Anesthesia Market, though average selling prices remain a fraction of Western levels.

South America

Country Metric Key Driver
Brazil 58.9% of region Brasil Sorridente restorative funding
Argentina USD 0.02 Billion Union-plan dental coverage
Rest of South America 5.90% CAGR Private clinic network growth


Brazil operates one of the largest publicly funded dental systems anywhere, and its Centros de Especialidades Odontológicas network shifted regional practice from extraction toward restoration [13]. Local manufacturing by DFL and Nova DFL keeps import dependence low. Currency volatility remains the principal planning risk for multinational suppliers.

Middle East & Africa

Country Metric Key Driver
Saudi Arabia 31.4% of region Vision 2030 outpatient privatisation
UAE USD 0.02 Billion Dental tourism and expatriate insurance
South Africa 14.7% of region Private medical scheme dentistry
Egypt 7.20% CAGR Universal health insurance rollout
Rest of MEA 5.40% CAGR Urban private clinic formation


Gulf regulators have tightened dossier requirements, with the Saudi FDA requiring locally referenced stability data for imported anesthetic cartridges [17]. That raises entry cost but rewards early registrants with durable tender positions. Egypt's phased universal insurance rollout adds governorate-level demand that was previously informal and largely unmeasured.


Dental Anesthesia Market By Region, 2025-2035

Competitive Benchmarking

Concentration in the Dental Anesthesia Market sits in the medium band, with an estimated HHI between 780 and 900 and a top-five combined share near 46–52%. One specialist manufacturer leads decisively while diversified dental distributors and pharmaceutical generics contest the remainder. Fragmentation increases sharply below the top tier, where regional generic producers compete almost entirely on cartridge pricing.

Company Est. Revenue Share Range Key Offerings for Dental Anesthesia Market Strategic Positioning
Septodont ~17–21% Articaine and lidocaine cartridges, needles, buffering systems Category specialist with deepest formulary breadth
Dentsply Sirona ~8–11% Anesthetic cartridges, delivery consumables, CAD/CAM integration Bundles anesthesia into broader equipment ecosystem
Solventum (3M Health Care) ~6–9% Anesthetic and restorative consumables Leverages restorative franchise for cross-sell
Pierrel S.p.A. ~5–7% Articaine and mepivacaine cartridges, contract manufacturing European manufacturing base, strong private-label role
Fresenius Kabi ~4–6% Injectable anesthetics, sedation agents Hospital and ambulatory channel strength
Henry Schein ~4–6% Private-label anesthetics, full-line distribution Controls shelf access across independent practices
Ultradent Products ~3–5% Topical formulations, delivery accessories Innovation-led niche with clinician loyalty
Pfizer (Hospira) ~2–4% Generic injectable anesthetic portfolio Scale generics supplier to institutional buyers
Laboratorios Normon ~1–3% Dental cartridges for Iberian and LatAm markets Regional cost leadership
Primex Pharmaceuticals ~1–2% Articaine formulations for Nordic and CEE markets Compliance-forward European specialist
Milestone Scientific ~1–2% Computer-controlled delivery handpieces Pure-play device innovator in precision delivery
Benco Dental ~1–2% Distributed anesthetic consumables Independent-practice distribution focus


Recent News & Developments

  • Septodont (March 2024): Commissioned expanded cartridge filling capacity in France, adding roughly 200 million annual units and easing the lead-time pressure that followed the 2023 European supply disruption [7].
  • NHS England (June 2024): Published Greener Dentistry guidance directing practices to review piped nitrous oxide infrastructure, accelerating substitution toward intravenous and oral sedation pathways [5].
  • Milestone Scientific (October 2024): Reported cumulative installed handpiece base above 5,000 units and launched a connected dosing module for group-practice reporting [3].
  • Health Canada (May 2024): Began phased enrolment of the Canadian Dental Care Plan, extending coverage toward nine million previously uninsured residents and lifting restorative procedure forecasts [18].
  • Pierrel S.p.A. (February 2025): Signed a multi-year private-label supply agreement covering North American distribution, deepening its contract manufacturing footprint [4].
  • Saudi FDA (September 2024): Tightened registration requirements for imported dental anesthetic cartridges, mandating locally referenced stability documentation [17].
  • Dentsply Sirona (July 2023): Consolidated its anesthetic packaging operations into two sites, targeting cost reduction while shortening North American replenishment cycles [4].


Dental Anesthesia Market Report Scope

Parameter Detail
Market Scope Global Dental Anesthesia Market by anesthesia type, delivery mode, end user, and geography
Study Period 2021–2035 (Historical 2021–2024; Base Year 2025; Forecast 2026–2035)
CAGR 5.42% (2026–2035)
Market Size Checkpoints USD 1.85 Billion (2025); USD 1.95 Billion (2026); USD 3.14 Billion (2035)
Fastest Growing Segments Ambulatory surgical centres (end user); computer-controlled local anesthetic delivery systems (delivery mode); general anesthesia (type)
Companies Profiled Septodont, Dentsply Sirona, Solventum, Pierrel S.p.A., Fresenius Kabi, Henry Schein, Ultradent Products, Pfizer (Hospira), Laboratorios Normon, Primex Pharmaceuticals, Milestone Scientific, Benco Dental
Valuation Currency USD Billion

FAQs

What should procurement teams verify before consolidating cartridge suppliers in the Dental Anesthesia Market?
Confirm dual qualified fill sites, batch stability data at local climate conditions, and contractual lead-time penalties. Single-site suppliers carry disproportionate disruption risk regardless of unit price [7].
How do buffered systems compare with conventional cartridges on total cost per case?
Buffering adds roughly USD 2–4 per case in consumables but typically removes one supplementary injection and several minutes of chair time. High-throughput practices recover the premium; low-volume practices generally do not [3].
Which regulatory hurdle most delays entry into the Dental Anesthesia Market in Gulf states?
Locally referenced stability documentation. Saudi requirements demand climate-zone-specific data that many suppliers must generate from scratch, adding nine to fifteen months before tender eligibility [17].
Are computer-controlled delivery devices reimbursable as a separate line item?
Rarely. Most payer schedules bundle anesthesia into the procedure fee, so practices absorb device cost and recover it through throughput or premium positioning rather than billing [14].
What integration challenges follow adoption of connected delivery handpieces?
Practice management systems seldom accept dosing telemetry natively, forcing manual reconciliation or middleware. Staff retraining on foot-pedal flow control typically requires twenty to thirty supervised cases [21].
How does anesthetic allergy testing affect clinical purchasing in the Dental Anesthesia Market?
True amide allergy is rare, but preservative and sulfite reactions drive demand for preservative-free formulations. Clinics serving allergy-referral patients stock parallel product lines at higher inventory cost [12].
What early signal indicates pricing pressure ahead in this category?
Watch provincial and national volume-based procurement tenders. When China or Brazil awards multi-year contracts at steep discounts, those benchmarks migrate into private negotiations within four to six quarters [20].      
Author
Author
Author Profile
Rahul Gotadki LinkedIn
Research Manager
He holds an experience of about 9+ years in Market Research and Business Consulting, working under the spectrum of Life Sciences and Healthcare domains. Rahul conceptualizes and implements a scalable business strategy and provides strategic leadership to the clients. His expertise lies in market estimation, competitive intelligence, pipeline analysis, customer assessment, etc.
Co-Author
Co-Author Profile
Nidhi Mandole LinkedIn
Senior Research Analyst
She is an extremely curious individual currently working in Healthcare and Medical Devices Domain. Nidhi is comfortably versed in data centric research backed by healthcare educational background. She leverages extensive data mining and analytics tools such as Primary and Secondary Research, Statistical Analysis, Machine Learning, Data Modelling. Her key role also involves Technical Sales Support, Client Interaction and Project management within the Healthcare team. Lastly, she showcases extensive affinity towards learning new skills and remain fascinated in implementing them.
Share::
Request Free Sample

Research Approach


Secondary Research

The secondary research process involved comprehensive analysis of pharmaceutical regulatory databases, peer-reviewed dental and anesthesiology journals, clinical pharmacology publications, and authoritative oral health organizations. Key sources included the US Food & Drug Administration (FDA) Center for Drug Evaluation and Research (CDER) and Center for Devices and Radiological Health (CDRH), European Medicines Agency (EMA), Health Canada Therapeutic Products Directorate, Australia's Therapeutic Goods Administration (TGA), Japan Pharmaceuticals and Medical Devices Agency (PMDA), and China's National Medical Products Administration (NMPA). Professional dental associations provided critical procedure and safety data, including the American Dental Association (ADA), FDI World Dental Federation, American Association of Oral and Maxillofacial Surgeons (AAOMS), American Association of Endodontists (AAE), Academy of General Dentistry (AGD), and American Dental Society of Anesthesiology (ADSA). Government health statistics were sourced from the CDC Division of Oral Health, NIH National Institute of Dental and Craniofacial Research (NIDCR), WHO Oral Health Programme, NHS Digital Dental Statistics (UK), EU Eurostat Health Database, and national health ministry reports from key markets. Academic databases including PubMed/MEDLINE, Cochrane Library, and Web of Science were queried for clinical efficacy studies, adverse event meta-analyses, and pharmacokinetic research on local anesthetic agents. These sources were used to collect dental procedure volumes, regulatory approval timelines, safety and toxicity studies, demographic oral health trends, and competitive landscape analysis for amide-type local anesthetics (lidocaine, articaine, mepivacaine, bupivacaine, prilocaine), ester-type anesthetics, and associated delivery devices.


Primary Research

To gather both qualitative and quantitative insights, supply-side and demand-side stakeholders were interviewed during the primary research phase. CEOs, VPs of pharmaceutical development, heads of regulatory affairs, and commercial directors from dental anesthetic producers, pharmaceutical firms, and dental supply OEMs were examples of supply-side sources. Medical directors of dental service organizations (DSOs), board-certified dentists, oral and maxillofacial surgeons, dental anesthesiologists, procurement leaders from hospital dental departments, and inventory managers from independent dental clinics and group practices were examples of demand-side suppliers. Primary research confirmed product pipeline timelines for novel formulations (such as buffered anesthetics and needle-free delivery systems), validated market segmentation across anesthetic drug types, and collected information on reimbursement dynamics, formulary decisions, pricing strategies, and clinical adoption patterns for dental anesthesia in preventive, restorative, endodontic, and surgical procedures.

Primary Respondent Breakdown:

• By Designation: C-level Primaries (32%), Director Level (31%), Others (37%)

• By Region: North America (32%), Europe (30%), Asia-Pacific (28%), Rest of World (10%)


Market Size Estimation

Global market valuation was derived through revenue mapping and procedure volume analysis. The methodology included:

• Identification of 40+ key manufacturers across North America, Europe, Asia-Pacific, Latin America, and Middle East & Africa

• Product mapping across lidocaine, articaine, mepivacaine, bupivacaine, prilocaine, and other local anesthetic formulations, plus delivery devices (syringes, needles, computer-controlled local anesthetic delivery systems)

• Analysis of reported and modeled annual revenues specific to dental anesthetic portfolios and dental pharmaceutical divisions

• Coverage of manufacturers representing 75-80% of global market share in 2024

• Extrapolation using bottom-up (dental procedure volume × average selling price by country/region) and top-down (manufacturer revenue validation and pharmaceutical market share analysis) approaches to derive segment-specific valuations for injectable anesthetics, topical anesthetics, and sedation agents

Share::
Request Free Sample
Download Free Sample

Kindly complete the form below to receive a free sample of this Report

* Please use a valid business email

Share::
Request Free Sample
Download PDF ×

We do not share your information with anyone. However, we may send you emails based on your report interest from time to time. You may contact us at any time to opt-out.
















