×
Hero Background
English
Chinese
French
Japanese
Korean
German
Spanish

Diabetes Pen Market Share

ID: MRFR/MED/0146-HCR
105 Pages
Rahul Gotadki
October 2025

Americas Diabetes Pen Market Research Report Information By Type, By Route, By Therapy, And By Region (North America, Europe, Asia-Pacific, And Rest Of The World) – Market Forecast Till 2035

Share:
Download PDF ×

We do not share your information with anyone. However, we may send you emails based on your report interest from time to time. You may contact us at any time to opt-out.

ReportInfographic
Purchase Options

Market Share

Diabetes Pen Market Share Analysis

In the dynamic landscape of the Americas Diabetes Pen Market, companies employ various strategic approaches to effectively position themselves and capture a substantial market share. A pivotal strategy involves continuous innovation in diabetes pen technology. Companies invest significantly in research and development to introduce advanced features such as smart pens with digital connectivity, dose memory, and user-friendly interfaces. By staying at the forefront of diabetes management solutions, these companies differentiate themselves, offering patients and healthcare professionals cutting-edge tools for insulin delivery. This commitment to innovation positions them as leaders in the Americas Diabetes Pen Market, attracting a diverse customer base and securing a larger market share.

Strategic pricing is another critical factor in market share positioning within the Americas Diabetes Pen Market. With the increasing prevalence of diabetes, companies aim to provide cost-effective yet high-quality solutions to appeal to a broad range of consumers. Some may adopt competitive pricing strategies to capture a larger market share by targeting budget-conscious patients, while others may position themselves as premium providers, emphasizing advanced features and user convenience. A well-calibrated pricing strategy allows companies to cater to different market segments, expanding their reach and securing a more significant share in this competitive market.

Moreover, fostering strong relationships with healthcare professionals and institutions is a key component of successful market share positioning in the Americas Diabetes Pen Market. Collaborating with endocrinologists, diabetes educators, and healthcare organizations not only provides valuable insights but also establishes credibility within the medical community. By aligning with key stakeholders, companies can position their diabetes pen solutions as trusted and endorsed options, gaining a competitive advantage and securing a significant share of the market.

Educational initiatives and patient support programs also contribute to market share positioning in the Americas Diabetes Pen Market. Companies that actively engage in providing educational resources, training programs, and support services help patients understand the benefits and proper usage of diabetes pens. This educational approach not only enhances patient adherence to insulin therapy but also positions the company as a compassionate partner in diabetes management. By actively participating in educational initiatives and patient-centric programs, companies can strengthen their brand reputation, attract a larger user base, and ultimately capture a more substantial market share.

Additionally, regulatory compliance is a critical aspect of market share positioning in the Americas Diabetes Pen Market. Adhering to strict regulatory standards ensures that diabetes pen products meet safety and efficacy requirements. Companies that prioritize compliance build trust among healthcare professionals, regulators, and patients, positioning themselves as reliable and responsible contributors to diabetes care. This commitment to regulatory excellence not only safeguards the company's reputation but also contributes to capturing a larger market share in this crucial segment of the healthcare industry.

Effective marketing and branding strategies are fundamental for market share positioning. Companies that invest in building strong brand identities, supported by clear and targeted marketing campaigns, create awareness and recognition within the diabetes community. Strategic marketing efforts, including digital channels, social media, and collaborations with patient advocacy groups, help companies communicate the unique benefits of their diabetes pen solutions. A compelling brand presence enhances market visibility, attracts potential customers, and contributes to securing a more substantial share in the competitive Americas Diabetes Pen Market.

Author
Rahul Gotadki
Assistant Manager

He holds an experience of about 7+ years in Market Research and Business Consulting, working under the spectrum of Life Sciences and Healthcare domains. Rahul conceptualizes and implements a scalable business strategy and provides strategic leadership to the clients. His expertise lies in market estimation, competitive intelligence, pipeline analysis, customer assessment, etc. In addition to the above, his other responsibility includes strategic tracking of high growth markets & advising clients on the potential areas of focus they could direct their business initiatives

Leave a Comment

Market Summary

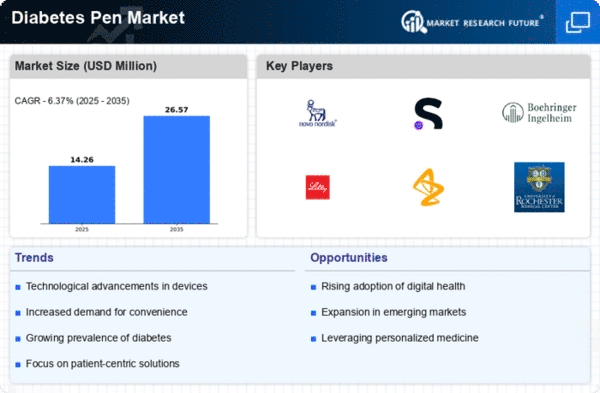
As per Market Research Future Analysis, the Diabetes Pen Market was valued at 3.26 USD Billion in 2022 and is projected to grow from 3.43 USD Billion in 2023 to 5.4 USD Billion by 2032, reflecting a CAGR of 5.18% from 2024 to 2032. The market is driven by the increasing prevalence of diabetes, advancements in technology, and a growing demand for self-monitoring solutions.

Key Market Trends & Highlights

The Diabetes Pen Market is characterized by several key trends and highlights.

  • The market is expected to reach 5.4 USD Billion by 2032, driven by rising diabetes cases globally.
  • Smart Pens are valued at 1.494 USD Billion in 2023, showcasing a growing preference for technology-integrated solutions.
  • Reusable Pens hold a market value of 0.89 USD Billion in 2023, emphasizing cost-effectiveness for long-term users.
  • North America is projected to grow from 1.45 USD Billion in 2023 to 2.25 USD Billion by 2032, indicating strong market presence.

Market Size & Forecast

2022 Market Size USD 3.26 Billion
2023 Market Size USD 3.43 Billion
2032 Market Size USD 5.4 Billion
CAGR (2024-2032) 5.18%
Largest Regional Market Share in 2023 North America

Major Players

Sanofi, US Med Clinic, Eli Lilly, Novo Nordisk, Boehringer Ingelheim, Abbott Laboratories, Amgen, Tandem Diabetes Care, Becton Dickinson, Dexcom, Ypsomed, Pfizer, Roche, Medtronic, Terumo

Market Trends

Diabetes Pen Market Market Drivers

Market Segment Insights

Regional Insights

Industry Developments

Market Segmentation

Americas Diabetes Pen Industry Outlook By Type

  • Disposable Insulin Pen
  • Reusable Insulin Pen

Americas Diabetes Pen Industry Outlook By Therapy

  • Insulin
  • Glucagon-Like Peptide-1 (Glp-1)
  • Growth Hormones
  • Becton, Dickinson And Company
  • Novo Nordisk A/S
  • Ypsomed Holding Ag
  • Owen Mumford, Ltd.
  • Sanofi
  • Eli Lilly
  • Merck Animal Health

Report Scope

FAQs

  1. SECTION I: EXECUTIVE SUMMARY AND KEY HIGHLIGHTS
    1. EXECUTIVE SUMMARY
      1. Market Overview
      2. Key Findings
      3. Market Segmentation
      4. Competitive Landscape
      5. Challenges and Opportunities
      6. Future Outlook
  2. SECTION II: SCOPING, METHODOLOGY AND MARKET STRUCTURE
    1. MARKET INTRODUCTION
      1. Definition
      2. Scope of the study
    2. RESEARCH METHODOLOGY
      1. Overview
      2. Data Mining
      3. Secondary Research
      4. Primary Research
      5. Forecasting Model
      6. Market Size Estimation
      7. Data Triangulation
      8. Validation
  3. SECTION III: QUALITATIVE ANALYSIS
    1. MARKET DYNAMICS
      1. Overview
      2. Drivers
      3. Restraints
      4. Opportunities
    2. MARKET FACTOR ANALYSIS
      1. Value chain Analysis
      2. Porter's Five Forces Analysis
      3. COVID-19 Impact Analysis
  4. SECTION IV: QUANTITATIVE ANALYSIS
    1. Healthcare, BY Type (USD Billion)
      1. Reusable Pens
      2. Disposable Pens
      3. Smart Pens
    2. Healthcare, BY Delivery Method (USD Billion)
      1. Subcutaneous Injection
      2. Intramuscular Injection
      3. Intravenous Injection
    3. Healthcare, BY Therapeutic Area (USD Billion)
      1. Type 1 Diabetes
      2. Type 2 Diabetes
      3. Gestational Diabetes
    4. Healthcare, BY End User (USD Billion)
      1. Hospitals
      2. Homecare Settings
      3. Diabetes Clinics
    5. Healthcare, BY Region (USD Billion)
      1. North America
      2. Europe
      3. APAC
      4. South America
      5. MEA
  5. SECTION V: COMPETITIVE ANALYSIS
    1. Competitive Landscape
      1. Overview
      2. Competitive Analysis
      3. Market share Analysis
      4. Major Growth Strategy in the Healthcare
      5. Competitive Benchmarking
      6. Leading Players in Terms of Number of Developments in the Healthcare
      7. Key developments and growth strategies
      8. Major Players Financial Matrix
    2. Company Profiles
      1. Novo Nordisk (DK)
      2. Sanofi (FR)
      3. Boehringer Ingelheim (DE)
      4. Roche (CH)
      5. Eli Lilly (US)
      6. AstraZeneca (GB)
      7. Ypsomed (CH)
      8. Medtronic (US)
      9. Insulet (US)
    3. Appendix
      1. References
      2. Related Reports
  6. LIST OF FIGURES
    1. MARKET SYNOPSIS
    2. NORTH AMERICA MARKET ANALYSIS
    3. US MARKET ANALYSIS BY TYPE
    4. US MARKET ANALYSIS BY DELIVERY METHOD
    5. US MARKET ANALYSIS BY THERAPEUTIC AREA
    6. US MARKET ANALYSIS BY END USER
    7. CANADA MARKET ANALYSIS BY TYPE
    8. CANADA MARKET ANALYSIS BY DELIVERY METHOD
    9. CANADA MARKET ANALYSIS BY THERAPEUTIC AREA
    10. CANADA MARKET ANALYSIS BY END USER
    11. EUROPE MARKET ANALYSIS
    12. GERMANY MARKET ANALYSIS BY TYPE
    13. GERMANY MARKET ANALYSIS BY DELIVERY METHOD
    14. GERMANY MARKET ANALYSIS BY THERAPEUTIC AREA
    15. GERMANY MARKET ANALYSIS BY END USER
    16. UK MARKET ANALYSIS BY TYPE
    17. UK MARKET ANALYSIS BY DELIVERY METHOD
    18. UK MARKET ANALYSIS BY THERAPEUTIC AREA
    19. UK MARKET ANALYSIS BY END USER
    20. FRANCE MARKET ANALYSIS BY TYPE
    21. FRANCE MARKET ANALYSIS BY DELIVERY METHOD
    22. FRANCE MARKET ANALYSIS BY THERAPEUTIC AREA
    23. FRANCE MARKET ANALYSIS BY END USER
    24. RUSSIA MARKET ANALYSIS BY TYPE
    25. RUSSIA MARKET ANALYSIS BY DELIVERY METHOD
    26. RUSSIA MARKET ANALYSIS BY THERAPEUTIC AREA
    27. RUSSIA MARKET ANALYSIS BY END USER
    28. ITALY MARKET ANALYSIS BY TYPE
    29. ITALY MARKET ANALYSIS BY DELIVERY METHOD
    30. ITALY MARKET ANALYSIS BY THERAPEUTIC AREA
    31. ITALY MARKET ANALYSIS BY END USER
    32. SPAIN MARKET ANALYSIS BY TYPE
    33. SPAIN MARKET ANALYSIS BY DELIVERY METHOD
    34. SPAIN MARKET ANALYSIS BY THERAPEUTIC AREA
    35. SPAIN MARKET ANALYSIS BY END USER
    36. REST OF EUROPE MARKET ANALYSIS BY TYPE
    37. REST OF EUROPE MARKET ANALYSIS BY DELIVERY METHOD
    38. REST OF EUROPE MARKET ANALYSIS BY THERAPEUTIC AREA
    39. REST OF EUROPE MARKET ANALYSIS BY END USER
    40. APAC MARKET ANALYSIS
    41. CHINA MARKET ANALYSIS BY TYPE
    42. CHINA MARKET ANALYSIS BY DELIVERY METHOD
    43. CHINA MARKET ANALYSIS BY THERAPEUTIC AREA
    44. CHINA MARKET ANALYSIS BY END USER
    45. INDIA MARKET ANALYSIS BY TYPE
    46. INDIA MARKET ANALYSIS BY DELIVERY METHOD
    47. INDIA MARKET ANALYSIS BY THERAPEUTIC AREA
    48. INDIA MARKET ANALYSIS BY END USER
    49. JAPAN MARKET ANALYSIS BY TYPE
    50. JAPAN MARKET ANALYSIS BY DELIVERY METHOD
    51. JAPAN MARKET ANALYSIS BY THERAPEUTIC AREA
    52. JAPAN MARKET ANALYSIS BY END USER
    53. SOUTH KOREA MARKET ANALYSIS BY TYPE
    54. SOUTH KOREA MARKET ANALYSIS BY DELIVERY METHOD
    55. SOUTH KOREA MARKET ANALYSIS BY THERAPEUTIC AREA
    56. SOUTH KOREA MARKET ANALYSIS BY END USER
    57. MALAYSIA MARKET ANALYSIS BY TYPE
    58. MALAYSIA MARKET ANALYSIS BY DELIVERY METHOD
    59. MALAYSIA MARKET ANALYSIS BY THERAPEUTIC AREA
    60. MALAYSIA MARKET ANALYSIS BY END USER
    61. THAILAND MARKET ANALYSIS BY TYPE
    62. THAILAND MARKET ANALYSIS BY DELIVERY METHOD
    63. THAILAND MARKET ANALYSIS BY THERAPEUTIC AREA
    64. THAILAND MARKET ANALYSIS BY END USER
    65. INDONESIA MARKET ANALYSIS BY TYPE
    66. INDONESIA MARKET ANALYSIS BY DELIVERY METHOD
    67. INDONESIA MARKET ANALYSIS BY THERAPEUTIC AREA
    68. INDONESIA MARKET ANALYSIS BY END USER
    69. REST OF APAC MARKET ANALYSIS BY TYPE
    70. REST OF APAC MARKET ANALYSIS BY DELIVERY METHOD
    71. REST OF APAC MARKET ANALYSIS BY THERAPEUTIC AREA
    72. REST OF APAC MARKET ANALYSIS BY END USER
    73. SOUTH AMERICA MARKET ANALYSIS
    74. BRAZIL MARKET ANALYSIS BY TYPE
    75. BRAZIL MARKET ANALYSIS BY DELIVERY METHOD
    76. BRAZIL MARKET ANALYSIS BY THERAPEUTIC AREA
    77. BRAZIL MARKET ANALYSIS BY END USER
    78. MEXICO MARKET ANALYSIS BY TYPE
    79. MEXICO MARKET ANALYSIS BY DELIVERY METHOD
    80. MEXICO MARKET ANALYSIS BY THERAPEUTIC AREA
    81. MEXICO MARKET ANALYSIS BY END USER
    82. ARGENTINA MARKET ANALYSIS BY TYPE
    83. ARGENTINA MARKET ANALYSIS BY DELIVERY METHOD
    84. ARGENTINA MARKET ANALYSIS BY THERAPEUTIC AREA
    85. ARGENTINA MARKET ANALYSIS BY END USER
    86. REST OF SOUTH AMERICA MARKET ANALYSIS BY TYPE
    87. REST OF SOUTH AMERICA MARKET ANALYSIS BY DELIVERY METHOD
    88. REST OF SOUTH AMERICA MARKET ANALYSIS BY THERAPEUTIC AREA
    89. REST OF SOUTH AMERICA MARKET ANALYSIS BY END USER
    90. MEA MARKET ANALYSIS
    91. GCC COUNTRIES MARKET ANALYSIS BY TYPE
    92. GCC COUNTRIES MARKET ANALYSIS BY DELIVERY METHOD
    93. GCC COUNTRIES MARKET ANALYSIS BY THERAPEUTIC AREA
    94. GCC COUNTRIES MARKET ANALYSIS BY END USER
    95. SOUTH AFRICA MARKET ANALYSIS BY TYPE
    96. SOUTH AFRICA MARKET ANALYSIS BY DELIVERY METHOD
    97. SOUTH AFRICA MARKET ANALYSIS BY THERAPEUTIC AREA
    98. SOUTH AFRICA MARKET ANALYSIS BY END USER
    99. REST OF MEA MARKET ANALYSIS BY TYPE
    100. REST OF MEA MARKET ANALYSIS BY DELIVERY METHOD
    101. REST OF MEA MARKET ANALYSIS BY THERAPEUTIC AREA
    102. REST OF MEA MARKET ANALYSIS BY END USER
    103. KEY BUYING CRITERIA OF HEALTHCARE
    104. RESEARCH PROCESS OF MRFR
    105. DRO ANALYSIS OF HEALTHCARE
    106. DRIVERS IMPACT ANALYSIS: HEALTHCARE
    107. RESTRAINTS IMPACT ANALYSIS: HEALTHCARE
    108. SUPPLY / VALUE CHAIN: HEALTHCARE
    109. HEALTHCARE, BY TYPE, 2024 (% SHARE)
    110. HEALTHCARE, BY TYPE, 2024 TO 2035 (USD Billion)
    111. HEALTHCARE, BY DELIVERY METHOD, 2024 (% SHARE)
    112. HEALTHCARE, BY DELIVERY METHOD, 2024 TO 2035 (USD Billion)
    113. HEALTHCARE, BY THERAPEUTIC AREA, 2024 (% SHARE)
    114. HEALTHCARE, BY THERAPEUTIC AREA, 2024 TO 2035 (USD Billion)
    115. HEALTHCARE, BY END USER, 2024 (% SHARE)
    116. HEALTHCARE, BY END USER, 2024 TO 2035 (USD Billion)
    117. BENCHMARKING OF MAJOR COMPETITORS
  7. LIST OF TABLES
    1. LIST OF ASSUMPTIONS
    2. North America MARKET SIZE ESTIMATES; FORECAST
      1. BY TYPE, 2025-2035 (USD Billion)
      2. BY DELIVERY METHOD, 2025-2035 (USD Billion)
      3. BY THERAPEUTIC AREA, 2025-2035 (USD Billion)
      4. BY END USER, 2025-2035 (USD Billion)
    3. US MARKET SIZE ESTIMATES; FORECAST
      1. BY TYPE, 2025-2035 (USD Billion)
      2. BY DELIVERY METHOD, 2025-2035 (USD Billion)
      3. BY THERAPEUTIC AREA, 2025-2035 (USD Billion)
      4. BY END USER, 2025-2035 (USD Billion)
    4. Canada MARKET SIZE ESTIMATES; FORECAST
      1. BY TYPE, 2025-2035 (USD Billion)
      2. BY DELIVERY METHOD, 2025-2035 (USD Billion)
      3. BY THERAPEUTIC AREA, 2025-2035 (USD Billion)
      4. BY END USER, 2025-2035 (USD Billion)
    5. Europe MARKET SIZE ESTIMATES; FORECAST
      1. BY TYPE, 2025-2035 (USD Billion)
      2. BY DELIVERY METHOD, 2025-2035 (USD Billion)
      3. BY THERAPEUTIC AREA, 2025-2035 (USD Billion)
      4. BY END USER, 2025-2035 (USD Billion)
    6. Germany MARKET SIZE ESTIMATES; FORECAST
      1. BY TYPE, 2025-2035 (USD Billion)
      2. BY DELIVERY METHOD, 2025-2035 (USD Billion)
      3. BY THERAPEUTIC AREA, 2025-2035 (USD Billion)
      4. BY END USER, 2025-2035 (USD Billion)
    7. UK MARKET SIZE ESTIMATES; FORECAST
      1. BY TYPE, 2025-2035 (USD Billion)
      2. BY DELIVERY METHOD, 2025-2035 (USD Billion)
      3. BY THERAPEUTIC AREA, 2025-2035 (USD Billion)
      4. BY END USER, 2025-2035 (USD Billion)
    8. France MARKET SIZE ESTIMATES; FORECAST
      1. BY TYPE, 2025-2035 (USD Billion)
      2. BY DELIVERY METHOD, 2025-2035 (USD Billion)
      3. BY THERAPEUTIC AREA, 2025-2035 (USD Billion)
      4. BY END USER, 2025-2035 (USD Billion)
    9. Russia MARKET SIZE ESTIMATES; FORECAST
      1. BY TYPE, 2025-2035 (USD Billion)
      2. BY DELIVERY METHOD, 2025-2035 (USD Billion)
      3. BY THERAPEUTIC AREA, 2025-2035 (USD Billion)
      4. BY END USER, 2025-2035 (USD Billion)
    10. Italy MARKET SIZE ESTIMATES; FORECAST
      1. BY TYPE, 2025-2035 (USD Billion)
      2. BY DELIVERY METHOD, 2025-2035 (USD Billion)
      3. BY THERAPEUTIC AREA, 2025-2035 (USD Billion)
      4. BY END USER, 2025-2035 (USD Billion)
    11. Spain MARKET SIZE ESTIMATES; FORECAST
      1. BY TYPE, 2025-2035 (USD Billion)
      2. BY DELIVERY METHOD, 2025-2035 (USD Billion)
      3. BY THERAPEUTIC AREA, 2025-2035 (USD Billion)
      4. BY END USER, 2025-2035 (USD Billion)
    12. Rest of Europe MARKET SIZE ESTIMATES; FORECAST
      1. BY TYPE, 2025-2035 (USD Billion)
      2. BY DELIVERY METHOD, 2025-2035 (USD Billion)
      3. BY THERAPEUTIC AREA, 2025-2035 (USD Billion)
      4. BY END USER, 2025-2035 (USD Billion)
    13. APAC MARKET SIZE ESTIMATES; FORECAST
      1. BY TYPE, 2025-2035 (USD Billion)
      2. BY DELIVERY METHOD, 2025-2035 (USD Billion)
      3. BY THERAPEUTIC AREA, 2025-2035 (USD Billion)
      4. BY END USER, 2025-2035 (USD Billion)
    14. China MARKET SIZE ESTIMATES; FORECAST
      1. BY TYPE, 2025-2035 (USD Billion)
      2. BY DELIVERY METHOD, 2025-2035 (USD Billion)
      3. BY THERAPEUTIC AREA, 2025-2035 (USD Billion)
      4. BY END USER, 2025-2035 (USD Billion)
    15. India MARKET SIZE ESTIMATES; FORECAST
      1. BY TYPE, 2025-2035 (USD Billion)
      2. BY DELIVERY METHOD, 2025-2035 (USD Billion)
      3. BY THERAPEUTIC AREA, 2025-2035 (USD Billion)
      4. BY END USER, 2025-2035 (USD Billion)
    16. Japan MARKET SIZE ESTIMATES; FORECAST
      1. BY TYPE, 2025-2035 (USD Billion)
      2. BY DELIVERY METHOD, 2025-2035 (USD Billion)
      3. BY THERAPEUTIC AREA, 2025-2035 (USD Billion)
      4. BY END USER, 2025-2035 (USD Billion)
    17. South Korea MARKET SIZE ESTIMATES; FORECAST
      1. BY TYPE, 2025-2035 (USD Billion)
      2. BY DELIVERY METHOD, 2025-2035 (USD Billion)
      3. BY THERAPEUTIC AREA, 2025-2035 (USD Billion)
      4. BY END USER, 2025-2035 (USD Billion)
    18. Malaysia MARKET SIZE ESTIMATES; FORECAST
      1. BY TYPE, 2025-2035 (USD Billion)
      2. BY DELIVERY METHOD, 2025-2035 (USD Billion)
      3. BY THERAPEUTIC AREA, 2025-2035 (USD Billion)
      4. BY END USER, 2025-2035 (USD Billion)
    19. Thailand MARKET SIZE ESTIMATES; FORECAST
      1. BY TYPE, 2025-2035 (USD Billion)
      2. BY DELIVERY METHOD, 2025-2035 (USD Billion)
      3. BY THERAPEUTIC AREA, 2025-2035 (USD Billion)
      4. BY END USER, 2025-2035 (USD Billion)
    20. Indonesia MARKET SIZE ESTIMATES; FORECAST
      1. BY TYPE, 2025-2035 (USD Billion)
      2. BY DELIVERY METHOD, 2025-2035 (USD Billion)
      3. BY THERAPEUTIC AREA, 2025-2035 (USD Billion)
      4. BY END USER, 2025-2035 (USD Billion)
    21. Rest of APAC MARKET SIZE ESTIMATES; FORECAST
      1. BY TYPE, 2025-2035 (USD Billion)
      2. BY DELIVERY METHOD, 2025-2035 (USD Billion)
      3. BY THERAPEUTIC AREA, 2025-2035 (USD Billion)
      4. BY END USER, 2025-2035 (USD Billion)
    22. South America MARKET SIZE ESTIMATES; FORECAST
      1. BY TYPE, 2025-2035 (USD Billion)
      2. BY DELIVERY METHOD, 2025-2035 (USD Billion)
      3. BY THERAPEUTIC AREA, 2025-2035 (USD Billion)
      4. BY END USER, 2025-2035 (USD Billion)
    23. Brazil MARKET SIZE ESTIMATES; FORECAST
      1. BY TYPE, 2025-2035 (USD Billion)
      2. BY DELIVERY METHOD, 2025-2035 (USD Billion)
      3. BY THERAPEUTIC AREA, 2025-2035 (USD Billion)
      4. BY END USER, 2025-2035 (USD Billion)
    24. Mexico MARKET SIZE ESTIMATES; FORECAST
      1. BY TYPE, 2025-2035 (USD Billion)
      2. BY DELIVERY METHOD, 2025-2035 (USD Billion)
      3. BY THERAPEUTIC AREA, 2025-2035 (USD Billion)
      4. BY END USER, 2025-2035 (USD Billion)
    25. Argentina MARKET SIZE ESTIMATES; FORECAST
      1. BY TYPE, 2025-2035 (USD Billion)
      2. BY DELIVERY METHOD, 2025-2035 (USD Billion)
      3. BY THERAPEUTIC AREA, 2025-2035 (USD Billion)
      4. BY END USER, 2025-2035 (USD Billion)
    26. Rest of South America MARKET SIZE ESTIMATES; FORECAST
      1. BY TYPE, 2025-2035 (USD Billion)
      2. BY DELIVERY METHOD, 2025-2035 (USD Billion)
      3. BY THERAPEUTIC AREA, 2025-2035 (USD Billion)
      4. BY END USER, 2025-2035 (USD Billion)
    27. MEA MARKET SIZE ESTIMATES; FORECAST
      1. BY TYPE, 2025-2035 (USD Billion)
      2. BY DELIVERY METHOD, 2025-2035 (USD Billion)
      3. BY THERAPEUTIC AREA, 2025-2035 (USD Billion)
      4. BY END USER, 2025-2035 (USD Billion)
    28. GCC Countries MARKET SIZE ESTIMATES; FORECAST
      1. BY TYPE, 2025-2035 (USD Billion)
      2. BY DELIVERY METHOD, 2025-2035 (USD Billion)
      3. BY THERAPEUTIC AREA, 2025-2035 (USD Billion)
      4. BY END USER, 2025-2035 (USD Billion)
    29. South Africa MARKET SIZE ESTIMATES; FORECAST
      1. BY TYPE, 2025-2035 (USD Billion)
      2. BY DELIVERY METHOD, 2025-2035 (USD Billion)
      3. BY THERAPEUTIC AREA, 2025-2035 (USD Billion)
      4. BY END USER, 2025-2035 (USD Billion)
    30. Rest of MEA MARKET SIZE ESTIMATES; FORECAST
      1. BY TYPE, 2025-2035 (USD Billion)
      2. BY DELIVERY METHOD, 2025-2035 (USD Billion)
      3. BY THERAPEUTIC AREA, 2025-2035 (USD Billion)
      4. BY END USER, 2025-2035 (USD Billion)
    31. PRODUCT LAUNCH/PRODUCT DEVELOPMENT/APPROVAL
    32. ACQUISITION/PARTNERSHIP

Americas Diabetes Pen Market Segmentation

Market Segmentation Overview

  • Detailed segmentation data will be available in the full report
  • Comprehensive analysis by multiple parameters
  • Regional and country-level breakdowns
  • Market size forecasts by segment
Infographic

Free Sample Request

Kindly complete the form below to receive a free sample of this Report

Get Free Sample

Customer Strories

“I am very pleased with how market segments have been defined in a relevant way for my purposes (such as "Portable Freezers & refrigerators" and "last-mile"). In general the report is well structured. Thanks very much for your efforts.”

Victoria Milne

Founder

Compare Licence

×
Features License Type
Single User Multiuser License Enterprise User
Price $4,950 $5,950 $7,250
Maximum User Access Limit 1 User Upto 10 Users Unrestricted Access Throughout the Organization
Free Customization
Direct Access to Analyst
Deliverable Format
Platform Access
Discount on Next Purchase 10% 15% 15%
Printable Versions