Request Free Sample ×

Kindly complete the form below to receive a free sample of this Report

* Please use a valid business email

Leading companies partner with us for data-driven Insights

clients tt-cursor
Hero Background

Digital Accessibility Software Market

ID: MRFR/ICT/27537-HCR
100 Pages
Nirmit Biswas
Last Updated: June 01, 2026
Digital Accessibility Software Market Size, Share and Research Report: By Deployment Model (Cloud-Based, On-Premises), By Component (Solutions, Services), By Organization Size (Small and Medium-Sized Enterprises (SMEs), Large Enterprises), By Industry Vertical (Banking, Education, Healthcare, IT and Telecom, Manufacturing, Retail and e-commerce), By Application (Website Accessibility, Document Accessibility, Video Accessibility, Mobile Accessibility, Compliance and Reporting) and By Regional (North America, Europe, South America, Asia Pacific, Middle East and Africa) - Industry Forecast to 2035
Download PDF ×

We do not share your information with anyone. However, we may send you emails based on your report interest from time to time. You may contact us at any time to opt-out.

  1. 1 Market Overview |
    1. 1.1 Study Assumptions & Market Definition |
    2. 1.2 Scope of the Study |
    3. 1.3 Research Methodology
  2. 2 Market Summary & Key Takeaways
  3. 3 Market Dynamics |
    1. 3.1 Market Drivers Analysis | |
      1. 3.1.1 Regulatory Mandate Expansion (EAA, Section 508 Refresh) | |
      2. 3.1.2 AI-Powered Auto-Remediation Adoption | |
      3. 3.1.3 ESG & Sustainability Reporting Requirements | |
      4. 3.1.4 Mobile-First Accessibility Mandates | |
      5. 3.1.5 Litigation & Legal Liability Pressure |
    2. 3.2 Market Restraints Analysis | |
      1. 3.2.1 High Implementation Cost for SMEs | |
      2. 3.2.2 Fragmented Regulatory Standards Across Jurisdictions | |
      3. 3.2.3 Shortage of Certified Accessibility Auditors | |
      4. 3.2.4 AI False-Positive Remediation Risk |
    3. 3.3 Market Opportunity Analysis | |
      1. 3.3.1 Embedded Accessibility in Low-Code/No-Code Platforms | |
      2. 3.3.2 Asia-Pacific Public-Sector Digitization | |
      3. 3.3.3 Accessibility-as-a-Service Revenue Models | |
      4. 3.3.4 Data Monetization Through Accessibility Analytics | |
      5. 3.3.5 Emerging-Market Localization |
    4. 3.4 Industry Value Chain Analysis |
    5. 3.5 Porter’s Five Forces Analysis
  4. 4 Global Digital Accessibility Software Market Size & Forecast (2021–2035) |
    1. 4.1 Historical Market Size (2021–2025) |
    2. 4.2 Current & Forecast Market Size (2026–2035) |
    3. 4.3 Market Size by Revenue (USD Billion) |
    4. 4.4 Year-over-Year Growth Analysis
  5. 5 Segmentation Analysis |
    1. 5.1 By Type | |
      1. 5.1.1 Website Accessibility Platforms | |
      2. 5.1.2 Automated Scan and Audit Tools | |
      3. 5.1.3 Mobile and App Accessibility Suites | |
      4. 5.1.4 Document Accessibility Tools | |
      5. 5.1.5 Others |
    2. 5.2 By Deployment Mode | |
      1. 5.2.1 Cloud-Based | |
      2. 5.2.2 On-Premise |
    3. 5.3 By Organization Size | |
      1. 5.3.1 Large Enterprises | |
      2. 5.3.2 Small and Medium Enterprises |
    4. 5.4 By End-User Industry | |
      1. 5.4.1 E-Commerce and Retail | |
      2. 5.4.2 BFSI | |
      3. 5.4.3 Government and Public Sector | |
      4. 5.4.4 Healthcare | |
      5. 5.4.5 Education | |
      6. 5.4.6 Others
  6. 6 Regional Analysis |
    1. 6.1 North America | |
      1. 6.1.1 United States | |
      2. 6.1.2 Canada | |
      3. 6.1.3 Mexico |
    2. 6.2 Europe | |
      1. 6.2.1 Germany | |
      2. 6.2.2 United Kingdom | |
      3. 6.2.3 France | |
      4. 6.2.4 Italy | |
      5. 6.2.5 Spain | |
      6. 6.2.6 Nordic Countries | |
      7. 6.2.7 Russia | |
      8. 6.2.8 Rest of Europe |
    3. 6.3 Asia-Pacific | |
      1. 6.3.1 China | |
      2. 6.3.2 India | |
      3. 6.3.3 Japan | |
      4. 6.3.4 South Korea | |
      5. 6.3.5 ASEAN | |
      6. 6.3.6 Rest of Asia-Pacific |
    4. 6.4 South America | |
      1. 6.4.1 Brazil | |
      2. 6.4.2 Argentina | |
      3. 6.4.3 Rest of South America |
    5. 6.5 Middle East & Africa | |
      1. 6.5.1 Saudi Arabia | |
      2. 6.5.2 UAE | |
      3. 6.5.3 South Africa | |
      4. 6.5.4 Egypt | |
      5. 6.5.5 Rest of MEA
  7. 7 Competitive Landscape |
    1. 7.1 Market Share Analysis (2026) |
    2. 7.2 Competitive Benchmarking Matrix |
    3. 7.3 Company Profiles | |
      1. 7.3.1 Deque Systems | |
      2. 7.3.2 Level Access | |
      3. 7.3.3 AudioEye | |
      4. 7.3.4 accessiBe | |
      5. 7.3.5 Siteimprove | |
      6. 7.3.6 UserWay | |
      7. 7.3.7 TPGi (Vispero) | |
      8. 7.3.8 Monsido (Acquia) | |
      9. 7.3.9 eSSENTIAL Accessibility | |
      10. 7.3.10 Tenon.io
  8. 8 Future Outlook & Strategic Recommendations (2026–2035) |
    1. 8.1 Near-Term Outlook (2026–2028) |
    2. 8.2 Medium-Term Outlook (2029–2031) |
    3. 8.3 Long-Term Outlook (2032–2035)
  9. 9 Recent Developments & News
  10. 10 Frequently Asked Questions (FAQs)
  11. 11 Report Scope & Methodology |
    1. 11.1 Study Period & Base Year |
    2. 11.2 Data Sources & Citations |
    3. 11.3 Abbreviations
  12. 12 LIST OF TABLES |
  13. TABLE 1 Global Digital Accessibility Software Market Size & Forecast, by Revenue (USD Billion), 2021–2035 |
  14. TABLE 2 Global Digital Accessibility Software Market – Year-over-Year Growth Analysis, 2021–2035 |
  15. TABLE 3 Global Digital Accessibility Software Market Size, By Type, 2021–2035 (USD Billion) |
  16. TABLE 4 Global Digital Accessibility Software Market Size, By Deployment Mode, 2021–2035 (USD Billion) |
  17. TABLE 5 Global Digital Accessibility Software Market Size, By Organization Size, 2021–2035 (USD Billion) |
  18. TABLE 6 Global Digital Accessibility Software Market Size, By End-User Industry, 2021–2035 (USD Billion) |
  19. TABLE 7 Global Digital Accessibility Software Market Size, by Region, 2021–2035 (USD Billion) |
  20. TABLE 8 North America Digital Accessibility Software Market Size, by Country, 2021–2035 (USD Billion) |
  21. TABLE 9 Europe Digital Accessibility Software Market Size, by Country, 2021–2035 (USD Billion) |
  22. TABLE 10 Asia-Pacific Digital Accessibility Software Market Size, by Country, 2021–2035 (USD Billion) |
  23. TABLE 11 South America Digital Accessibility Software Market Size, by Country, 2021–2035 (USD Billion) |
  24. TABLE 12 Middle East & Africa Digital Accessibility Software Market Size, by Country, 2021–2035 (USD Billion) |
  25. TABLE 13 Competitive Benchmarking Matrix – Global Digital Accessibility Software Market, 2026 |
  26. TABLE 14 Company Profiles – Key Players, Global Digital Accessibility Software Market |
  27. TABLE 15 Recent Developments & Strategic Announcements, 2023–2025 |
  28. TABLE 16 North America Digital Accessibility Software Market Size, By Type, 2021–2035 (USD Billion) |
  29. TABLE 17 North America Digital Accessibility Software Market Size, By Deployment Mode, 2021–2035 (USD Billion) |
  30. TABLE 18 North America Digital Accessibility Software Market Size, By Organization Size, 2021–2035 (USD Billion) |
  31. TABLE 19 North America Digital Accessibility Software Market Size, By End-User Industry, 2021–2035 (USD Billion) |
  32. TABLE 20 Europe Digital Accessibility Software Market Size, By Type, 2021–2035 (USD Billion) |
  33. TABLE 21 Europe Digital Accessibility Software Market Size, By Deployment Mode, 2021–2035 (USD Billion) |
  34. TABLE 22 Europe Digital Accessibility Software Market Size, By Organization Size, 2021–2035 (USD Billion) |
  35. TABLE 23 Europe Digital Accessibility Software Market Size, By End-User Industry, 2021–2035 (USD Billion) |
  36. TABLE 24 Asia-Pacific Digital Accessibility Software Market Size, By Type, 2021–2035 (USD Billion) |
  37. TABLE 25 Asia-Pacific Digital Accessibility Software Market Size, By Deployment Mode, 2021–2035 (USD Billion) |
  38. TABLE 26 Asia-Pacific Digital Accessibility Software Market Size, By Organization Size, 2021–2035 (USD Billion) |
  39. TABLE 27 Asia-Pacific Digital Accessibility Software Market Size, By End-User Industry, 2021–2035 (USD Billion) |
  40. TABLE 28 South America Digital Accessibility Software Market Size, By Type, 2021–2035 (USD Billion) |
  41. TABLE 29 South America Digital Accessibility Software Market Size, By Deployment Mode, 2021–2035 (USD Billion) |
  42. TABLE 30 South America Digital Accessibility Software Market Size, By Organization Size, 2021–2035 (USD Billion) |
  43. TABLE 31 South America Digital Accessibility Software Market Size, By End-User Industry, 2021–2035 (USD Billion) |
  44. TABLE 32 Middle East & Africa Digital Accessibility Software Market Size, By Type, 2021–2035 (USD Billion) |
  45. TABLE 33 Middle East & Africa Digital Accessibility Software Market Size, By Deployment Mode, 2021–2035 (USD Billion) |
  46. TABLE 34 Middle East & Africa Digital Accessibility Software Market Size, By Organization Size, 2021–2035 (USD Billion) |
  47. TABLE 35 Middle East & Africa Digital Accessibility Software Market Size, By End-User Industry, 2021–2035 (USD Billion) |
  48. TABLE 36 United States Digital Accessibility Software Market Size, By Type, 2021–2035 (USD Billion) |
  49. TABLE 37 United States Digital Accessibility Software Market Size, By Deployment Mode, 2021–2035 (USD Billion) |
  50. TABLE 38 United States Digital Accessibility Software Market Size, By Organization Size, 2021–2035 (USD Billion) |
  51. TABLE 39 United States Digital Accessibility Software Market Size, By End-User Industry, 2021–2035 (USD Billion) |
  52. TABLE 40 Canada Digital Accessibility Software Market Size, By Type, 2021–2035 (USD Billion) |
  53. TABLE 41 Canada Digital Accessibility Software Market Size, By Deployment Mode, 2021–2035 (USD Billion) |
  54. TABLE 42 Canada Digital Accessibility Software Market Size, By Organization Size, 2021–2035 (USD Billion) |
  55. TABLE 43 Canada Digital Accessibility Software Market Size, By End-User Industry, 2021–2035 (USD Billion) |
  56. TABLE 44 Mexico Digital Accessibility Software Market Size, By Type, 2021–2035 (USD Billion) |
  57. TABLE 45 Mexico Digital Accessibility Software Market Size, By Deployment Mode, 2021–2035 (USD Billion) |
  58. TABLE 46 Mexico Digital Accessibility Software Market Size, By Organization Size, 2021–2035 (USD Billion) |
  59. TABLE 47 Mexico Digital Accessibility Software Market Size, By End-User Industry, 2021–2035 (USD Billion) |
  60. TABLE 48 Germany Digital Accessibility Software Market Size, By Type, 2021–2035 (USD Billion) |
  61. TABLE 49 Germany Digital Accessibility Software Market Size, By Deployment Mode, 2021–2035 (USD Billion) |
  62. TABLE 50 Germany Digital Accessibility Software Market Size, By Organization Size, 2021–2035 (USD Billion) |
  63. TABLE 51 Germany Digital Accessibility Software Market Size, By End-User Industry, 2021–2035 (USD Billion) |
  64. TABLE 52 United Kingdom Digital Accessibility Software Market Size, By Type, 2021–2035 (USD Billion) |
  65. TABLE 53 United Kingdom Digital Accessibility Software Market Size, By Deployment Mode, 2021–2035 (USD Billion) |
  66. TABLE 54 United Kingdom Digital Accessibility Software Market Size, By Organization Size, 2021–2035 (USD Billion) |
  67. TABLE 55 United Kingdom Digital Accessibility Software Market Size, By End-User Industry, 2021–2035 (USD Billion) |
  68. TABLE 56 France Digital Accessibility Software Market Size, By Type, 2021–2035 (USD Billion) |
  69. TABLE 57 France Digital Accessibility Software Market Size, By Deployment Mode, 2021–2035 (USD Billion) |
  70. TABLE 58 France Digital Accessibility Software Market Size, By Organization Size, 2021–2035 (USD Billion) |
  71. TABLE 59 France Digital Accessibility Software Market Size, By End-User Industry, 2021–2035 (USD Billion) |
  72. TABLE 60 Italy Digital Accessibility Software Market Size, By Type, 2021–2035 (USD Billion) |
  73. TABLE 61 Italy Digital Accessibility Software Market Size, By Deployment Mode, 2021–2035 (USD Billion) |
  74. TABLE 62 Italy Digital Accessibility Software Market Size, By Organization Size, 2021–2035 (USD Billion) |
  75. TABLE 63 Italy Digital Accessibility Software Market Size, By End-User Industry, 2021–2035 (USD Billion) |
  76. TABLE 64 Spain Digital Accessibility Software Market Size, By Type, 2021–2035 (USD Billion) |
  77. TABLE 65 Spain Digital Accessibility Software Market Size, By Deployment Mode, 2021–2035 (USD Billion) |
  78. TABLE 66 Spain Digital Accessibility Software Market Size, By Organization Size, 2021–2035 (USD Billion) |
  79. TABLE 67 Spain Digital Accessibility Software Market Size, By End-User Industry, 2021–2035 (USD Billion) |
  80. TABLE 68 Nordic Countries Digital Accessibility Software Market Size, By Type, 2021–2035 (USD Billion) |
  81. TABLE 69 Nordic Countries Digital Accessibility Software Market Size, By Deployment Mode, 2021–2035 (USD Billion) |
  82. TABLE 70 Nordic Countries Digital Accessibility Software Market Size, By Organization Size, 2021–2035 (USD Billion) |
  83. TABLE 71 Nordic Countries Digital Accessibility Software Market Size, By End-User Industry, 2021–2035 (USD Billion) |
  84. TABLE 72 Russia Digital Accessibility Software Market Size, By Type, 2021–2035 (USD Billion) |
  85. TABLE 73 Russia Digital Accessibility Software Market Size, By Deployment Mode, 2021–2035 (USD Billion) |
  86. TABLE 74 Russia Digital Accessibility Software Market Size, By Organization Size, 2021–2035 (USD Billion) |
  87. TABLE 75 Russia Digital Accessibility Software Market Size, By End-User Industry, 2021–2035 (USD Billion) |
  88. TABLE 76 Rest of Europe Digital Accessibility Software Market Size, By Type, 2021–2035 (USD Billion) |
  89. TABLE 77 Rest of Europe Digital Accessibility Software Market Size, By Deployment Mode, 2021–2035 (USD Billion) |
  90. TABLE 78 Rest of Europe Digital Accessibility Software Market Size, By Organization Size, 2021–2035 (USD Billion) |
  91. TABLE 79 Rest of Europe Digital Accessibility Software Market Size, By End-User Industry, 2021–2035 (USD Billion) |
  92. TABLE 80 China Digital Accessibility Software Market Size, By Type, 2021–2035 (USD Billion) |
  93. TABLE 81 China Digital Accessibility Software Market Size, By Deployment Mode, 2021–2035 (USD Billion) |
  94. TABLE 82 China Digital Accessibility Software Market Size, By Organization Size, 2021–2035 (USD Billion) |
  95. TABLE 83 China Digital Accessibility Software Market Size, By End-User Industry, 2021–2035 (USD Billion) |
  96. TABLE 84 India Digital Accessibility Software Market Size, By Type, 2021–2035 (USD Billion) |
  97. TABLE 85 India Digital Accessibility Software Market Size, By Deployment Mode, 2021–2035 (USD Billion) |
  98. TABLE 86 India Digital Accessibility Software Market Size, By Organization Size, 2021–2035 (USD Billion) |
  99. TABLE 87 India Digital Accessibility Software Market Size, By End-User Industry, 2021–2035 (USD Billion) |
  100. TABLE 88 Japan Digital Accessibility Software Market Size, By Type, 2021–2035 (USD Billion) |
  101. TABLE 89 Japan Digital Accessibility Software Market Size, By Deployment Mode, 2021–2035 (USD Billion) |
  102. TABLE 90 Japan Digital Accessibility Software Market Size, By Organization Size, 2021–2035 (USD Billion) |
  103. TABLE 91 Japan Digital Accessibility Software Market Size, By End-User Industry, 2021–2035 (USD Billion) |
  104. TABLE 92 South Korea Digital Accessibility Software Market Size, By Type, 2021–2035 (USD Billion) |
  105. TABLE 93 South Korea Digital Accessibility Software Market Size, By Deployment Mode, 2021–2035 (USD Billion) |
  106. TABLE 94 South Korea Digital Accessibility Software Market Size, By Organization Size, 2021–2035 (USD Billion) |
  107. TABLE 95 South Korea Digital Accessibility Software Market Size, By End-User Industry, 2021–2035 (USD Billion) |
  108. TABLE 96 ASEAN Digital Accessibility Software Market Size, By Type, 2021–2035 (USD Billion) |
  109. TABLE 97 ASEAN Digital Accessibility Software Market Size, By Deployment Mode, 2021–2035 (USD Billion) |
  110. TABLE 98 ASEAN Digital Accessibility Software Market Size, By Organization Size, 2021–2035 (USD Billion) |
  111. TABLE 99 ASEAN Digital Accessibility Software Market Size, By End-User Industry, 2021–2035 (USD Billion) |
  112. TABLE 100 Rest of Asia-Pacific Digital Accessibility Software Market Size, By Type, 2021–2035 (USD Billion) |
  113. TABLE 101 Rest of Asia-Pacific Digital Accessibility Software Market Size, By Deployment Mode, 2021–2035 (USD Billion) |
  114. TABLE 102 Rest of Asia-Pacific Digital Accessibility Software Market Size, By Organization Size, 2021–2035 (USD Billion) |
  115. TABLE 103 Rest of Asia-Pacific Digital Accessibility Software Market Size, By End-User Industry, 2021–2035 (USD Billion) |
  116. TABLE 104 Brazil Digital Accessibility Software Market Size, By Type, 2021–2035 (USD Billion) |
  117. TABLE 105 Brazil Digital Accessibility Software Market Size, By Deployment Mode, 2021–2035 (USD Billion) |
  118. TABLE 106 Brazil Digital Accessibility Software Market Size, By Organization Size, 2021–2035 (USD Billion) |
  119. TABLE 107 Brazil Digital Accessibility Software Market Size, By End-User Industry, 2021–2035 (USD Billion) |
  120. TABLE 108 Argentina Digital Accessibility Software Market Size, By Type, 2021–2035 (USD Billion) |
  121. TABLE 109 Argentina Digital Accessibility Software Market Size, By Deployment Mode, 2021–2035 (USD Billion) |
  122. TABLE 110 Argentina Digital Accessibility Software Market Size, By Organization Size, 2021–2035 (USD Billion) |
  123. TABLE 111 Argentina Digital Accessibility Software Market Size, By End-User Industry, 2021–2035 (USD Billion) |
  124. TABLE 112 Rest of South America Digital Accessibility Software Market Size, By Type, 2021–2035 (USD Billion) |
  125. TABLE 113 Rest of South America Digital Accessibility Software Market Size, By Deployment Mode, 2021–2035 (USD Billion) |
  126. TABLE 114 Rest of South America Digital Accessibility Software Market Size, By Organization Size, 2021–2035 (USD Billion) |
  127. TABLE 115 Rest of South America Digital Accessibility Software Market Size, By End-User Industry, 2021–2035 (USD Billion) |
  128. TABLE 116 Saudi Arabia Digital Accessibility Software Market Size, By Type, 2021–2035 (USD Billion) |
  129. TABLE 117 Saudi Arabia Digital Accessibility Software Market Size, By Deployment Mode, 2021–2035 (USD Billion) |
  130. TABLE 118 Saudi Arabia Digital Accessibility Software Market Size, By Organization Size, 2021–2035 (USD Billion) |
  131. TABLE 119 Saudi Arabia Digital Accessibility Software Market Size, By End-User Industry, 2021–2035 (USD Billion) |
  132. TABLE 120 UAE Digital Accessibility Software Market Size, By Type, 2021–2035 (USD Billion) |
  133. TABLE 121 UAE Digital Accessibility Software Market Size, By Deployment Mode, 2021–2035 (USD Billion) |
  134. TABLE 122 UAE Digital Accessibility Software Market Size, By Organization Size, 2021–2035 (USD Billion) |
  135. TABLE 123 UAE Digital Accessibility Software Market Size, By End-User Industry, 2021–2035 (USD Billion) |
  136. TABLE 124 South Africa Digital Accessibility Software Market Size, By Type, 2021–2035 (USD Billion) |
  137. TABLE 125 South Africa Digital Accessibility Software Market Size, By Deployment Mode, 2021–2035 (USD Billion) |
  138. TABLE 126 South Africa Digital Accessibility Software Market Size, By Organization Size, 2021–2035 (USD Billion) |
  139. TABLE 127 South Africa Digital Accessibility Software Market Size, By End-User Industry, 2021–2035 (USD Billion) |
  140. TABLE 128 Egypt Digital Accessibility Software Market Size, By Type, 2021–2035 (USD Billion) |
  141. TABLE 129 Egypt Digital Accessibility Software Market Size, By Deployment Mode, 2021–2035 (USD Billion) |
  142. TABLE 130 Egypt Digital Accessibility Software Market Size, By Organization Size, 2021–2035 (USD Billion) |
  143. TABLE 131 Egypt Digital Accessibility Software Market Size, By End-User Industry, 2021–2035 (USD Billion) |
  144. TABLE 132 Rest of MEA Digital Accessibility Software Market Size, By Type, 2021–2035 (USD Billion) |
  145. TABLE 133 Rest of MEA Digital Accessibility Software Market Size, By Deployment Mode, 2021–2035 (USD Billion) |
  146. TABLE 134 Rest of MEA Digital Accessibility Software Market Size, By Organization Size, 2021–2035 (USD Billion) |
  147. TABLE 135 Rest of MEA Digital Accessibility Software Market Size, By End-User Industry, 2021–2035 (USD Billion)
  148. 13 LIST OF FIGURES |
  149. FIGURE 1 Global Digital Accessibility Software Market – Market Dynamics Framework |
  150. FIGURE 2 Global Digital Accessibility Software Market – Porter’s Five Forces Analysis |
  151. FIGURE 3 Global Digital Accessibility Software Market – Industry Value Chain Analysis |
  152. FIGURE 4 Global Digital Accessibility Software Market Size (USD Billion), 2021–2035 |
  153. FIGURE 5 Global Digital Accessibility Software Market – Revenue Share By Type, 2026 |
  154. FIGURE 6 Global Digital Accessibility Software Market – Revenue Share By Deployment Mode, 2026 |
  155. FIGURE 7 Global Digital Accessibility Software Market – Revenue Share By Organization Size, 2026 |
  156. FIGURE 8 Global Digital Accessibility Software Market – Revenue Share By End-User Industry, 2026 |
  157. FIGURE 9 Global Digital Accessibility Software Market – Revenue Share by Region, 2026 |
  158. FIGURE 10 North America Digital Accessibility Software Market – Revenue Share by Country, 2026 |
  159. FIGURE 11 Europe Digital Accessibility Software Market – Revenue Share by Country, 2026 |
  160. FIGURE 12 Asia-Pacific Digital Accessibility Software Market – Revenue Share by Country, 2026 |
  161. FIGURE 13 South America Digital Accessibility Software Market – Revenue Share by Country, 2026 |
  162. FIGURE 14 Middle East & Africa Digital Accessibility Software Market – Revenue Share by Country, 2026 |
  163. FIGURE 15 Global Digital Accessibility Software Market – Competitive Market Share Analysis, 2026 |
  164. FIGURE 16 North America Digital Accessibility Software Market – Revenue Share By Type, 2026 |
  165. FIGURE 17 North America Digital Accessibility Software Market – Revenue Share By Deployment Mode, 2026 |
  166. FIGURE 18 North America Digital Accessibility Software Market – Revenue Share By Organization Size, 2026 |
  167. FIGURE 19 North America Digital Accessibility Software Market – Revenue Share By End-User Industry, 2026 |
  168. FIGURE 20 Europe Digital Accessibility Software Market – Revenue Share By Type, 2026 |
  169. FIGURE 21 Europe Digital Accessibility Software Market – Revenue Share By Deployment Mode, 2026 |
  170. FIGURE 22 Europe Digital Accessibility Software Market – Revenue Share By Organization Size, 2026 |
  171. FIGURE 23 Europe Digital Accessibility Software Market – Revenue Share By End-User Industry, 2026 |
  172. FIGURE 24 Asia-Pacific Digital Accessibility Software Market – Revenue Share By Type, 2026 |
  173. FIGURE 25 Asia-Pacific Digital Accessibility Software Market – Revenue Share By Deployment Mode, 2026 |
  174. FIGURE 26 Asia-Pacific Digital Accessibility Software Market – Revenue Share By Organization Size, 2026 |
  175. FIGURE 27 Asia-Pacific Digital Accessibility Software Market – Revenue Share By End-User Industry, 2026 |
  176. FIGURE 28 South America Digital Accessibility Software Market – Revenue Share By Type, 2026 |
  177. FIGURE 29 South America Digital Accessibility Software Market – Revenue Share By Deployment Mode, 2026 |
  178. FIGURE 30 South America Digital Accessibility Software Market – Revenue Share By Organization Size, 2026 |
  179. FIGURE 31 South America Digital Accessibility Software Market – Revenue Share By End-User Industry, 2026 |
  180. FIGURE 32 Middle East & Africa Digital Accessibility Software Market – Revenue Share By Type, 2026 |
  181. FIGURE 33 Middle East & Africa Digital Accessibility Software Market – Revenue Share By Deployment Mode, 2026 |
  182. FIGURE 34 Middle East & Africa Digital Accessibility Software Market – Revenue Share By Organization Size, 2026 |
  183. FIGURE 35 Middle East & Africa Digital Accessibility Software Market – Revenue Share By End-User Industry, 2026 |
  184. FIGURE 36 United States Digital Accessibility Software Market – Revenue Share By Type, 2026 |
  185. FIGURE 37 United States Digital Accessibility Software Market – Revenue Share By Deployment Mode, 2026 |
  186. FIGURE 38 United States Digital Accessibility Software Market – Revenue Share By Organization Size, 2026 |
  187. FIGURE 39 United States Digital Accessibility Software Market – Revenue Share By End-User Industry, 2026 |
  188. FIGURE 40 Canada Digital Accessibility Software Market – Revenue Share By Type, 2026 |
  189. FIGURE 41 Canada Digital Accessibility Software Market – Revenue Share By Deployment Mode, 2026 |
  190. FIGURE 42 Canada Digital Accessibility Software Market – Revenue Share By Organization Size, 2026 |
  191. FIGURE 43 Canada Digital Accessibility Software Market – Revenue Share By End-User Industry, 2026 |
  192. FIGURE 44 Mexico Digital Accessibility Software Market – Revenue Share By Type, 2026 |
  193. FIGURE 45 Mexico Digital Accessibility Software Market – Revenue Share By Deployment Mode, 2026 |
  194. FIGURE 46 Mexico Digital Accessibility Software Market – Revenue Share By Organization Size, 2026 |
  195. FIGURE 47 Mexico Digital Accessibility Software Market – Revenue Share By End-User Industry, 2026 |
  196. FIGURE 48 Germany Digital Accessibility Software Market – Revenue Share By Type, 2026 |
  197. FIGURE 49 Germany Digital Accessibility Software Market – Revenue Share By Deployment Mode, 2026 |
  198. FIGURE 50 Germany Digital Accessibility Software Market – Revenue Share By Organization Size, 2026 |
  199. FIGURE 51 Germany Digital Accessibility Software Market – Revenue Share By End-User Industry, 2026 |
  200. FIGURE 52 United Kingdom Digital Accessibility Software Market – Revenue Share By Type, 2026 |
  201. FIGURE 53 United Kingdom Digital Accessibility Software Market – Revenue Share By Deployment Mode, 2026 |
  202. FIGURE 54 United Kingdom Digital Accessibility Software Market – Revenue Share By Organization Size, 2026 |
  203. FIGURE 55 United Kingdom Digital Accessibility Software Market – Revenue Share By End-User Industry, 2026 |
  204. FIGURE 56 France Digital Accessibility Software Market – Revenue Share By Type, 2026 |
  205. FIGURE 57 France Digital Accessibility Software Market – Revenue Share By Deployment Mode, 2026 |
  206. FIGURE 58 France Digital Accessibility Software Market – Revenue Share By Organization Size, 2026 |
  207. FIGURE 59 France Digital Accessibility Software Market – Revenue Share By End-User Industry, 2026 |
  208. FIGURE 60 Italy Digital Accessibility Software Market – Revenue Share By Type, 2026 |
  209. FIGURE 61 Italy Digital Accessibility Software Market – Revenue Share By Deployment Mode, 2026 |
  210. FIGURE 62 Italy Digital Accessibility Software Market – Revenue Share By Organization Size, 2026 |
  211. FIGURE 63 Italy Digital Accessibility Software Market – Revenue Share By End-User Industry, 2026 |
  212. FIGURE 64 Spain Digital Accessibility Software Market – Revenue Share By Type, 2026 |
  213. FIGURE 65 Spain Digital Accessibility Software Market – Revenue Share By Deployment Mode, 2026 |
  214. FIGURE 66 Spain Digital Accessibility Software Market – Revenue Share By Organization Size, 2026 |
  215. FIGURE 67 Spain Digital Accessibility Software Market – Revenue Share By End-User Industry, 2026 |
  216. FIGURE 68 Nordic Countries Digital Accessibility Software Market – Revenue Share By Type, 2026 |
  217. FIGURE 69 Nordic Countries Digital Accessibility Software Market – Revenue Share By Deployment Mode, 2026 |
  218. FIGURE 70 Nordic Countries Digital Accessibility Software Market – Revenue Share By Organization Size, 2026 |
  219. FIGURE 71 Nordic Countries Digital Accessibility Software Market – Revenue Share By End-User Industry, 2026 |
  220. FIGURE 72 Russia Digital Accessibility Software Market – Revenue Share By Type, 2026 |
  221. FIGURE 73 Russia Digital Accessibility Software Market – Revenue Share By Deployment Mode, 2026 |
  222. FIGURE 74 Russia Digital Accessibility Software Market – Revenue Share By Organization Size, 2026 |
  223. FIGURE 75 Russia Digital Accessibility Software Market – Revenue Share By End-User Industry, 2026 |
  224. FIGURE 76 Rest of Europe Digital Accessibility Software Market – Revenue Share By Type, 2026 |
  225. FIGURE 77 Rest of Europe Digital Accessibility Software Market – Revenue Share By Deployment Mode, 2026 |
  226. FIGURE 78 Rest of Europe Digital Accessibility Software Market – Revenue Share By Organization Size, 2026 |
  227. FIGURE 79 Rest of Europe Digital Accessibility Software Market – Revenue Share By End-User Industry, 2026 |
  228. FIGURE 80 China Digital Accessibility Software Market – Revenue Share By Type, 2026 |
  229. FIGURE 81 China Digital Accessibility Software Market – Revenue Share By Deployment Mode, 2026 |
  230. FIGURE 82 China Digital Accessibility Software Market – Revenue Share By Organization Size, 2026 |
  231. FIGURE 83 China Digital Accessibility Software Market – Revenue Share By End-User Industry, 2026 |
  232. FIGURE 84 India Digital Accessibility Software Market – Revenue Share By Type, 2026 |
  233. FIGURE 85 India Digital Accessibility Software Market – Revenue Share By Deployment Mode, 2026 |
  234. FIGURE 86 India Digital Accessibility Software Market – Revenue Share By Organization Size, 2026 |
  235. FIGURE 87 India Digital Accessibility Software Market – Revenue Share By End-User Industry, 2026 |
  236. FIGURE 88 Japan Digital Accessibility Software Market – Revenue Share By Type, 2026 |
  237. FIGURE 89 Japan Digital Accessibility Software Market – Revenue Share By Deployment Mode, 2026 |
  238. FIGURE 90 Japan Digital Accessibility Software Market – Revenue Share By Organization Size, 2026 |
  239. FIGURE 91 Japan Digital Accessibility Software Market – Revenue Share By End-User Industry, 2026 |
  240. FIGURE 92 South Korea Digital Accessibility Software Market – Revenue Share By Type, 2026 |
  241. FIGURE 93 South Korea Digital Accessibility Software Market – Revenue Share By Deployment Mode, 2026 |
  242. FIGURE 94 South Korea Digital Accessibility Software Market – Revenue Share By Organization Size, 2026 |
  243. FIGURE 95 South Korea Digital Accessibility Software Market – Revenue Share By End-User Industry, 2026 |
  244. FIGURE 96 ASEAN Digital Accessibility Software Market – Revenue Share By Type, 2026 |
  245. FIGURE 97 ASEAN Digital Accessibility Software Market – Revenue Share By Deployment Mode, 2026 |
  246. FIGURE 98 ASEAN Digital Accessibility Software Market – Revenue Share By Organization Size, 2026 |
  247. FIGURE 99 ASEAN Digital Accessibility Software Market – Revenue Share By End-User Industry, 2026 |
  248. FIGURE 100 Rest of Asia-Pacific Digital Accessibility Software Market – Revenue Share By Type, 2026 |
  249. FIGURE 101 Rest of Asia-Pacific Digital Accessibility Software Market – Revenue Share By Deployment Mode, 2026 |
  250. FIGURE 102 Rest of Asia-Pacific Digital Accessibility Software Market – Revenue Share By Organization Size, 2026 |
  251. FIGURE 103 Rest of Asia-Pacific Digital Accessibility Software Market – Revenue Share By End-User Industry, 2026 |
  252. FIGURE 104 Brazil Digital Accessibility Software Market – Revenue Share By Type, 2026 |
  253. FIGURE 105 Brazil Digital Accessibility Software Market – Revenue Share By Deployment Mode, 2026 |
  254. FIGURE 106 Brazil Digital Accessibility Software Market – Revenue Share By Organization Size, 2026 |
  255. FIGURE 107 Brazil Digital Accessibility Software Market – Revenue Share By End-User Industry, 2026 |
  256. FIGURE 108 Argentina Digital Accessibility Software Market – Revenue Share By Type, 2026 |
  257. FIGURE 109 Argentina Digital Accessibility Software Market – Revenue Share By Deployment Mode, 2026 |
  258. FIGURE 110 Argentina Digital Accessibility Software Market – Revenue Share By Organization Size, 2026 |
  259. FIGURE 111 Argentina Digital Accessibility Software Market – Revenue Share By End-User Industry, 2026 |
  260. FIGURE 112 Rest of South America Digital Accessibility Software Market – Revenue Share By Type, 2026 |
  261. FIGURE 113 Rest of South America Digital Accessibility Software Market – Revenue Share By Deployment Mode, 2026 |
  262. FIGURE 114 Rest of South America Digital Accessibility Software Market – Revenue Share By Organization Size, 2026 |
  263. FIGURE 115 Rest of South America Digital Accessibility Software Market – Revenue Share By End-User Industry, 2026 |
  264. FIGURE 116 Saudi Arabia Digital Accessibility Software Market – Revenue Share By Type, 2026 |
  265. FIGURE 117 Saudi Arabia Digital Accessibility Software Market – Revenue Share By Deployment Mode, 2026 |
  266. FIGURE 118 Saudi Arabia Digital Accessibility Software Market – Revenue Share By Organization Size, 2026 |
  267. FIGURE 119 Saudi Arabia Digital Accessibility Software Market – Revenue Share By End-User Industry, 2026 |
  268. FIGURE 120 UAE Digital Accessibility Software Market – Revenue Share By Type, 2026 |
  269. FIGURE 121 UAE Digital Accessibility Software Market – Revenue Share By Deployment Mode, 2026 |
  270. FIGURE 122 UAE Digital Accessibility Software Market – Revenue Share By Organization Size, 2026 |
  271. FIGURE 123 UAE Digital Accessibility Software Market – Revenue Share By End-User Industry, 2026 |
  272. FIGURE 124 South Africa Digital Accessibility Software Market – Revenue Share By Type, 2026 |
  273. FIGURE 125 South Africa Digital Accessibility Software Market – Revenue Share By Deployment Mode, 2026 |
  274. FIGURE 126 South Africa Digital Accessibility Software Market – Revenue Share By Organization Size, 2026 |
  275. FIGURE 127 South Africa Digital Accessibility Software Market – Revenue Share By End-User Industry, 2026 |
  276. FIGURE 128 Egypt Digital Accessibility Software Market – Revenue Share By Type, 2026 |
  277. FIGURE 129 Egypt Digital Accessibility Software Market – Revenue Share By Deployment Mode, 2026 |
  278. FIGURE 130 Egypt Digital Accessibility Software Market – Revenue Share By Organization Size, 2026 |
  279. FIGURE 131 Egypt Digital Accessibility Software Market – Revenue Share By End-User Industry, 2026 |
  280. FIGURE 132 Rest of MEA Digital Accessibility Software Market – Revenue Share By Type, 2026 |
  281. FIGURE 133 Rest of MEA Digital Accessibility Software Market – Revenue Share By Deployment Mode, 2026 |
  282. FIGURE 134 Rest of MEA Digital Accessibility Software Market – Revenue Share By Organization Size, 2026 |
  283. FIGURE 135 Rest of MEA Digital Accessibility Software Market – Revenue Share By End-User Industry, 2026

MARKET SEGMENTATION OVERVIEW

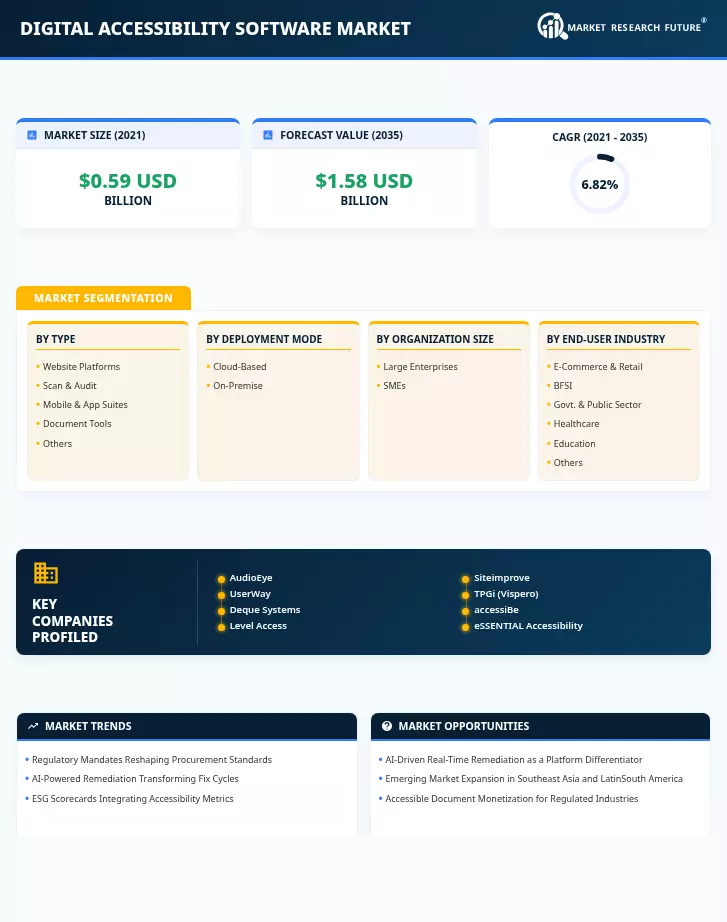
The global digital accessibility software market is analyzed across four primary segmentation dimensions. Each dimension reflects distinct demand drivers, regulatory treatment, and end-user requirements, enabling granular revenue forecasting and strategic positioning for market participants.

By Type

Sub-Segment Key Trend
Website Accessibility Platforms Core compliance layer; WCAG 2.2 overlay + code-level scanning
Automated Scan and Audit Tools CI/CD pipeline integration; AI-driven violation detection
Mobile and App Accessibility Suites Mobile-first mandates; EAA & GIGW app coverage
Document Accessibility Tools PDF/A remediation; enterprise document compliance
Others Video captioning, kiosk accessibility, IoT interfaces

Dominant Segment (2026): Website Accessibility Platforms (~38%) | Fastest Growing: Mobile & App Suites (7.92% CAGR)

By Deployment Mode

Sub-Segment Key Trend
Cloud-Based SaaS delivery; real-time updates; lower upfront cost
On-Premise Data sovereignty; defense/healthcare air-gapped networks

Dominant Segment (2026): Cloud-Based (~68%) | Fastest Growing: Cloud-Based (7.08% CAGR)

By Organization Size

Sub-Segment Key Trend
Large Enterprises Broadest regulatory surface; ESG reporting obligations
Small and Medium Enterprises Consumption-based pricing; litigation risk awareness

Dominant Segment (2026): Large Enterprises (~57%) | Fastest Growing: SMEs (7.08% CAGR)

By End-User Industry

Sub-Segment Key Trend
E-Commerce and Retail ADA litigation volume; checkout flow accessibility
BFSI Financial services accessibility regulations; WCAG mandates
Government and Public Sector Section 508; EU Accessibility Act; GIGW
Healthcare Patient portal compliance; HIPAA intersection
Education Section 504; accessible courseware & LMS platforms
Others Media, telecom, travel, hospitality

Dominant Segment (2026): E-Commerce & Retail (~24%) | Fastest Growing: Govt. & Public Sector (7.94% CAGR)

SEGMENTATION QUICK REFERENCE

Dimension Sub-Segments Dominant Segment (2026) Fastest Growing
Type Website Platforms · Scan & Audit · Mobile & App Suites · Document Tools · Others Website Platforms (~38%) Mobile & App Suites (7.92%)
Deployment Mode Cloud-Based · On-Premise Cloud-Based (~68%) Cloud-Based (7.08%)
Organization Size Large Enterprises · SMEs Large Enterprises (~57%) SMEs (7.08%)
End-User Industry E-Commerce & Retail · BFSI · Govt. & Public Sector · Healthcare · Education · Others E-Commerce & Retail (~24%) Govt. & Public Sector (7.94%)