Digital Therapeutics Market (2026 - 2035)

Digital Therapeutics Market Research Report By Application (Chronic Disease Management, Mental Health Disorders, Preventive Care, General Wellness), By Delivery Mode (Software, Device, Platform), By End User (Patients, Providers, Payers, Employers), By Therapeutic Area (Diabetes, Cardiology, Neurology, Oncology) and By Regional (North America, Europe, South America, Asia Pacific, Middle East and Africa) - Industry Forecast to 2035.
ID: MRFR/Pharma/5030-HCR
100 Pages
Rahul Gotadki, Vikita Thakur
Last Updated: July 15, 2026
Digital Therapeutics Market
Market Size
Forecast Period2026-2035
CAGR (2026-2035)23.1%
2026 Market SizeUSD 13.22 Billion
2035 Market SizeUSD 85.80 Billion
Key Players
Omada Health
Teladoc Health
Noom
Click Therapeutics
Akili Interactive
Better Therapeutics
Opportunities
  • Pharma Co-Prescription Bundling
  • Employer-Sponsored Behavioral Health Programs
  • Emerging-Market Leapfrog via Mobile-First Delivery

Digital Therapeutics Market Summary

The Digital Therapeutics Market reached USD 10.58 Billion in 2025 and is projected to climb from USD 13.22 Billion in 2026 to USD 85.80 Billion by 2035, expanding at a 23.1% CAGR during 2026–2035. Two catalysts anchor this trajectory: the U.S. FDA's continued refinement of its Pre-Cert framework, which compressed average review timelines by roughly 40% for qualifying software developers [1], and CMS's decision to assign dedicated reimbursement codes for select mental-health applications, unlocking an estimated USD 1.2 Billion in annual payer spend by 2027 [2]. Germany's Digital Healthcare Act (DiGA) added a European proof-point, with the BfArM approving more than 55 permanently listed applications by mid-2025 [3].

The transformation underway is structural. Legacy patient-education pamphlets, generic wellness apps, and one-size-fits-all behavioral programs are giving way to AI-driven, clinically validated software that adapts in real time to biometric and patient-reported data. Venture funding into the Digital Therapeutics Market topped USD 3.8 Billion cumulatively through 2024, with late-stage rounds increasingly led by pharma corporate-venture arms seeking pipeline-adjacent digital assets [4]. Adaptive algorithms now personalize dosing schedules, cognitive exercises, and motivational nudges, lifting 90-day retention rates above 60% in multiple randomized controlled trials [5].

North America commanded 49.3% of the Digital Therapeutics Market in 2025, supported by a favorable regulatory climate and deep commercial-payer infrastructure. Asia-Pacific is the fastest-growing region at a 25.2% CAGR, driven by smartphone penetration exceeding 80% across India, China, and Southeast Asia [6]. Europe held the second-largest share at 25.1%, with reimbursement-friendly frameworks in Germany, France, and Belgium accelerating clinical adoption. The next decade will hinge on how quickly payer systems worldwide move from pilot-stage coverage to routine formulary inclusion.


Key Report Takeaways

• By Product Type

  • Software-only platforms held a 75.2% share of the Digital Therapeutics Market in 2025, reflecting clinician preference for asset-light deployment models.
  • Virtual reality and gaming therapeutics are projected to expand at the fastest pace through 2035, fueled by immersive pain-management and rehabilitation protocols.

• By Therapeutic Area & Modality

  • Treatment applications captured the dominant position in the Digital Therapeutics Market, as chronic-condition management — particularly diabetes and substance-use disorders — attracted the largest clinical evidence base.
  • Drug–digital combination solutions are poised for the highest modality-level growth rate, with pharma companies pairing DTx modules alongside branded medications.

• By Region

  • North America generated nearly half of global revenue in 2025, with the United States accounting for the bulk of payer-reimbursed prescriptions.
  • Asia-Pacific's 25.2% CAGR positions it as the growth engine of the Digital Therapeutics Market through 2035, propelled by government digitization mandates in India and China.


Digital Therapeutics Market Size and Forecast (2021–2035)

Market Research Future's sizing model triangulates top-down payer-claims data with bottom-up vendor-revenue analysis, cross-validated against published regulatory filings and clinical-trial registries across 32 countries. Historical figures draw on audited company financials, while forecast projections apply a compound growth curve calibrated to reimbursement expansion and addressable-patient-pool penetration rates.
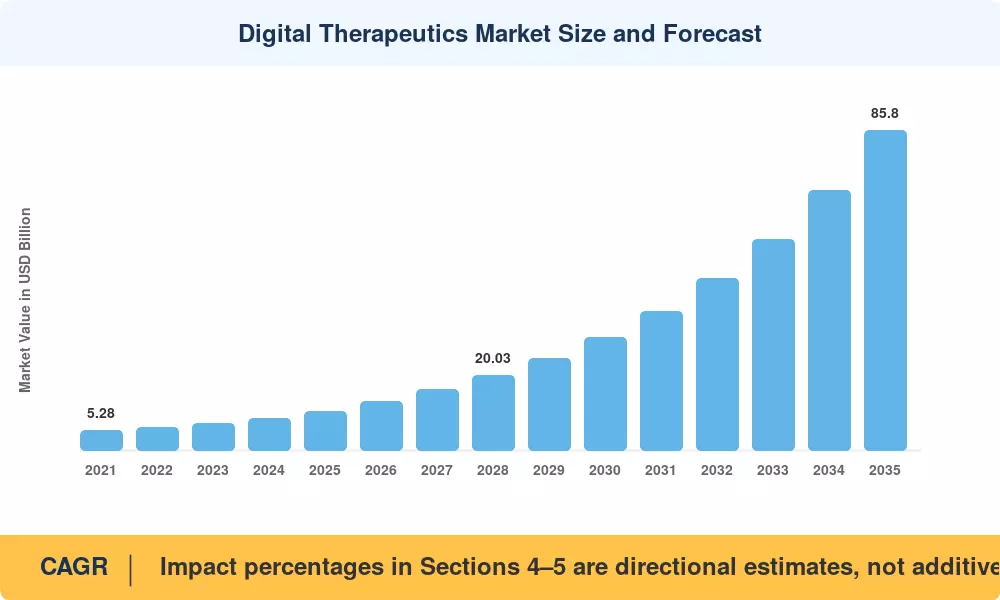
Digital Therapeutics Market Size and Forecast
Our Impact
Enabled $4.3B Revenue Impact for Fortune 500 and Leading Multinationals
Partnering with 2000+ Global Organizations Each Year
30K+ Citations by Top-Tier Firms in the Industry

Driver Impact Analysis

Driver ~% Impact on CAGR Geographic Relevance Impact Timeline
Regulatory harmonization (FDA, CMS, BfArM) 20–25% North America, Europe Short-term (≤2 yr)
AI-driven personalization and adaptive algorithms 15–20% Global Medium-term (2–4 yr)
Rising chronic-disease prevalence 15–18% Global Long-term (≥4 yr)
Payer reimbursement expansion 12–15% North America, Europe Short-term (≤2 yr)
Pharma–DTx co-development partnerships 10–14% North America, Asia-Pacific Medium-term (2–4 yr)
Mobile-infrastructure maturity in emerging markets 8–12% Asia-Pacific, South America Long-term (≥4 yr)
Employer-sponsored digital wellness mandates 5–8% North America Medium-term (2–4 yr)


Regulatory Harmonization Accelerates Commercial Certainty

The FDA's evolving De Novo and Pre-Cert pathways reduced median review time for software-only therapeutics to approximately 9 months by 2024, compared with 14 months in 2020 [1]. On the payer side, CMS assigned three new HCPCS codes specifically for digital behavioral-health interventions in January 2025, an action that health-economics analysts estimate could unlock USD 1.2 Billion in annual billable encounters by 2027 [2]. Germany's BfArM approved its 56th DiGA listing in Q2 2025, with France's HAS and Belgium's NIHDI piloting analogous fast-track evaluation frameworks [3]. This regulatory convergence gives developers a predictable pathway from clinical trial to revenue, shortening payback periods and attracting growth-stage capital into the Digital Therapeutics Market.

AI-Driven Personalization Lifts Engagement Metrics

Adaptive reinforcement-learning algorithms now adjust therapeutic content based on in-session biometric signals, mood self-reports, and medication-adherence patterns. A 2024 multi-site RCT published in The Lancet Digital Health demonstrated that AI-personalized cognitive-behavioral modules improved 12-week symptom reduction by 28% versus static content arms [5]. Several Class II-cleared platforms already integrate continuous-glucose-monitor feeds to tailor dietary coaching for pre-diabetic populations, and natural-language processing is enabling conversational agents that sustain daily user engagement above 65% at the 90-day mark [10]. These capabilities are central to the value proposition of the Digital Therapeutics Market as payers increasingly demand measurable clinical endpoints before approving formulary placement.

Chronic-Disease Burden Expands the Addressable Patient Pool

The International Diabetes Federation projects 643 million adults living with diabetes by 2030, while the WHO forecasts depression to become the leading global cause of disability-adjusted life years by 2031 [7]. Each condition represents a large, under-served population where pharmacotherapy alone has shown plateauing efficacy. The Digital Therapeutics Market directly addresses this gap by layering clinically validated behavioral and cognitive interventions on top of — or in place of — conventional drug regimens, particularly for conditions such as insomnia, substance-use disorder, and chronic musculoskeletal pain.


Restraints Impact Analysis

Restraint ~% Drag on CAGR Geographic Relevance Impact Timeline
Fragmented clinical-evidence standards across regulators –4 to –6% Global Medium-term
Low clinician awareness and prescribing inertia –3 to –5% Europe, South America Long-term
Data-privacy and cybersecurity concerns –3 to –4% Global Short-term
Reimbursement uncertainty in emerging markets –2 to –4% Asia-Pacific, MEA Long-term
Patient digital-literacy gaps and device access –2 to –3% South America, MEA Long-term


Fragmented Evidence Requirements Slow Global Scale-Up

Developers that want to reach more than one location sometimes have to do additional randomized controlled trials – or at least adjust study methods – to meet differing health-technology-assessment (HTA) requirements. While the FDA requires pivotal RCTs, the BfArM accepts preliminary evidence during the 12-month probationary listing, and the Japanese PMDA requires data from the Japanese patient population [11]. This fragmentation increases per-market entry costs by an estimated 30–40% and causes delays in time-to-revenue and discourages smaller innovators from pursuing multi-regional launches within the Digital Therapeutics Market [12].


Clinician Prescribing Inertia Limits Demand-Side Pull

In a 2024 poll by the American Medical Association, only 34% of U.S. primary-care physicians had prescribed a digital treatment, although 72% were generally favorable to software-based therapies [12]. The gap is due to a shortage of residency-level training in digital-health tools, fragmented EHR integration, and ambiguity over liability when algorithmic recommendations contribute to patient outcomes. Demand creation in the Digital Therapeutics Market will be heavily dependent on direct-to-consumer channels and employer wellness initiatives until digital prescribing is systematically addressed in medical education curriculum and continuing-education programs.


Digital Therapeutics Market Opportunities

Pharma Co-Prescription Bundling

Pharma companies are combining branded pharmaceuticals with companion digital modules at an increasing rate to differentiate from generics and extend margins from the patent era. This is evidenced by Novartis’s collaboration with a DTx developer for a heart-failure adherence app, and Sanofi’s work on a diabetes self-management platform, which are indicative of a structural move towards combination product dossiers submitted to regulators as unified therapy packages [8]. The expenses of the software are embedded into existing medication pricing systems, therefore boosting the Digital Therapeutics Market.


Employer-Sponsored Behavioral Health Programs

In 2024, U.S. employers paid USD 280 billion (USD 280 Billion) on productivity loss related to mental health [ 9 ]. Clinically approved digital programs for anxiety, sleeplessness and substance use are now being added to benefits packages by self-insured firms, frequently outside typical insurance formularies. This direct-procurement channel provides DTx developers with faster sales cycles and consistent per-employee-per-month pricing, increasing the Digital Therapeutics Market beyond clinical settings.


Emerging-Market Leapfrog via Mobile-First Delivery

India's Ayushman Bharat Digital Mission and Indonesia's Satu Sehat platform are building national health-data rails that can host DTx applications at a population scale [6]. With smartphone penetration in Southeast Asia exceeding 78% and broadband costs falling below USD 2 per GB, emerging markets can bypass legacy clinic-based delivery entirely. The opportunity for the Digital Therapeutics Market is particularly acute in chronic-disease management, where specialist-to-patient ratios remain critically low.

Real-World Data Monetization and Outcomes-Based Contracts

DTx platforms generate continuous, longitudinal patient data that pharmaceutical companies, CROs, and payers find valuable for post-market surveillance and health-economics studies. Anonymized, aggregated datasets can support outcomes-based pricing agreements — where reimbursement scales with demonstrated clinical improvement — creating a secondary revenue stream for developers within the Digital Therapeutics Market.

Pediatric and Adolescent Therapeutic Expansion

FDA's 2024 clearance of attention-deficit-focused gaming therapeutics for children aged 8–17 opened a largely untapped pediatric segment. Child and adolescent mental-health demand surged post-pandemic, yet specialist availability remains constrained. Age-appropriate digital interventions offer scalable access, and early-mover developers in this niche can establish brand loyalty and payer relationships that extend into adult populations.


Digital Therapeutics Market Future Outlook

AI-Powered Autonomous Care Loops

By 2030, the Digital Therapeutics Market will increasingly feature closed-loop systems where wearable-sensor data feeds directly into adaptive algorithms that modify therapeutic content without clinician intervention between visits. The WHO estimates that AI-augmented digital health tools could avert 2.4 million premature deaths annually by 2035 in low- and middle-income countries alone [21]. Regulatory bodies are already drafting guidance for "predetermined change-control plans" that allow post-clearance algorithm updates, fundamentally altering the software lifecycle.

Platform Economics and Therapeutic Marketplaces

Health systems will shift from procuring individual DTx products to subscribing to curated therapeutic marketplaces — integrated platforms offering condition-specific modules under a single EHR integration. This platform model mirrors enterprise-software dynamics, where customer-acquisition costs drop with each added therapeutic area. By 2032, Market Research Future projects that platform-based DTx subscriptions will represent a substantial share of total Digital Therapeutics Market revenue, compressing margins for single-product developers.

Decentralized Clinical Trials and Continuous Evidence Generation

The next decade will see the Digital Therapeutics Market evolve from episodic RCT-based evidence toward continuous real-world evidence generation. Decentralized trial designs — where the therapeutic itself collects endpoint data — can cut Phase III costs by an estimated 35–45% [22]. Regulators in the U.S., EU, and Japan are actively publishing frameworks for using real-world data to support label expansions, creating a virtuous cycle where post-market data strengthens both clinical claims and payer negotiations.

ESG, Health Equity, and Value-Based Care Alignment

As ESG reporting frameworks mature, health-system purchasers and insurers will evaluate DTx vendors on accessibility metrics: language localization, offline functionality, and ADA/WCAG compliance. The Digital Therapeutics Market is well-positioned to align with value-based care mandates because software-based delivery inherently scales to underserved populations at a lower marginal cost than facility-based care. The IEA-equivalent for healthcare — the WHO's UHC monitoring framework — projects that digital-health tools will be embedded in 80% of national essential-health-service packages by 2035 [23].


Digital Therapeutics Market Segmentation

By Product Type

Segment Key Metric Primary Demand Driver
Software-Only Digital Therapeutics 75.2% share (2025) Asset-light deployment, rapid regulatory clearance
Connected Devices USD 1.62 Billion (2025) Chronic-care monitoring, biometric integration
Virtual Reality & Gaming Solutions 25.8% CAGR (2026–2035) Pain management, neurorehabilitation


Software-only platforms dominate the Digital Therapeutics Market because they require no proprietary hardware, reducing per-patient deployment costs and enabling rapid scaling through app-store distribution. Clinicians favor these platforms for behavioral-health conditions — insomnia, substance-use disorder, anxiety — where cognitive-behavioral protocols can be fully digitized. Connected-device solutions, by contrast, pair software with glucose monitors, blood-pressure cuffs, or wearable sensors and command premium pricing justified by continuous physiological data streams.

Virtual reality and gaming therapeutics are the fastest-growing product category, driven by FDA-cleared attention-deficit interventions for pediatric populations and immersive pain-distraction modules reducing opioid reliance in post-surgical care [10]. Development costs remain higher due to 3D-content creation, but reimbursement rates per session also exceed those of text-based modules.

By Therapeutic Area

Segment Key Metric Primary Demand Driver
Treatment 77.6% share (2025) Chronic-disease management, clinical-evidence depth
Preventive 25.1% CAGR (2026–2035) Pre-diabetes intervention, employer wellness


Treatment applications anchor the Digital Therapeutics Market, with diabetes management, substance-use disorder, and insomnia representing the three largest indication areas by revenue. Payers prioritize treatment modules because they produce quantifiable outcomes — HbA1c reduction, abstinence rates, sleep-quality scores — that map directly to cost-savings calculations. Preventive solutions, while currently smaller, are growing faster as employers and public-health agencies invest in pre-disease interception programs targeting metabolic syndrome and behavioral-health risk factors.

By Modality

Segment Key Metric Primary Demand Driver
Standalone Prescription DTx 65.2% share (2025) Regulatory clarity, independent clinical evidence
DTx + Drug Combination 24.1% CAGR (2026–2035) Pharma co-development, differentiated labeling
Over-the-Counter / Wellness USD 1.94 Billion (2025) Direct-to-consumer distribution, low regulatory friction


Standalone prescription solutions lead the Digital Therapeutics Market in revenue share because they follow well-established regulatory approval pathways and generate independent health-economics evidence that payers can evaluate using familiar HTA methodologies. Drug–digital combinations represent the fastest-growing modality as pharmaceutical firms seek to extend brand value by pairing medications with companion software that improves adherence and tracks patient-reported outcomes.

By End User

Segment Key Metric Primary Demand Driver
Direct-to-Consumer (Patients) 52.4% share (2025) App-store accessibility, self-pay and employer-funded
Providers / Hospitals USD 2.58 Billion (2025) EHR integration, clinical-workflow embedding
Payers / Insurers 23.8% CAGR (2026–2035) Reimbursement code expansion, cost-containment objectives


Direct-to-consumer channels currently generate the largest share of the Digital Therapeutics Market revenue because many commercially available applications — particularly for weight management, stress reduction, and sleep improvement — operate outside traditional prescription frameworks. Payers and insurers, however, represent the fastest-growing end-user segment as Medicare, Medicaid, and commercial plans expand formulary coverage for FDA-cleared products, converting what were once out-of-pocket expenses into covered benefits.


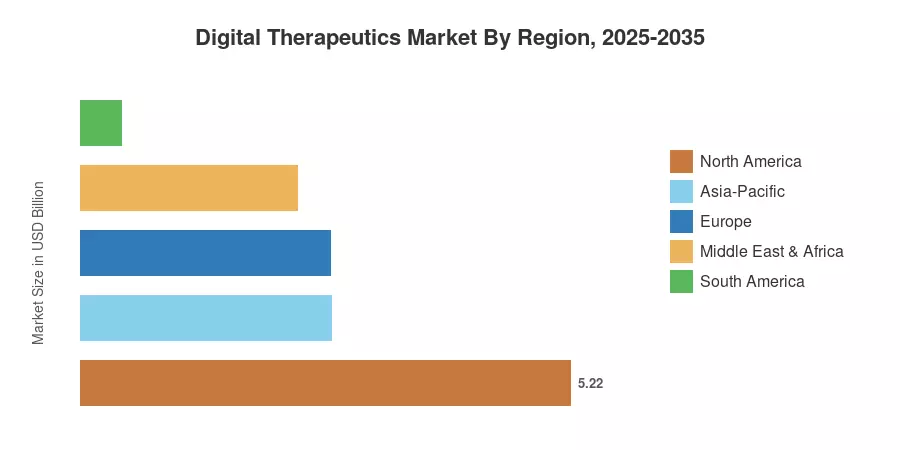
Regional Market Share Analysis

Region Key Metric Primary Investment Themes
North America 49.3% share (2025) Payer reimbursement codes, FDA pathway clarity
Europe 25.1% share (2025) DiGA framework, HTA cross-border pilots
Asia-Pacific 25.2% CAGR (2026–2035) Mobile-first delivery, government digitization
South America USD 0.44 Billion (2025) Telehealth integration, employer wellness
Middle East & Africa 21.8% CAGR (2026–2035) Gulf sovereign health-tech funds, mobile uptake
Total USD 10.58 Billion (2025)

The Digital Therapeutics Market displays pronounced geographic asymmetry: regulatory maturity and payer infrastructure in North America and Europe concentrate the majority of current revenue, while demographic scale and mobile adoption rates position Asia-Pacific as the primary future growth corridor.


North America

Country Key Metric Key Driver
United States 84.5% of regional revenue CMS reimbursement codes, commercial-payer adoption
Canada 10.8% of regional revenue Provincial digital-health pilots (Ontario, BC)
Mexico 22.4% CAGR Telehealth regulatory reforms, smartphone growth


The United States remains the epicenter of the Digital Therapeutics Market, accounting for over four-fifths of North American revenue. CMS's 2025 reimbursement expansion and the presence of multiple FDA-cleared DTx products create a self-reinforcing adoption loop: clinical evidence begets payer coverage, which begets prescriber confidence. Canada is scaling provincial pilots that embed digital interventions into chronic-care pathways, while Mexico's 2024 telehealth regulatory update broadened the legal basis for remote digital prescriptions [2][16].

Europe

Country Key Metric Key Driver
Germany 34.8% of regional revenue DiGA permanent listings, statutory health-insurance coverage
United Kingdom 22.1% CAGR NHS digital formulary, NICE evidence reviews
France 18.4% of regional revenue HAS pilot evaluations, hospital-system integration
Italy 15.2% of regional revenue Piano Nazionale di Ripresa e Resilienza digital-health funding
Spain 20.9% CAGR Regional health-system digitization
Nordic Countries USD 0.21 Billion (2025) High digital literacy, universal coverage models
Russia 19.6% CAGR Telemedicine federal law amendments
Rest of Europe USD 0.18 Billion (2025) Varied regulatory readiness


Germany's DiGA framework makes it the benchmark jurisdiction for DTx reimbursement in Europe, with statutory health-insurance funds covering approved applications within weeks of BfArM listing [3]. The UK's NHS is building a dedicated digital-therapeutics formulary within its App Library, guided by NICE evidence-standard reviews, and France's HAS launched a fast-track digital-health evaluation pilot in late 2024 [17]. These parallel efforts are strengthening the Digital Therapeutics Market across the continent and encouraging cross-border evidence-portability discussions at the EU level.

Asia-Pacific

Country Key Metric Key Driver
China 32.6% of regional revenue NMPA digital-health regulations, chronic-disease burden
India 27.3% CAGR Ayushman Bharat Digital Mission, low-cost smartphone ecosystem
Japan 21.5% of regional revenue PMDA SaMD approvals, aging population
South Korea 24.8% CAGR K-DiGA framework under development
ASEAN 26.1% CAGR Mobile-first populations, telehealth adoption
Rest of Asia-Pacific USD 0.09 Billion (2025) Early-stage digital-health policies


Asia-Pacific's trajectory within the Digital Therapeutics Market is shaped by the intersection of massive chronic-disease populations and rapidly maturing digital infrastructure. China's NMPA issued its first batch of software-as-a-medical-device registrations in 2024, while India's CDSCO circulated draft classification rules that would create a tiered risk-based approval pathway for digital therapeutics [6]. Japan's PMDA has already approved multiple SaMD products for nicotine dependence and hypertension, and South Korea's Ministry of Health is actively modeling its own "K-DiGA" program on Germany's approach [18].

South America

Country Key Metric Key Driver
Brazil 62.4% of regional revenue ANVISA digital-health sandbox, SUS integration pilots
Argentina 21.7% CAGR Telehealth legislation, private-payer interest
Rest of South America USD 0.08 Billion (2025) Nascent regulatory frameworks


Brazil dominates the South American segment of the Digital Therapeutics Market, with ANVISA operating a regulatory sandbox for digital-health innovations since 2023 and the public SUS system piloting DTx for diabetes management in São Paulo and Minas Gerais [19]. Argentina's 2024 telehealth law created a legal footing for remote digital prescriptions, though reimbursement pathways remain under development.

Middle East & Africa

Country Key Metric Key Driver
Saudi Arabia 31.2% of regional revenue Vision 2030 health-tech investment
UAE 27.5% of regional revenue DHA digital-health licensing, smart-city integration
South Africa 22.3% CAGR mHealth chronic-care programs
Egypt 20.6% CAGR National digital-transformation strategy
Rest of MEA USD 0.05 Billion (2025) Early-stage adoption


Gulf Cooperation Council states are channeling sovereign-wealth capital into health-technology ventures, with Saudi Arabia's Vision 2030 earmarking USD 4.5 Billion for digital-health infrastructure through 2030 [20]. The UAE's Dubai Health Authority introduced a dedicated licensing category for digital therapeutics in 2024. In Sub-Saharan Africa, mobile-health chronic-care programs — particularly for HIV adherence and diabetes — offer a stepping-stone pathway for DTx platforms entering the Digital Therapeutics Market.


Digital Therapeutics Market By Region, 2025-2035

Competitive Benchmarking

The Digital Therapeutics Market exhibits medium concentration, with the top five companies holding an estimated 30–38% combined revenue share. The Herfindahl-Hirschman Index sits in the low-to-moderate range, reflecting a field where venture-backed specialists coexist with large health-technology incumbents and pharma-backed DTx spin-offs. Competitive differentiation hinges on clinical-evidence depth, therapeutic breadth, payer-contracting capabilities, and EHR-integration maturity.

Company Est. Revenue Share Range Key Offerings for Digital Therapeutics Market Strategic Positioning
Omada Health ~7–10% Diabetes prevention, musculoskeletal, behavioral health Employer-channel leader with multi-condition platform
Teladoc Health (Livongo) ~6–9% Chronic-condition management, diabetes, hypertension Integrated virtual-care and DTx ecosystem
Noom ~5–8% Weight management, diabetes prevention, anxiety Consumer brand with clinical-grade programs
Click Therapeutics ~4–7% Smoking cessation, insomnia, oncology supportive care Pharma co-development partnerships (Otsuka)
Akili Interactive ~3–6% Pediatric ADHD gaming therapeutic (EndeavorRx) First FDA-cleared prescription video game
Better Therapeutics ~3–5% Cardiometabolic disease, type 2 diabetes FDA-cleared CBT-based liver and cardio modules
Virta Health ~3–5% Type 2 diabetes reversal, nutritional ketosis Outcomes-based pricing tied to HbA1c reduction
Voluntis ~2–4% Oncology supportive care, diabetes insulin titration EU-focused, CE-marked companion software
WellDoc ~2–4% BlueStar diabetes management platform Payer-contracted, FDA-cleared chronic-care tool
Happify Health (Twill) ~2–4% Mental health, stress management, employer wellness AI-driven emotional-health platform


Recent News & Developments


  • CMS (January 2025): Finalized three new HCPCS reimbursement codes for digital behavioral-health interventions, marking the broadest U.S. payer-access expansion for the Digital Therapeutics Market to date [2].
  • Akili Interactive (November 2024): Launched a direct-to-consumer version of its ADHD gaming therapeutic following FDA guidance allowing non-prescription digital access for adult populations [10].


  • Better Therapeutics (October 2023): Completed a pivotal trial demonstrating clinically significant HbA1c reduction through its CBT-based digital therapeutic for type 2 diabetes [5].


Digital Therapeutics Market Report Scope

Parameter Detail
Market Scope Global Digital Therapeutics Market across product type, therapeutic area, modality, end user, and geography
Study Period 2021–2035
CAGR (2026–2035) 23.1%
Base Year 2025 — USD 10.58 Billion
2026 Forecast Starting Value USD 13.22 Billion
2035 Forecast Endpoint USD 85.80 Billion
Fastest Growing Segments Virtual Reality & Gaming (product type); Preventive (therapeutic area); Asia-Pacific (region)
Companies Profiled 10 (Omada Health, Teladoc Health, Noom, Click Therapeutics, Akili Interactive, Better Therapeutics, Virta Health, Voluntis, WellDoc, Happify Health)
Valuation Currency USD Billion
CAGR Driver Disclaimer Impact percentages in Sections 4–5 are directional estimates, not additive components of CAGR


FAQs

How should hospital procurement teams evaluate DTx vendors before signing enterprise contracts?
Prioritize vendors with at least two FDA-cleared or CE-marked products, documented EHR-integration APIs, and outcomes-based pricing options. Request published RCT data and payer-contracting references [12].
What liability exposure do prescribing physicians face when recommending a digital therapeutic?
Liability frameworks remain jurisdiction-specific, but FDA clearance shifts substantial product-liability risk to the manufacturer. Physicians should document prescribing rationale and monitor patient-reported outcomes [11].
How do DTx reimbursement rates compare with traditional cognitive-behavioral therapy sessions?
Reimbursement per episode typically ranges from USD 300 to USD 1,500, compared with USD 150–250 per in-person CBT session, though DTx rates bundle multi-week programs into a single payment [2].
What interoperability standards should health systems require from DTx platforms?
Require HL7 FHIR R4 compatibility, SMART on FHIR launch capability, and bidirectional data exchange with major EHR systems like Epic and Cerner [16].
How are DTx developers addressing patient attrition beyond the first 30 days?
Leading platforms deploy adaptive engagement engines that vary content difficulty, notification timing, and reward structures based on real-time usage patterns, lifting 90-day retention above 60% [5].
What role do companion diagnostics play in DTx personalization?
Companion biomarkers — such as continuous glucose readings or actigraphy sleep data — enable real-time algorithm adjustments that improve therapeutic precision and support outcomes-based payer contracts [10].
Can DTx platforms operate effectively in low-bandwidth environments below 3G connectivity?
Several platforms now offer offline-capable modules that sync data when connectivity resumes, enabling deployment in rural and low-infrastructure settings across Asia-Pacific and Africa [15].    
Author
Author
Author Profile
Rahul Gotadki LinkedIn
Research Manager
He holds an experience of about 9+ years in Market Research and Business Consulting, working under the spectrum of Life Sciences and Healthcare domains. Rahul conceptualizes and implements a scalable business strategy and provides strategic leadership to the clients. His expertise lies in market estimation, competitive intelligence, pipeline analysis, customer assessment, etc.
Co-Author
Co-Author Profile
Vikita Thakur LinkedIn
Senior Research Analyst
She holds an experience of about 5+ years in market research and business consulting projects for sectors such as life sciences, medical devices, and healthcare IT. She possesses a robust background in data analysis, market estimation, competitive intelligence, pipeline analysis market trend identification, and consumer behavior insights. Her expertise lies in technical Sales support, client interaction and project management, designing and implementing market research studies, conducting competitive analysis, and synthesizing complex data into actionable recommendations that drive business growth.

Research Approach


Secondary Research

The secondary research process involved comprehensive analysis of regulatory databases, peer-reviewed clinical journals, digital health publications, and authoritative healthcare organizations. Key sources included the US Food & Drug Administration (FDA) Digital Health Center of Excellence, European Medicines Agency (EMA) Digital Health and Data Steering Group, Health Canada Bureau of Medical Devices (Software as Medical Device guidance), Therapeutic Goods Administration (TGA) Australia (Digital Health Technologies), NHS England Digital Technology Assessment Criteria (DTAC), Centers for Medicare & Medicaid Services (CMS) Digital Health Policies, National Institutes of Health (NIH) National Library of Medicine, ClinicalTrials.gov Registry, World Health Organization (WHO) Global Strategy on Digital Health, OECD Health Statistics, Digital Therapeutics Alliance (DTA) Industry Reports, Healthcare Information and Management Systems Society (HIMSS) Analytics, CDC National Center for Health Statistics (Chronic Disease Data), and national digital health ministry reports from key markets including Germany's BfArM (Digital Health Applications - DiGA), Japan's Ministry of Health (Digital Therapeutics Sandbox), and Singapore's Health Sciences Authority. These sources were used to collect regulatory approval pathways (510(k), De Novo, CE mark for SaMD), clinical validation studies, reimbursement coverage decisions, patient enrollment statistics, chronic disease epidemiology data, and competitive landscape analysis for prescription digital therapeutics (PDTs) and non-prescription digital health solutions.


Primary Research

To gather both qualitative and quantitative insights, supply-side and demand-side stakeholders were interviewed during the primary research phase. CEOs, VPs of clinical affairs, heads of regulatory strategy, and commercial directors from companies that produce digital therapeutics, software-as-medical-device (SaMD) manufacturers, and digital health platforms were examples of supply-side sources. Chief medical officers and digital health leads from payer organizations (insurance/Medicare Advantage), administrators of health systems, clinical directors from departments of diabetes, cardiology, and neurology, behavioral health specialists, pharmacy benefit managers, and representatives of patient advocacy groups were among the demand-side sources. Primary research verified FDA/EMA clearance timelines, validated therapeutic area segmentation, and collected information on formulary inclusion strategies, clinical adoption barriers, value-based versus subscription pricing and reimbursement models, and patient adherence metrics across B2B and B2C delivery channels.

Primary Respondent Breakdown:

By Designation: C-level Primaries (32%), Director Level (30%), Others (38%)

By Region: North America (38%), Europe (25%), Asia-Pacific (28%), Rest of World (9%)


Market Size Estimation

Global market valuation was derived through revenue mapping and patient enrollment volume analysis. The methodology included:

Identification of 50+ key digital therapeutics developers and platform providers across North America, Europe, Asia-Pacific, and Latin America

Product mapping across therapeutic areas including diabetes management, mental health/behavioral disorders (ADHD, depression, substance use), cardiovascular disease, respiratory conditions (COPD, asthma), and neurological disorders

Segmentation by delivery mode (standalone software applications, device-integrated solutions, enterprise platforms) and end-user category (healthcare providers, payers, employers, direct-to-consumer)

Analysis of reported and modeled annual revenues specific to digital therapeutic portfolios, including prescription (PDT) and non-prescription wellness revenues

Coverage of developers representing 75-80% of global market share in 2024

Extrapolation using bottom-up (patient enrollment volumes × average revenue per user by therapeutic area and geography) and top-down (manufacturer revenue validation and payer spend analysis) approaches to derive segment-specific valuations for chronic disease management, mental health, preventive care, and general wellness applications

Download Free Sample

Kindly complete the form below to receive a free sample of this Report

Download PDF ×

We do not share your information with anyone. However, we may send you emails based on your report interest from time to time. You may contact us at any time to opt-out.
















