Digital Pathology Market (2026 - 2035)

Digital Pathology Market Research Report: Size, Share, Trend Analysis By Technology (Whole Slide Imaging, Virtual Microscopy, Artificial Intelligence), By Applications (Cancer Diagnosis, Research and Development, Education), By End Users (Hospitals, Diagnostic Laboratories, Research Institutes), By Component (Software, Hardware, Services) and By Regional (North America, Europe, South America, Asia Pacific, Middle East and Africa)- Industry Forecast to 2035

Forecast Period
2026-2035
CAGR
10.4%
2025 Market Size
USD 1.96 Billion
2035 Market Size
USD 5.23 Billion
Medical Device ● Updated August 24, 2026 Report ID: MRFR/MED/1423-CR | Pages: 90 | Author: Satyendra Maurya, Rahul Gotadki

Digital Pathology Market Summary

The Digital Pathology Market closed 2025 at USD 1.96 billion and opens the forecast window at USD 2.15 billion in 2026, expanding to USD 5.23 billion by 2035 at a 10.4% CAGR. Two catalysts explain the acceleration. Regulators cleared several whole-slide imaging platforms for primary diagnosis rather than adjunctive review, removing the compliance ambiguity that stalled procurement for a decade [2]. Alongside that, the National Institutes of Health committed USD 150 million through its Bridge2AI program in 2025 to validate pathology algorithms against curated, bias-audited datasets [3].

Laboratories are retiring a workflow that has barely changed since the 1890s. Glass slides, courier bags and physical microscope stations are giving way to scanner farms, DICOM-native image archives and viewer software that sits inside the laboratory information system. Danaher, Roche and Philips have each redirected material R&D budget toward this transition, and vendors now bundle software subscriptions with hardware rather than selling one-time capital equipment — a shift that lets laboratories fund the Digital Pathology Market transition from operating rather than capital budgets [7].

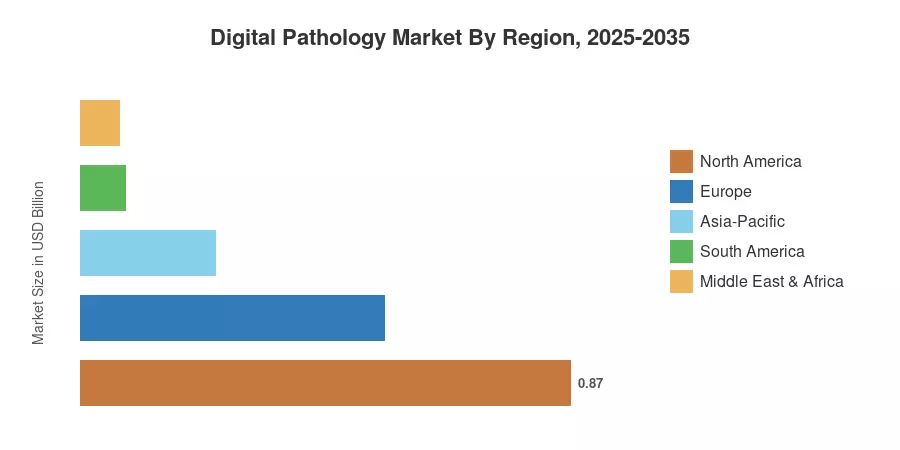
Geographically, North America holds 44.5% of 2025 revenue, supported by dedicated CPT reimbursement codes and the deepest installed scanner base [4]. Asia-Pacific grows fastest at a 12.0% CAGR as China and India digitise tertiary hospital networks. Europe ranks second with USD 0.54 billion in 2025, driven by national screening programmes and centralised pathology hubs in the Nordics and the United Kingdom. Through 2035, the Digital Pathology Market will be shaped less by scanner throughput and more by who controls the image archive.


Key Report Takeaways

• By Product

  • Whole Slide Imaging Scanners held 40.5% of Digital Pathology Market revenue in 2025
  • Image Analysis & AI Software is forecast to grow at a 10.9% CAGR through 2035
  • Information Management Systems generated USD 0.24 billion in 2025

• By Sector

  • Disease Diagnosis captured 52.7% of application revenue in 2025
  • Telepathology & Consultation is advancing at an 11.1% CAGR


• By Region

  • North America commanded 44.5% of the Digital Pathology Market in 2025
  • Asia-Pacific is set to post a 12.0% CAGR to 2035
  • Europe contributed USD 0.54 billion in 2025


Market Size and Forecast (2021–2035)

Figures below blend vendor-reported instrument shipments, laboratory capital procurement disclosures, reimbursement claim volumes and primary interviews with pathology department heads across 14 countries. Historical values are reconciled against public filings from Danaher, Roche, Philips and Hamamatsu; forecast values apply installed-base modelling with attach rates for software and storage. The Digital Pathology Market series below is expressed in USD billion throughout.
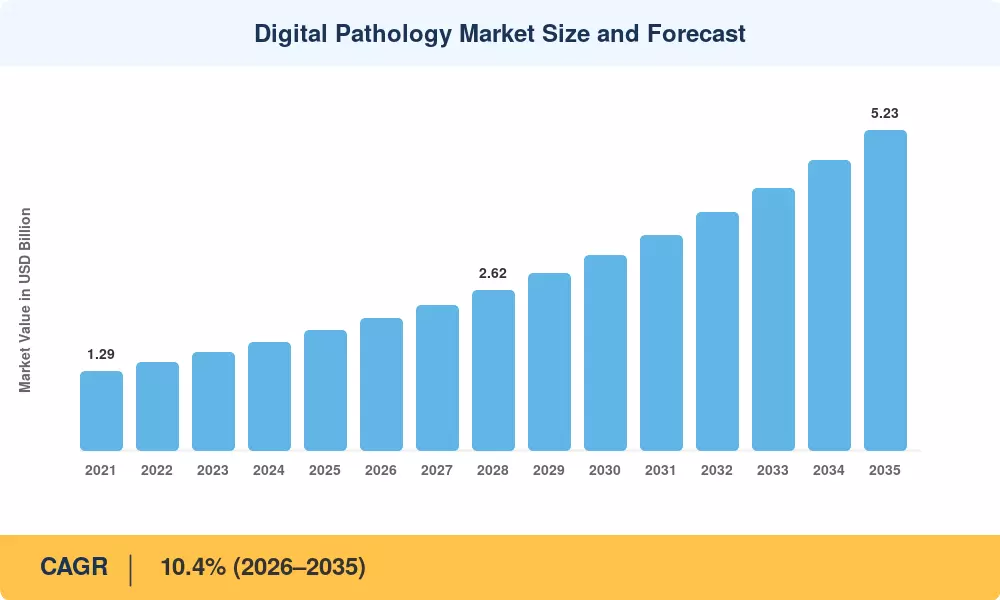
Digital Pathology Market Size and Forecast
Our Impact
Enabled $4.3B Revenue Impact for Fortune 500 and Leading Multinationals
Partnering with 2000+ Global Organizations Each Year
30K+ Citations by Top-Tier Firms in the Industry

Driver Impact Analysis

Driver ~% Impact on CAGR Geographic Relevance Impact Timeline
Pathologist shortage and workload compression +2.1 pp Global; acute in US, UK, Japan Medium-term (2–4 yr)
Regulatory clearance for primary diagnosis +1.8 pp North America, Europe Short-term (≤2 yr)
Public AI validation funding (Bridge2AI) +1.6 pp North America Medium-term (2–4 yr)
Reimbursement codes for remote consultation +1.4 pp United States Short-term (≤2 yr)
Pharma demand for image-based endpoints +1.3 pp Global Medium-term (2–4 yr)
Spatial-omics and multiplex fluorescence +1.1 pp US, Germany, Japan Long-term (≥4 yr)
Subscription pricing shifting capex to opex +0.9 pp Global Long-term (≥4 yr)


Pathologist Shortage Forces Structural Change

Diagnostic volume is rising while the workforce shrinks. The Royal College of Pathologists reported that only 3% of United Kingdom histopathology departments had enough staff to meet clinical demand, with vacancy rates near 25% across the network [1]. United States residency output has stayed roughly flat since 2010 even as biopsy volumes climbed. Digitisation is the only lever that redistributes work without adding headcount, letting a subspecialist in one city sign out cases queued in another. That workload arbitrage is the single strongest demand signal in the Digital Pathology Market.

Regulatory Clearance Removed the Procurement Blocker

Before primary-diagnosis clearance, hospitals could digitise but still had to keep a microscope in the loop, which destroyed the business case. Successive clearances for whole-slide imaging systems changed that calculus outright [2]. Chief pathologists can now retire glass review for cleared indications, and capital committees will fund a project that eliminates duplicated effort rather than adding a parallel process.

Reimbursement Turned Telepathology Into Revenue

Dedicated procedure codes for digitised specimen consultation began compensating remote review in the United States, converting a cost centre into a billable service line [4]. Reference laboratories responded quickly, marketing subspecialty second opinions to community hospitals that cannot justify a resident expert. The effect is measurable in scanner utilisation, which vendors report has risen from roughly 40 slides per hour to sustained multi-shift operation at high-volume sites.

Pharmaceutical Sponsors Demand Image-Based Endpoints

Trial sponsors increasingly write quantitative image endpoints into protocols because manual scoring introduces inter-reader variance that inflates required sample sizes. Companion diagnostic submissions now routinely include algorithm-derived scoring, and contract research organisations have built dedicated digital reading facilities to service them [5]. This channel carries higher software attach rates than hospital deployments and is the primary reason pharmaceutical end users outgrow clinical laboratories.


Restraints Impact Analysis

Restraint weightings follow the same directional convention as Section 4 — they indicate relative drag on growth, not deductions applied sequentially to the headline rate. Several restraints are concentrated in specific geographies and will ease as standards mature.

Restraint ~% Impact on CAGR Geographic Relevance Impact Timeline
Scanner plus storage capital intensity −1.7 pp Global; acute in South America, MEA Medium-term (2–4 yr)
Petabyte-scale storage and bandwidth cost −1.3 pp Global Long-term (≥4 yr)
Fragmented AI software-as-medical-device pathways −1.1 pp Europe, Asia-Pacific Medium-term (2–4 yr)
Interoperability gaps between viewers and LIS −0.9 pp Global Short-term (≤2 yr)
Validation burden and clinician change management −0.7 pp North America, Europe Short-term (≤2 yr)


Total Cost of Ownership Exceeds the Sticker Price

Scanners are the visible expense; infrastructure is the real one. A mid-sized laboratory producing 300,000 slides annually generates roughly 300 terabytes of uncompressed image data each year, and retention mandates in several jurisdictions run to ten years [9]. Network upgrades, redundant archives and integration engineering routinely add 60–90% on top of instrument capex [8]. Finance committees that model only the scanner underestimate the programme and stall it at pilot stage.

Regulatory Fragmentation Slows Software Rollout

Algorithms cleared in one jurisdiction cannot simply cross borders. The European Union's Medical Device Regulation and the AI Act impose separate conformity assessment tracks, while national authorities in Asia-Pacific apply divergent evidence standards [10]. Vendors therefore sequence launches country by country, delaying revenue recognition and forcing multinational laboratory groups to run mixed software estates.

Interoperability Remains an Unsolved Engineering Problem

Proprietary image formats persist despite the DICOM working group's whole-slide supplement, and viewers frequently cannot render a competitor's files without conversion [11]. Laboratories that bought two scanner brands often maintain two archives. Until format neutrality becomes a tender requirement, switching costs will suppress competitive pressure and slow refresh cycles.


Digital Pathology Market Opportunities

Subscription and Per-Slide Pricing Models

By pricing by scanned slide rather than by instrument vendors match their revenue to laboratory throughput and remove the capital hurdle altogether. Early adopters have shorter sales cycles and dramatically greater software attach rates [7]. This methodology also allows suppliers regular visibility that helps speed up product iteration.


Archive Monetisation and Real-World Evidence

Curated, de-identified image archives linked to outcomes data are becoming a licensable asset for drug discovery teams. Health systems that negotiate revenue sharing over one-time data transfer gain lasting upside. Several academic centers have previously built such arrangements around biobank collections [14]. It’s governance maturity, not data volume, that defines who wins here.


Emerging-Market Hub-and-Spoke Networks

In countries with less than one pathologist per 500,000 population, district hospitals cannot be staffed normally. Centralized scanning hubs for spoke facilities mean that a single national reading center can cover an entire province, and development finance institutions have begun subsidizing these installations in Africa and Southeast Asia [18]. Vendors providing leasing + local field engineering will get a disproportionate share.


Spatial Biology Convergence

Adding proteomic and transcriptomic layers to morphology pushes scanner specs beyond brightfield and increases average selling prices [6]. The initial wave is funded by research resources, but clinical translation in oncology is now close enough that platform suppliers are building upgrade routes. The Digital Pathology Market is positioned for a second hardware cycle after 2030.


Education and Competency Assessment

Virtual microscopy pathology curricula let institutions retire teaching-set glass slides that degrade and cannot be shared. Board examinations in several countries have already migrated to digital case delivery, creating a low-regulatory-risk entry point for vendors seeking reference accounts [15].


Digital Pathology Market Future Outlook

Algorithms Move From Triage to Autonomy

Current deployments use software to pre-screen, flag and quantify while a pathologist signs out every case. The next decade shifts specific low-complexity, high-volume tasks — negative cervical cytology, lymph node metastasis screening — toward conditional autonomy under defined confidence thresholds. Regulators have signalled openness to this staged approach where post-market surveillance is continuous, and it will be the largest single change in how the Digital Pathology Market creates clinical value [2].

Platform Economics Displace Hardware Margins

Scanner gross margins compress as domestic manufacturers reach parity on brightfield optics. Value migrates to the archive, the viewer and the algorithm marketplace layered above them, and vendors controlling the image management platform capture recurring revenue regardless of whose scanner produced the file [7]. Expect consolidation among software-only firms lacking distribution.

Storage Economics Reshape Architecture

Image volumes grow faster than laboratory budgets. Tiered architectures that keep recent cases on fast local storage and migrate older studies to cold cloud tiers are becoming standard, and compression research targeting diagnostically lossless ratios above 20:1 is drawing serious vendor investment [9]. Whoever solves retention cost meaningfully will unlock the mid-market segment currently priced out.

Data Governance Becomes a Competitive Asset

Health systems are learning that the archive is an appreciating asset. Institutions with defensible consent frameworks, provenance tracking and de-identification pipelines can license data for algorithm training on favourable terms, while those without will sign it away cheaply [14]. Governance capability will separate the institutions that fund their Digital Pathology Market programmes from operating surplus from those that treat it as permanent cost.


Digital Pathology Market Segmentation

By Product

Segment Metric Primary Demand Driver
Whole Slide Imaging Scanners 40.5% revenue share (2025) Primary-diagnosis clearance and multi-shift throughput needs
Image Analysis & AI Software 10.9% CAGR (2026–2035) Quantitative biomarker scoring and triage workloads
Information Management Systems USD 0.24 billion (2025) LIS integration and case routing requirements
Storage & Communication Systems 9.8% CAGR (2026–2035) Retention mandates and archive migration
Consumables & Accessories 7.6% revenue share (2025) Slide preparation and calibration cycles
Services & Support USD 0.18 billion (2025) Validation, training and managed operations


Scanners still anchor the Digital Pathology Market because nothing downstream exists without a digitised slide. Still, their share is eroding predictably as installed bases mature, and refresh cycles lengthen to seven or eight years. Software is where the growth sits. AI pathology image analysis packages priced per case rather than per seat convert clinical volume directly into vendor revenue, and pharmaceutical customers buy them at multiples of what hospitals will pay because trial economics justify it [5].

By Imaging Technique

Segment Metric Primary Demand Driver
Brightfield 79.1% revenue share (2025) Routine H&E and immunohistochemistry diagnostics
Fluorescence 11.3% CAGR (2026–2035) Multiplex panels and spatial biology research


Routine diagnostics run on brightfield and will for the foreseeable future — it is fast, cheap and matches the stains pathologists already trust. Fluorescence grows faster from a small base because multiplex immunofluorescence lets researchers interrogate several markers on a single section, which is exactly what spatial biology workflows require [6]. Instrument costs are two to three times brightfield equivalents, so revenue growth outpaces unit growth substantially in the Digital Pathology Market.

By Application

Segment Metric Primary Demand Driver
Disease Diagnosis 52.7% revenue share (2025) Oncology case volume and turnaround pressure
Drug Discovery & Development USD 0.36 billion (2025) Image-based trial endpoints and companion diagnostics
Telepathology & Consultation 11.1% CAGR (2026–2035) Reimbursed remote subspecialty second opinions
Education & Training 6.9% revenue share (2025) Digital board examinations and teaching-set replacement


Diagnosis dominates because it is where the specimen volume lives, and oncology alone accounts for the majority of digitised cases. Telepathology grows fastest now that United States procedure codes compensate remote consultation, turning what was an unfunded courtesy between colleagues into a marketed service line that reference laboratories actively sell [4]. The Digital Pathology Market rewards applications with an identifiable payer more than those with clinical elegance.

By End User

Segment Metric Primary Demand Driver
Hospitals & Reference Laboratories 41.1% revenue share (2025) Workload consolidation and subspecialty coverage
Pharmaceutical & Biotechnology Companies & CROs 11.2% CAGR (2026–2035) Regulatory demand for quantitative endpoints
Academic & Research Institutes USD 0.31 billion (2025) Grant-funded spatial biology programmes
Diagnostic Laboratories 17.8% revenue share (2025) High-throughput centralised testing models


Hospitals buy the most units; pharmaceutical sponsors buy the most software per user. That divergence explains why vendor sales organisations have split into separate clinical and life-sciences channels with distinct pricing. Contract research organisations sit between them, building dedicated digital reading facilities that they sell as a service back to sponsors, and this hybrid model is expanding faster than either pure segment within the Digital Pathology Market [5].

By Deployment

Segment Metric Primary Demand Driver
On-premise 60.8% revenue share (2025) Data sovereignty rules and existing datacentre investment
Cloud/SaaS 10.9% CAGR (2026–2035) Elastic storage economics and multi-site access


The digital pathology market is still dominated by on-premise installations. Such a situation is driven by rigorous healthcare data sovereignty requirements and hospitals’ dependence on existing local data center infrastructure to protect sensitive patient diagnostics. The fastest expanding category is Cloud/SaaS architecture, driven by the requirement for elastic storage economics to manage huge whole-slide picture archives and multi-site access capabilities to allow for smooth remote peer review.


Regional Market Share Analysis

Region Metric (2025 unless stated) Primary Investment Themes
North America 44.5% revenue share Primary-diagnosis clearance, CPT-funded telepathology, AI validation grants
Europe USD 0.54 billion Centralised pathology hubs, national screening programmes, MDR compliance
Asia-Pacific 12.0% CAGR (2026–2035) Tertiary hospital digitisation, domestic scanner manufacturing, tender-led buying
South America USD 0.08 billion Private laboratory chains, teleconsultation across distance
Middle East & Africa 3.8% revenue share Sovereign health transformation funds, hub-and-spoke reading centres
Total USD 1.96 billion

Regional performance in the Digital Pathology Market diverges sharply on reimbursement rather than technology access. Every region below is measured on a single disclosed metric.


North America

Country Metric Key Driver
US 82.4% of regional revenue Reimbursement codes and cleared primary-diagnosis platforms
Canada USD 0.09 billion Provincial health authority consolidation of laboratory services
Mexico 11.4% CAGR (2026–2035) Private hospital-group modernisation


United States demand rests on a reimbursement foundation no other country matches. Add the Bridge2AI validation programme and a dense installed base of academic medical centres willing to act as algorithm development partners, and the region sustains its lead despite slower unit growth [3]. Canadian provinces are consolidating community laboratory testing into regional hubs, which structurally favours digitisation. Mexico's growth is private-sector led, concentrated in Monterrey, Guadalajara and Mexico City hospital groups serving insured populations, and it makes the country the fastest-growing North American contributor to the Digital Pathology Market.

Europe

Country Metric Key Driver
Germany 22.6% of regional revenue University hospital networks and pharmaceutical R&D proximity
UK USD 0.10 billion National pathology network consolidation and screening backlogs
France 10.9% CAGR (2026–2035) Regional cancer centre digitisation programmes
Italy 9.4% of regional revenue Public tender cycles for laboratory modernisation
Spain USD 0.04 billion Autonomous community health service pilots
Nordic Countries 11.5% CAGR (2026–2035) Sectra-anchored regional archives and high digital maturity
Russia 3.1% of regional revenue Federal oncology centre equipment renewal
Rest of Europe USD 0.06 billion Cross-border teleconsultation among smaller states


European adoption is unusually top-down. National and regional authorities purchase for entire networks, which produces lumpy tender-driven revenue but very high per-deal value — the Nordic model, where a single regional archive serves dozens of hospitals, has become the template that England's pathology networks are copying [15]. Regulatory friction is the counterweight, since Medical Device Regulation conformity work and AI Act obligations extend vendor timelines by several quarters [10].

Asia-Pacific

Country Metric Key Driver
China 30.2% of regional revenue Tertiary hospital grading requirements and domestic scanner supply
India 13.4% CAGR (2026–2035) Diagnostic chain expansion and severe pathologist scarcity
Japan USD 0.09 billion Ageing population and high biopsy volumes
South Korea 9.6% of regional revenue National cancer screening and hospital IT maturity
ASEAN 12.6% CAGR (2026–2035) Cross-border teleconsultation and medical tourism hubs
Rest of Asia-Pacific USD 0.03 billion Academic and research institute procurement


Asia-Pacific converts scarcity into adoption faster than any other region. India has roughly one pathologist for every 65,000 people, so national diagnostic chains built centralised reading centres before hospitals digitised individually [16]. China's tertiary hospital grading criteria reward information-system maturity, and domestic scanner manufacturers have cut entry prices well below imported equivalents. Japan's volumes are structurally high, and its laboratories are consolidating, making the region the growth engine of the Digital Pathology Market through 2035.

South America

Country Metric Key Driver
Brazil 54.8% of regional revenue Private laboratory chains and oncology centre investment
Argentina USD 0.02 billion University hospital research programmes
Rest of South America 10.2% CAGR (2026–2035) Teleconsultation across dispersed populations


Brazilian private diagnostic groups drive almost all regional activity, deploying scanners at central laboratories in São Paulo and serving satellite collection points nationally. Public-sector adoption lags because capital budgets rarely accommodate storage infrastructure alongside instruments [8]. Financing structures matter more than product specification in this region, and vendors offering multi-year leases consistently outperform those quoting outright purchase.

Middle East & Africa

Country Metric Key Driver
Saudi Arabia 27.4% of regional revenue Health sector transformation programme funding
UAE 12.8% CAGR (2026–2035) Medical tourism and greenfield hospital builds
South Africa USD 0.01 billion National laboratory service pilot deployments
Egypt 8.9% of regional revenue University hospital and oncology institute upgrades
Rest of MEA USD 0.02 billion Donor-funded diagnostic network projects


Gulf states buy differently from the rest of the region: greenfield hospitals specify digital pathology at design stage rather than retrofitting, which removes integration cost and shortens deployment to months. Sub-Saharan projects depend on development finance and typically follow a hub-and-spoke design, with one national reading centre supporting district facilities that lack any resident pathologist [18].


Digital Pathology Market By Region, 2025-2035

Competitive Benchmarking

Concentration in the Digital Pathology Market is moderate. The top five suppliers together hold roughly 48–55% of revenue, and estimated HHI sits near 950–1,100 — high enough that incumbents set pricing norms, low enough that specialist software entrants continue to win clinical accounts on algorithm performance alone. Hardware is consolidating around four scanner platforms; software remains genuinely fragmented, with more than 40 credible vendors selling cleared or research-use algorithms. Ranges below are estimates and do not sum precisely.

Company Est. Revenue Share Range Key Offerings for Digital Pathology Market Strategic Positioning
Leica Biosystems (Danaher) ~14–18% Aperio scanners, image management, AI partner ecosystem Broadest installed base; open algorithm marketplace strategy
Roche Diagnostics ~11–15% Ventana scanners, uPath software, companion diagnostics Ties digitisation to its own IHC assay and CDx franchise
Koninklijke Philips ~8–11% IntelliSite Pathology Solution, enterprise viewer Early primary-diagnosis clearance; enterprise imaging integration
Hamamatsu Photonics ~6–9% NanoZoomer scanner series, fluorescence platforms Optics-led differentiation; strong Japanese and research base
Evident (Olympus) ~5–8% Slide scanners, microscopy and imaging software Research and education strength; clinical expansion underway
Sectra AB ~4–6% Enterprise image management and pathology module Radiology-adjacent VNA strategy; dominant in Nordic networks
Agilent Technologies ~3–5% Scanners, stains, workflow software Reagent-to-image bundling for pharma customers
3DHISTECH ~3–5% Pannoramic scanners, teaching and research systems Price-competitive entry into academic and emerging markets
Epredia (PHC Group) ~2–4% Scanners, consumables, laboratory workflow Anatomic pathology consumables installed base leverage
Indica Labs ~2–3% HALO image analysis and AP platform Quantitative analysis depth for translational research
Paige ~1–3% Cleared clinical AI applications, foundation models Algorithm-first; clinical clearance credibility
Proscia ~1–3% Concentriq platform, dermatopathology AI Software-only platform play across scanner brands
Ibex Medical Analytics ~1–2% Prostate and breast diagnostic AI Deployment-proven quality control and detection tools


Recent News & Developments

  • Leica Biosystems (March 2024): Expanded its scanner-agnostic image management platform with third-party algorithm hosting, signalling a shift from closed hardware to marketplace economics [19].
  • Roche Diagnostics (September 2024): Extended its digital pathology software into companion diagnostic workflows, linking algorithm scoring to therapy selection decisions [20].
  • U.S. Food and Drug Administration (January 2024): Granted additional clearances covering whole-slide imaging for primary diagnostic use, broadening the range of validated scanner-display combinations [2].
  • National Institutes of Health (February 2025): Allocated USD 150 million under Bridge2AI to build ethically sourced, bias-audited datasets for pathology algorithm validation [3].
  • Sectra AB (June 2024): Signed multi-hospital enterprise imaging agreements in the Nordics and United Kingdom that place pathology alongside radiology in a single archive [15].
  • Paige (November 2023): Released clinical-grade foundation models trained on multi-institution slide archives, reframing the competitive basis from task-specific tools to general-purpose backbones [21].
  • Ibex Medical Analytics (May 2025): Announced expanded European deployments of its quality-control and detection applications across private laboratory networks [22].
  • PHC Group / Epredia (October 2024): Integrated scanner and consumables portfolios to offer bundled anatomic pathology workflow contracts to reference laboratories [23].


Digital Pathology Market Report Scope

Parameter Detail
Market Scope Global digital pathology hardware, software, storage, consumables and services for clinical diagnosis, research, pharmaceutical development and education
Study Period 2021–2035 (Historical 2021–2024; Base Year 2025; Forecast 2026–2035)
CAGR 10.4% (2026–2035)
Market Size Checkpoints USD 1.96 Billion (2025); USD 2.15 Billion (2026); USD 3.52 Billion (2031); USD 5.23 Billion (2035)
Fastest Growing Segments Fluorescence imaging (11.3% CAGR); Pharmaceutical & Biotechnology Companies & CROs (11.2% CAGR); Telepathology & Consultation (11.1% CAGR); Asia-Pacific (12.0% CAGR)
Companies Profiled Leica Biosystems, Roche Diagnostics, Koninklijke Philips, Hamamatsu Photonics, Evident, Sectra AB, Agilent Technologies, 3DHISTECH, Epredia, Indica Labs, Paige, Proscia, Ibex Medical Analytics
Valuation Currency USD Billion

FAQs

What should a laboratory budget beyond the scanner when entering the Digital Pathology Market?
Storage, network upgrades, LIS integration and validation typically add 60–90% on top of instrument capex. Multi-year image retention becomes the largest recurring line item once volumes scale. [8]
How do buyers validate an AI algorithm before clinical deployment?
Site-specific validation on a representative case set is required, generally 60 or more slides per intended use, with concordance measured against glass review. Vendor performance data does not substitute for local validation. [12]
Is cloud deployment viable for regulated Digital Pathology Market workflows in Europe?
Yes, where the provider offers in-region hosting and compliant data processing agreements. Several national health systems still require primary image copies to remain on sovereign infrastructure. [10]
Which procurement model reduces obsolescence risk?
Subscription bundles combining scanner refresh, software updates and storage into one per-slide or annual fee. They transfer technology risk to the vendor and shorten capital approval cycles. [7]
Which use case delivers the fastest payback in the Digital Pathology Market?
Remote subspecialty consultation. It eliminates courier costs, shortens turnaround, and is now directly reimbursable in the United States under dedicated procedure codes. [4]
How important is format compliance when selecting a scanner?
Critical. Proprietary formats lock images to one vendor's viewer and complicate future migration, whereas standards-compliant output preserves portability across platforms and protects archive value. [11]
What differentiates vendors competing in emerging economies?
Service density and financing terms. Buyers in South America, Africa and Southeast Asia weigh local field engineering coverage and leasing availability more heavily than raw scanning throughput. [18]    
Author
Author
Author Profile
Satyendra Maurya LinkedIn
Research Analyst
An accomplished research analyst with high proficiency in market forecasting, data visualization, competitive benchmarking, and others. He holds a pronounced track record in research and consulting projects for sectors such as life sciences, medical devices, and healthcare IT. His capabilities in qualitative and quantitative analysis have resulted in positive client outcomes. Working on niche market trends, opportunities, sales, and forecasted value is part of his skill set.
Co-Author
Co-Author Profile
Rahul Gotadki LinkedIn
Research Manager
He holds an experience of about 9+ years in Market Research and Business Consulting, working under the spectrum of Life Sciences and Healthcare domains. Rahul conceptualizes and implements a scalable business strategy and provides strategic leadership to the clients. His expertise lies in market estimation, competitive intelligence, pipeline analysis, customer assessment, etc.
Share::
Request Free Sample

Research Approach


Secondary Research

The secondary research process involved comprehensive analysis of regulatory databases for medical devices and in vitro diagnostics, peer-reviewed pathology journals, clinical informatics publications, and authoritative healthcare technology organizations. Key sources included the US Food & Drug Administration (FDA) 510(k) Clearance Database and De Novo Pathway Records, European Medicines Agency (EMA) Medical Device Regulations, Health Canada Medical Device Active License Listing, College of American Pathologists (CAP) Guidelines and Accreditation Programs, Digital Pathology Association (DPA) White Papers and Standards, American Society of Clinical Pathology (ASCP) Workforce Reports, European Society of Pathology (ESP) Digital Pathology Committee Reports, National Institutes of Health (NIH) National Cancer Institute (NCI) Imaging Data Commons, National Center for Biotechnology Information (NCBI/PubMed) for computational pathology studies, Centers for Disease Control and Prevention (CDC) National Program of Cancer Registries (NPCR), World Health Organization (WHO) Global Cancer Observatory (GLOBOCAN), Organization for Economic Co-operation and Development (OECD) Health Statistics, Digital Imaging and Communications in Medicine (DICOM) Standards Committee Pathology Working Group, and national health informatics agency reports from key markets. These sources were used to collect regulatory clearance data for whole slide imaging scanners, AI/ML algorithm validations, cancer incidence statistics driving diagnostic demand, laboratory automation trends, telepathology adoption rates, and interoperability standards compliance for digital pathology workflows.


Primary Research

Qualitative and quantitative insights were obtained by interviewing supply-side and demand-side stakeholders during the primary research process. The supply-side sources consist of CEOs, VPs of Engineering, Chief Medical Officers, regulatory affairs chiefs, and commercial directors from whole slide scanner manufacturers, pathology information system vendors, AI diagnostic algorithm developers, and cloud pathology platform providers. The demand-side sources included procurement managers from academic medical centers, community hospital networks, independent diagnostic laboratories, contract research organizations (CROs), and national cancer institutes, as well as Chief Pathologists, pathology department chairs, laboratory medical directors, and digital pathology implementation leads. Market segmentation was validated across hardware, software, and services through primary research. Additionally, AI algorithm development pipelines were confirmed, and insights were gathered on scanner replacement cycles, cloud storage migration patterns, laboratory information system (LIS) integration challenges, and reimbursement pathways for digital pathology procedures.

Primary Respondent Breakdown:

By Designation: C-level Primaries (32%), Director Level (35%), Others (33%)

By Region: North America (32%), Europe (30%), Asia-Pacific (28%), Rest of World (10%)


Market Size Estimation

Global market valuation was derived through revenue mapping of installed base and recurring service contracts. The methodology included:

Identification of 40+ key manufacturers across North America, Europe, Asia-Pacific, and Latin America specializing in slide scanners, image management software, and AI analytics platforms

Product mapping across whole slide imaging hardware, virtual microscopy software, artificial intelligence algorithms, and integrated storage solutions

Analysis of reported and modeled annual revenues specific to digital pathology portfolios, including hardware sales, software licenses, and maintenance contracts

Coverage of manufacturers representing 70-75% of global market share in 2024

Extrapolation using bottom-up (installed scanner base × annual service contract value + new equipment sales by country) and top-down (manufacturer revenue validation against total addressable pathology laboratory market) approaches to derive segment-specific valuations for software, hardware, and service components across hospital, diagnostic laboratory, and research institute end users

Share::
Request Free Sample
Download Free Sample

Kindly complete the form below to receive a free sample of this Report

* Please use a valid business email

Share::
Request Free Sample
Download PDF ×

We do not share your information with anyone. However, we may send you emails based on your report interest from time to time. You may contact us at any time to opt-out.
















