Diabetes Drug Market (2026 - 2035)

Diabetes Drug Market Research Report By Drug Class (Insulin, Sulfonylureas, Biguanides, DPP-4 Inhibitors, GLP-1 Receptor Agonists), By Administration Route (Oral, Injectable, Inhalation, Transdermal), By Therapeutic Use (Type 1 Diabetes, Type 2 Diabetes, Gestational Diabetes), By Distribution Channel (Retail Pharmacies, Hospital Pharmacies, Online Pharmacies) and By Regional (North America, Europe, South America, Asia Pacific, Middle East and Africa) - Industry Forecast to 2035.
ID: MRFR/Pharma/0654-HCR
80 Pages
Nidhi Mandole, Rahul Gotadki
Last Updated: July 10, 2026
Diabetes Drug Market
Market Size
Forecast Period2026-2035
CAGR (2026-2035)3.80%
2025 Market SizeUSD 96.90 Billion
2035 Market SizeUSD 140.70 Billion
Key Players
Novo Nordisk
Eli Lilly
Sanofi
AstraZeneca
Merck & Co.
Boehringer Ingelheim
Opportunities
  • Oral Biologic Delivery Platforms
  • AI-Guided Personalized Dosing
  • Emerging Market Screening-to-Treatment Conversion

Diabetes Drug Market Summary

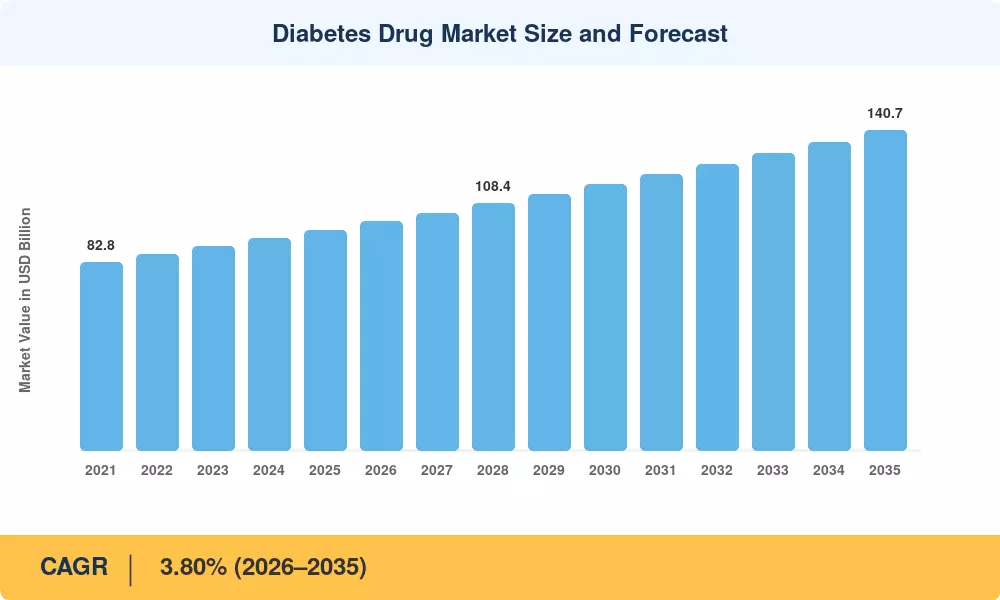
The Diabetes Drug Market size was valued at USD 96.90 Billion in 2025, and the market is projected to grow from USD 100.60 Billion in 2026 to USD 140.70 Billion by 2035, registering a CAGR of 3.80% during the forecast period 2026–2035. Two structural forces are propelling this trajectory: the U.S. Inflation Reduction Act's Medicare drug-price negotiation provisions, which are reshaping manufacturer pricing strategies across the insulin portfolio, and the International Diabetes Federation's projection that global diabetes prevalence will surpass 850 million adults before 2050 [1]. Together, these catalysts are locking in durable volume growth while compressing average selling prices in mature economies.

A pronounced therapeutic shift is underway within the Diabetes Drug Market. Legacy sulfonylureas and older basal insulin formulations are steadily losing ground to newer dual-incretin co-agonists and next-generation long-acting analogs. Novo Nordisk, Eli Lilly, and Sanofi collectively committed more than USD 16 billion in manufacturing capacity expansion between 2023 and 2025 to address persistent supply shortages of injectable therapies [2]. Regulatory bodies in the EU and Japan have fast-tracked biosimilar approvals, intensifying price competition across subcutaneous delivery formats.

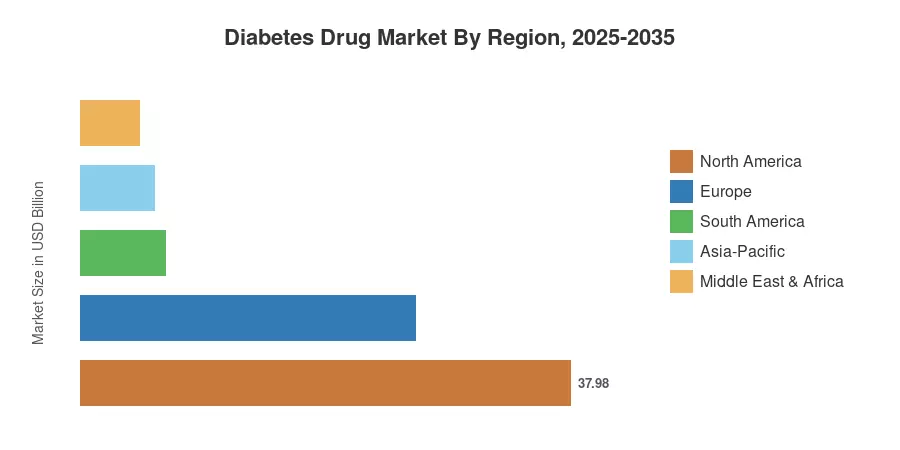
North America held a 39.2% share of the Diabetes Drug Market in 2025, anchored by high per-capita spending and broad commercial insurance coverage for branded therapies. Asia-Pacific represents the fastest-growing region at a 5.95% CAGR through 2035, driven by nationwide screening programs in China and India that are converting undiagnosed populations into treated patients. Europe retains the second-largest position with a 26.8% share, supported by centralized reimbursement frameworks. The next decade will reward manufacturers that balance premium innovation with accessible pricing in emerging markets.


Key Report Takeaways

• By Drug Class

  • Insulin accounted for 52.6% of the Diabetes Drug Market in 2025, reflecting entrenched prescribing patterns in Type 1 and advanced Type 2 diabetes management.
  • Non-insulin injectable drugs are forecast to grow at a 4.55% CAGR through 2035, buoyed by cardiovascular and renal outcome trial evidence favoring incretin-based therapies.
  • Combination drugs are gaining formulary traction across Europe as payers push for fixed-dose regimens that improve adherence.

• By Route of Administration

  • Subcutaneous delivery captured 66.5% of the Diabetes Drug Market in 2025, underscoring the dominance of injectable insulin and pen-based therapies.
  • Oral administration is projected to expand at a 5.24% CAGR to 2035 as oral semaglutide and emerging oral biologics gain share.

• By Distribution Channel

  • Hospital pharmacies represented 36.3% of revenue in 2025, although digital pharmacy platforms are eroding traditional channel dominance.
  • Online pharmacies constitute the fastest-growing channel at a 6.28% CAGR, led by transparent cash-pay pricing models in the United States.

• By Region

  • North America commanded 39.2% of the Diabetes Drug Market in 2025, driven by premium pricing and large employer-sponsored insurance pools.
  • Asia-Pacific is set to expand at a 5.95% CAGR through 2035, propelled by government-led diabetes screening drives across China, India, and the Gulf states.


Market Size and Forecast (2021–2035)

Data in this section draws on a triangulated methodology combining manufacturer revenue disclosures, prescription-volume audits from IQVIA and government health-expenditure databases, and proprietary primary interviews with hospital procurement directors and payer formulary committees.
Diabetes Drug Market Size and Forecast
Our Impact
Enabled $4.3B Revenue Impact for Fortune 500 and Leading Multinationals
Partnering with 2000+ Global Organizations Each Year
30K+ Citations by Top-Tier Firms in the Industry

Driver Impact Analysis

Driver ~% Impact on CAGR Geographic Relevance Impact Timeline
Rising global diabetes prevalence +0.95% Global Long-term
Cardiovascular and renal outcome trial evidence +0.70% North America, Europe Medium-term
Biosimilar insulin price compression +0.55% Europe, Asia-Pacific Short-term
Digital pharmacy channel expansion +0.40% North America Short-term
Government screening and early-diagnosis programs +0.35% Asia-Pacific, MEA Long-term
Fixed-dose combination therapy adoption +0.30% Europe, South America Medium-term
Closed-loop delivery device integration +0.25% North America, Japan Long-term


Rising Global Diabetes Prevalence

The International Diabetes Federation estimated 588.7 million adults living with diabetes in 2024, with projections exceeding 850 million by 2050 [1]. Nearly 43% of current cases remain undiagnosed, creating a substantial reservoir of future treated patients. Nationwide screening initiatives in China, India, Saudi Arabia, and the UAE are converting these undiagnosed populations into active pharmaceutical consumers, expanding the addressable Diabetes Drug Market at its foundation rather than relying solely on pricing gains.

Cardiovascular and Renal Outcome Trial Evidence

Large-scale outcomes trials — SUSTAIN-6, EMPA-REG OUTCOME, and SURPASS — have repositioned newer therapies from second-line glycemic agents to guideline-endorsed first-line treatments for patients with established cardiovascular or renal comorbidities [6]. The American Diabetes Association's 2024 Standards of Care now recommend semaglutide or tirzepatide ahead of basal insulin in most Type 2 patients with atherosclerotic disease, a shift that is accelerating volume migration toward non-insulin injectables within the Diabetes Drug Market.

Biosimilar Insulin Price Compression

Between 2023 and 2025, four new insulin glargine and insulin aspart biosimilars were approved by the European Medicines Agency, resulting in average price reductions of 35–45% in Germany, France, and the Nordic countries [8]. Biosimilars create a net-positive volume effect that supports expansion in the diabetes drug market across emerging nations by simultaneously expanding treated populations in cost-sensitive health systems and compressing per-unit revenue.


Digital Pharmacy Channel Expansion

Rapid-acting insulin is currently priced at about USD 29 per vial under transparent cash-pay models offered by digital pharmacies in the US, which is significantly less than the USD 300 or more that traditional retail shops charge [11]. Particularly in rural U.S. areas where pharmacy deserts have historically reduced prescription adherence, this pricing disruption is drawing patients away from hospital pharmacy channels and increasing access among uninsured and impoverished populations.


Restraints Impact Analysis

As with the driver table, restraint impact estimates are directional and qualitative. They reflect headwinds that moderate the growth trajectory rather than mechanistically reduce the CAGR by exact percentage points.

Restraint ~% Impact on CAGR Geographic Relevance Impact Timeline
Government price negotiation and reference pricing –0.60% North America, Europe Medium-term
Volume-based procurement compressing margins –0.45% China Short-term
Patent cliffs on blockbuster molecules –0.40% Global Medium-term
Hypoglycemia safety concerns limiting aggressive titration –0.25% Global Long-term
Supply-chain bottlenecks for injectable capacity –0.20% Global Short-term


Government Price Negotiation Mandates

The North American Diabetes Drug Market has entered a new age of pricing transparency when negotiated rates under the U.S. Inflation Reduction Act (IRA) went into effect on January 1, 2026. Manufacturers are under measurable margin pressure as important treatments like Jardiance and Januvia are now subject to contractual limitations. In the future, it is anticipated that the Medicare Part D channel's revenue will be further compressed by the 2027 and 2028 negotiation cycles, which will include well-known GLP-1 and dual-agonist medicines. This would essentially move the market toward a value-based pricing equilibrium.


Volume-Based Procurement in China

More than 90% of frequently prescribed diabetes treatments are now covered under volume-based procurement under China's National Healthcare Security Administration [15]. In 2024, winning-bid prices decreased by an average of 52% from pre-tender levels during Round 9 procurement. Although this strategy has increased population coverage, it has reduced China-specific revenue for international manufacturers in the diabetes drug market, forcing some of them to completely leave low-margin insulin markets.


Patent Cliffs on Blockbuster Molecules

Key patents on liraglutide expired in major markets during 2023–2024, and semaglutide composition-of-matter patents face challenge proceedings expected to resolve before 2030 [16]. Biosimilar and follow-on entrants will redistribute billions in annual revenue from originators to generic manufacturers, compressing the value growth of the Diabetes Drug Market even as volume continues to climb.


Diabetes Drug Market Opportunities

Oral Biologic Delivery Platforms

Oral semaglutide demonstrated that peptide-based therapies can achieve bioavailability through oral formulations. Multiple pipeline candidates — including oral GLP-1/GIP dual agonists and oral insulin capsules using permeation-enhancer technology — are in late-stage development [18]. Successful commercialization would unlock patient populations resistant to injectable therapy, potentially converting 20–30% of the subcutaneous Diabetes Drug Market to oral delivery by the early 2030s.

AI-Guided Personalized Dosing

Machine-learning algorithms integrated into continuous glucose monitoring systems can now recommend real-time dosing adjustments with accuracy exceeding 90% in controlled trials [14]. Regulatory agencies in the U.S. and EU are developing software-as-a-medical-device frameworks to clear these platforms for clinical use, creating a companion digital therapeutic layer atop the existing Diabetes Drug Market.

Emerging Market Screening-to-Treatment Conversion

Saudi Arabia, the UAE, and Egypt have launched national diabetes registries paired with primary-care screening mandates [12]. India's Ayushman Bharat program expanded diabetes drug coverage to over 500 million citizens by 2024. These programs transform previously untreated populations into steady-state pharmaceutical consumers, offering volume-driven growth in regions currently representing less than 12% of the Diabetes Drug Market.

Data-Enabled Payer Contracting Models

Outcomes-based contracts — where manufacturers share financial risk tied to HbA1c reduction targets or hospitalization avoidance — are gaining traction with large U.S. employers and European sickness funds [19]. These models incentivize premium-priced innovative therapies over generics by tying reimbursement to measurable patient outcomes, creating a new commercial architecture within the Diabetes Drug Market.

Biosimilar Portfolio Expansion in Sub-Saharan Africa

Local manufacturing initiatives by the African Union's African Medicines Agency, combined with WHO prequalification of biosimilar insulins, are expected to reduce average treatment costs by 40–50% across Sub-Saharan Africa by 2030 [20]. This region represents a largely untapped frontier for the Diabetes Drug Market, with diabetes prevalence growing at nearly twice the global average rate.


Diabetes Drug Market Future Outlook

Precision Medicine and Pharmacogenomic Stratification

Pharmacogenomic testing is expected to stratify Type 2 diabetes patients into metabolic subtypes — insulin-resistant, beta-cell-deficient, and mixed-phenotype — enabling targeted drug selection that improves outcomes and reduces trial-and-error prescribing [21]. Health systems investing in genomic infrastructure will extract greater value from the Diabetes Drug Market by matching patients to optimal therapies earlier in the disease course, reducing downstream complications costs by an estimated 15–20% per patient.

Cell and Gene Therapy Pipeline for Type 1 Diabetes

Vertex Pharmaceuticals' stem-cell-derived islet cell therapy demonstrated insulin independence in early-phase trials, signaling a potential curative pathway for Type 1 diabetes [22]. While commercial-scale availability remains beyond 2032, the Diabetes Drug Market will begin pricing in competitive displacement risk for chronic insulin therapy as late-stage trial data mature. Manufacturers with diversified Type 2 portfolios will be better insulated from this structural shift.

Platform Economics and Integrated Diabetes Management

Connected insulin pens, continuous glucose monitors, and AI dosing algorithms are converging into integrated platform ecosystems where pharmaceutical manufacturers compete not just on molecular efficacy but on digital experience [14]. The Diabetes Drug Market is evolving toward subscription-like models where drug, device, and software are bundled under single reimbursement codes — a shift that will favor vertically integrated players with both pharmaceutical and device capabilities.

Climate-Driven Demand Patterns

Rising global temperatures threaten insulin cold-chain stability in tropical and subtropical regions, with the WHO estimating that climate change could render up to 15% of current insulin supply chains in South and Southeast Asia unreliable by 2035 [23]. Thermostable insulin formulations and ambient-temperature storage innovations represent both a necessity and a commercial opportunity within the Diabetes Drug Market, particularly for manufacturers serving the 1.4 billion people living in climate-vulnerable zones.


Diabetes Drug Market Segmentation

By Drug Class

Segment Key Metric Primary Demand Driver
Insulin 52.6% share (2025) Type 1 dependency + advanced Type 2 treatment
Oral Anti-Diabetic Drugs USD 27.62 Billion (2025) First-line prescribing for newly diagnosed Type 2
Non-Insulin Injectable Drugs 4.55% CAGR (2026–2035) Cardiovascular outcome superiority data
Combination Drugs USD 4.55 Billion (2025) Adherence-driven formulary preference in Europe


Insulin remains the cornerstone of the Diabetes Drug Market by revenue, commanding a 52.6% share in 2025 across basal, bolus, and premix formulations. Biosimilar competition is intensifying, however, with glargine biosimilars now holding over 40% of the long-acting insulin market in Europe [8]. The segment's growth rate lags the overall market as volume gains are partially offset by per-unit price erosion.

Non-insulin injectable drugs represent the fastest-growing drug class within the Diabetes Drug Market at a 4.55% CAGR. The class has been transformed by semaglutide and tirzepatide, whose dual glycemic-plus-cardiovascular benefit profiles have earned guideline-endorsed first-line positioning. Capacity constraints have limited full commercial potential since 2022, but manufacturer investments exceeding USD 16 billion in new fill-finish facilities are expected to normalize supply by 2028 [2].

By Route of Administration

Segment Key Metric Primary Demand Driver
Subcutaneous 66.5% share (2025) Insulin pen and prefilled syringe dominance
Oral 5.24% CAGR (2026–2035) Oral semaglutide uptake + pipeline oral biologics
Intravenous USD 4.55 Billion (2025) Hospital-based acute glycemic management


Subcutaneous administration dominates the Diabetes Drug Market by route, reflecting the injectable nature of all insulin and most incretin-based therapies. Oral administration is gaining ground rapidly as oral semaglutide proves that peptide delivery through the gastrointestinal tract is commercially viable, and several oral insulin candidates are advancing toward Phase III trials.

By Distribution Channel

Segment Key Metric Primary Demand Driver
Retail Pharmacies 42.5% share (2025) Walk-in convenience and insurance network breadth
Hospital Pharmacies USD 35.17 Billion (2025) Inpatient and specialist-initiated prescriptions
Online Pharmacies 6.28% CAGR (2026–2035) Cash-pay pricing transparency and home delivery


Retail pharmacies remain the primary dispensing channel for the Diabetes Drug Market, though their share is under pressure from both digital entrants and hospital-affiliated specialty pharmacies. Online pharmacies are growing at a 6.28% CAGR, propelled by consumer preference for home delivery and disruptive pricing models that undercut traditional pharmacy benefit manager markups by 50–70% on select insulin products [11].


Regional Market Share Analysis

Region Key Metric (2025) Primary Investment Themes
North America 39.2% share Medicare negotiation, digital pharmacy disruption
Europe USD 25.97 Billion Biosimilar adoption, HTA-driven formulary management
Asia-Pacific 5.95% CAGR (2026–2035) Government screening programs, local manufacturing
South America USD 6.59 Billion Public health system expansion, fixed-dose combinations
Middle East & Africa 4.7% share National diabetes registries, WHO prequalification
Total USD 96.90 Billion

The Diabetes Drug Market exhibits pronounced regional stratification, with mature markets commanding premium pricing and emerging regions delivering faster volume growth. The table below summarizes each region's positioning within the global landscape.


North America

Country Key Metric Key Driver
United States 82.5% of regional share IRA price negotiations, employer-sponsored coverage
Canada CAGR 3.45% Provincial formulary harmonization
Mexico USD 2.18 Billion Social security system drug procurement expansion


The United States remains the single largest national Diabetes Drug Market, underpinned by the highest per-capita diabetes drug spending globally at approximately USD 1,250 per treated patient annually [4]. Pharmacy benefit manager consolidation continues to shape formulary access, while the emergence of Mark Cuban Cost Plus Drug Company and Amazon Pharmacy has disrupted traditional pricing channels. Canada's pan-Canadian Pharmaceutical Alliance is negotiating bulk purchasing agreements that may compress branded insulin prices by 18–22% through 2028.

Europe

Country Key Metric Key Driver
Germany 24.3% of regional share G-BA early benefit assessment driving uptake of new therapies
United Kingdom CAGR 3.60% NHS England diabetes pathway restructuring
France USD 3.85 Billion Haute Autorité de Santé biosimilar substitution mandate
Italy 11.8% of regional share Regional health authority tender consolidation
Spain CAGR 3.50% National Strategy for Diabetes 2025–2030
Nordic Countries USD 2.10 Billion Early-adopter market for digital diabetes platforms
Russia 5.2% of regional share Domestic insulin manufacturing self-sufficiency push
Rest of Europe CAGR 3.30% EU cross-border pharmaceutical legislation


European health technology assessment bodies increasingly mandate biosimilar-first prescribing for insulin-naïve patients, a policy stance that has lifted biosimilar penetration past 60% in Germany and the Nordic countries [8]. The Diabetes Drug Market across the EU benefits from harmonized EMA approval pathways, yet country-level reimbursement timelines still vary by 6–18 months, creating fragmented launch sequences for innovative therapies.

Asia-Pacific

Country Key Metric Key Driver
China 38.5% of regional share Volume-based procurement, NMPA fast-track approvals
India CAGR 6.80% Ayushman Bharat coverage expansion
Japan USD 4.15 Billion PMDA innovation premium pathway
South Korea 7.4% of regional share HIRA listing acceleration for dual-incretin therapies
ASEAN CAGR 6.20% Universal health coverage rollouts in Thailand, Vietnam
Rest of Asia-Pacific 5.1% of regional share Medical tourism and cross-border pharmacy trade


Asia-Pacific represents the most dynamic growth corridor for the Diabetes Drug Market, propelled by demographic tailwinds and aggressive government intervention. China's National Reimbursement Drug List expanded to include tirzepatide and oral semaglutide in 2024, immediately expanding the addressable treated population by an estimated 12 million patients [15]. India's Jan Aushadhi generic pharmacy network now stocks WHO-prequalified biosimilar insulin at prices 70% below branded alternatives.

South America

Country Key Metric Key Driver
Brazil 58.6% of regional share SUS national pharmaceutical procurement
Argentina CAGR 4.10% ANMAT regulatory modernization
Rest of South America USD 1.54 Billion Pan-American Health Organization pooled procurement


Brazil's Unified Health System (SUS) provides universal access to essential diabetes medications, positioning the country as the clear anchor of the South American Diabetes Drug Market. Fixed-dose combination therapies are gaining particular traction as adherence-enhancing alternatives in primary care settings across the region, where physician-to-patient ratios remain challenging outside major urban centers.

Middle East & Africa

Country Key Metric Key Driver
Saudi Arabia 28.4% of regional share Vision 2030 healthcare investment cluster
UAE CAGR 5.30% Dubai Health Authority digital pharmacy licensing
South Africa USD 0.72 Billion National Health Insurance Bill pharmaceutical procurement
Egypt 14.9% of regional share Local insulin manufacturing under Egyptian Drug Authority
Rest of MEA CAGR 4.80% WHO prequalification and donor-funded access programs


The Gulf states are investing heavily in diabetes prevention and treatment infrastructure as part of broader economic diversification strategies. Saudi Arabia's Ministry of Health allocated USD 1.2 billion to chronic disease management under Vision 2030, directly benefiting the Diabetes Drug Market through expanded screening coverage and digital health record integration [12]. Sub-Saharan Africa remains the most underserved region, though African Medicines Agency harmonization efforts are reducing biosimilar registration timelines from 24 months to under 12 months.


Diabetes Drug Market By Region, 2025-2035

Competitive Benchmarking

The Diabetes Drug Market exhibits medium concentration, with the top five manufacturers accounting for an estimated 62–68% of global revenue. The Herfindahl-Hirschman Index falls in the 1,200–1,500 range, reflecting a market dominated by three large incumbents surrounded by a second tier of diversified pharmaceutical companies competing in specific drug classes or regional niches.

Company Est. Revenue Share Range Key Offerings for Diabetes Drug Market Strategic Positioning
Novo Nordisk ~25–30% Semaglutide (Ozempic/Rybelsus), insulin degludec, insulin aspart Market leader in injectables; vertical integration in API manufacturing
Eli Lilly ~15–19% Tirzepatide (Mounjaro), insulin lispro, dulaglutide First-mover in dual-incretin agonists; aggressive capacity expansion
Sanofi ~10–14% Insulin glargine (Lantus/Toujeo), insulin aspart biosimilar Legacy insulin leader pivoting toward biosimilar defense
AstraZeneca ~5–8% Dapagliflozin (Farxiga), saxagliptin SGLT2 class leader with cardiovascular and renal franchises
Merck & Co. ~4–7% Sitagliptin (Januvia), ertugliflozin DPP-4 class anchor with broad global distribution
Boehringer Ingelheim ~4–6% Empagliflozin (Jardiance), linagliptin Co-marketing alliance with Lilly on cardio-renal positioning
Takeda ~2–4% Alogliptin, voglibose Focused on Japan and Asia-Pacific regional distribution
Johnson & Johnson (Janssen) ~2–4% Canagliflozin (Invokana) Early SGLT2 entrant; repositioning toward specialty care
Bayer AG ~1–3% Finerenone (Kerendia) for diabetic kidney disease Adjacent positioning in diabetes-related renal complications
Abbott Laboratories ~1–3% FreeStyle Libre-linked therapeutic algorithms Device-pharma convergence strategy


Recent News & Developments


  • AstraZeneca (October 2024): Published DAPA-CKD extension data demonstrating 39% reduction in kidney disease progression among Type 2 diabetes patients, supporting expanded labeling for dapagliflozin [6].


  • Vertex Pharmaceuticals (June 2024): Reported that 6 of 12 patients in the VX-880 Phase I/II trial achieved insulin independence for over 12 months, advancing stem-cell-derived islet therapy toward pivotal trials [22].


  • European Medicines Agency (February 2024): Approved two additional insulin aspart biosimilars, bringing the total approved biosimilar insulins in the EU to 14, intensifying price competition across the Diabetes Drug Market [8].
  • WHO (November 2023): Prequalified three biosimilar insulin products manufactured in India and Egypt, enabling procurement through UNICEF and the Global Fund for distribution in 40 low-income countries [20].


Diabetes Drug Market Report Scope

Parameter Detail
Market Scope Global Diabetes Drug Market covering therapeutic pharmaceuticals for Type 1 and Type 2 diabetes
Study Period 2021–2035
CAGR 3.80% (2026–2035)
Base Year Market Size USD 96.90 Billion (2025)
Forecast Endpoint USD 140.70 Billion (2035)
Fastest Growing Drug Class Non-Insulin Injectable Drugs (4.55% CAGR)
Fastest Growing Region Asia-Pacific (5.95% CAGR)
Companies Profiled 10 (Novo Nordisk, Eli Lilly, Sanofi, AstraZeneca, Merck, Boehringer Ingelheim, Takeda, Johnson & Johnson, Bayer, Abbott)
Valuation Currency USD Billion


FAQs

How does the Diabetes Drug Market address affordability in low-income countries?
WHO prequalification of biosimilar insulins manufactured in India and Egypt has reduced procurement costs by 40–50% for donor-funded programs [20]. Pooled purchasing through PAHO and UNICEF further extends affordable access across 40+ countries.
What risks does the Diabetes Drug Market face from cell-based curative therapies?
Stem-cell-derived islet therapies could displace chronic insulin use in Type 1 patients, but commercial-scale availability is unlikely before 2033 [22]. Type 2 therapies, which represent the majority of revenue, face minimal displacement risk.
How are outcomes-based contracts reshaping pricing in the Diabetes Drug Market?
Payers increasingly tie reimbursement to HbA1c reduction and hospitalization avoidance metrics [19]. These contracts favor innovative therapies that demonstrate measurable real-world results over generic alternatives.
Which pipeline mechanisms could disrupt the current Diabetes Drug Market landscape?
Oral dual-incretin agonists and once-monthly injectable formulations are in late-stage trials. Successful commercialization would reduce injection frequency and shift prescribing away from daily-dose insulin regimens [18].
How do digital pharmacy models affect margin structures in the Diabetes Drug Market?
Direct-to-consumer pricing eliminates pharmacy benefit manager markups, compressing retail margins by 50–70% [11]. Manufacturers offset this through higher volume and reduced returns.
What role does the Diabetes Drug Market play in integrated diabetes management platforms?
Connected pens and CGM-linked dosing algorithms are bundling drugs with digital tools under unified reimbursement [14]. Manufacturers with device capabilities hold a structural advantage in this convergence.
How do climate risks impact insulin supply chains within the Diabetes Drug Market?
Up to 15% of cold-chain infrastructure in tropical regions may become unreliable by 2035 due to rising temperatures [23]. Thermostable formulations represent both a patient-safety imperative and a differentiated commercial opportunity.    
What is the current size of the diabetes drug market?
The diabetes drug market reached USD 96.90 billion in 2025 and is projected to reach USD 140.70 billion by 2035.
What is the CAGR of the diabetes drug market?
The diabetes drug market is projected to grow at a CAGR of 3.80% during the forecast period 2026–2035.
Which region leads the diabetes drug market?
North America holds the largest share at 39.2%, while Asia-Pacific is the fastest-growing region at 5.95% CAGR.
Author
Author
Author Profile
Nidhi Mandole LinkedIn
Senior Research Analyst
She is an extremely curious individual currently working in Healthcare and Medical Devices Domain. Nidhi is comfortably versed in data centric research backed by healthcare educational background. She leverages extensive data mining and analytics tools such as Primary and Secondary Research, Statistical Analysis, Machine Learning, Data Modelling. Her key role also involves Technical Sales Support, Client Interaction and Project management within the Healthcare team. Lastly, she showcases extensive affinity towards learning new skills and remain fascinated in implementing them.
Co-Author
Co-Author Profile
Rahul Gotadki LinkedIn
Research Manager
He holds an experience of about 9+ years in Market Research and Business Consulting, working under the spectrum of Life Sciences and Healthcare domains. Rahul conceptualizes and implements a scalable business strategy and provides strategic leadership to the clients. His expertise lies in market estimation, competitive intelligence, pipeline analysis, customer assessment, etc.

Research Approach


Secondary Research

The secondary research process involved comprehensive analysis of regulatory filings, clinical trial registries, pharmacovigilance databases, and authoritative diabetes epidemiology sources. Key sources included the US Food & Drug Administration (FDA) Center for Drug Evaluation and Research (CDER), European Medicines Agency (EMA) Human Medicines Division, International Diabetes Federation (IDF) Diabetes Atlas (10th Edition), American Diabetes Association (ADA) Standards of Care, National Institute of Diabetes and Digestive and Kidney Diseases (NIDDK), Centers for Disease Control and Prevention (CDC) Division of Diabetes Translation, World Health Organization (WHO) Global Health Observatory Diabetes Country Profiles, NIH/NCBI PubMed (diabetes therapeutics clinical trials), IQVIA National Prescription Audit, FAERS (FDA Adverse Event Reporting System), EudraVigilance, WHO International Clinical Trials Registry Platform, national health ministry databases from high-burden markets (India Ministry of Health, China NMPA, NHS England), and OECD Health Statistics. These sources were used to collect prescription volume data, adverse event profiles, drug approval timelines, epidemiological prevalence statistics, and real-world evidence outcomes for insulin analogues, incretin mimetics, SGLT2 inhibitors, and metabolic combination therapies.


Primary Research

Qualitative and quantitative insights were obtained by interviewing supply-side and demand-side stakeholders during the primary research process. Chief Medical Officers, Heads of Metabolic Disorders R&D, Global Brand Presidents for Diabetes Care, regulatory strategy leads, and biosimilar portfolio directors from innovator pharmaceutical companies, contract manufacturing organizations (CMOs), and insulin/biologics manufacturers comprised supply-side sources. Demand-side sources included board-certified endocrinologists, diabetologists, hospital pharmacy directors, formulary committee chairs, pharmacy benefit managers (PBMs), procurement leads from integrated healthcare networks, and medical directors from diabetes specialty clinics and academic medical centers. Primary research verified the adoption rates of therapeutic classes, verified the launch timelines of biosimilar pipelines, and collected information on the dynamics of prior authorization, reimbursement restrictions, and clinical switching patterns between originator and follow-on biologics.

Primary Respondent Breakdown:

By Designation: C-level Executives (32%), VP/Director Level (33%), Managers/Specialists (35%)

By Region: North America (38%), Europe (28%), Asia-Pacific (24%), Rest of World (10%)


Market Size Estimation

Global market valuation was derived through prescription volume analysis and revenue mapping across therapeutic classes. The methodology included:

Identification of 60+ key manufacturers across North America, Europe, Asia-Pacific, and Latin America, including innovator biopharma, biosimilar developers, and insulin analog producers

Product mapping across insulin (rapid-acting, long-acting, premixed), GLP-1 receptor agonists, SGLT2 inhibitors, DPP-4 inhibitors, biguanides, sulfonylureas, and emerging dual GIP/GLP-1 agonists

Analysis of reported revenues, patient-days of therapy, and average selling prices (ASPs) specific to diabetes portfolios, with adjustments for rebates and discounts

Coverage of manufacturers representing 80-85% of global anti-diabetic pharmaceutical sales in 2024

Extrapolation using bottom-up (prescription volume × net price by country/therapy class) and top-down (manufacturer revenue cross-validation) approaches, with epidemiological burden-to-treatment ratios applied to derive country-specific market penetrations and segment valuations

Key Differentiators from your Dermal Filler Example:

Regulatory Focus: Emphasizes CDER (drug evaluation) rather than device centers, plus pharmacovigilance databases specific to post-market drug safety

Disease Epidemiology Centers: Includes IDF (diabetes-specific) and NIDDK instead of aesthetic surgery societies

Primary Audience: Targets endocrinologists/diabetologists rather than plastic surgeons; adds payers/PBMs crucial in drug access

Tier Thresholds: Adjusted revenue tiers for big pharma (>$50B) reflecting the scale of Novo Nordisk, Eli Lilly, Sanofi vs. aesthetic device companies

Respondent Distribution: Shifted weight toward Director Level (33% vs. 28%) and Managers (35% vs. 37%) to capture specialty therapeutic area insights, with North America weighted higher (38% vs. 35%) due to pricing dominance, and Asia-Pacific adjusted to 24% reflecting market maturity nuances

This methodology ensures robust triangulation of epidemiological burden, real-world prescribing data, and stakeholder intelligence specific to the metabolic therapeutics landscape.

Download Free Sample

Kindly complete the form below to receive a free sample of this Report

Download PDF ×

We do not share your information with anyone. However, we may send you emails based on your report interest from time to time. You may contact us at any time to opt-out.
















