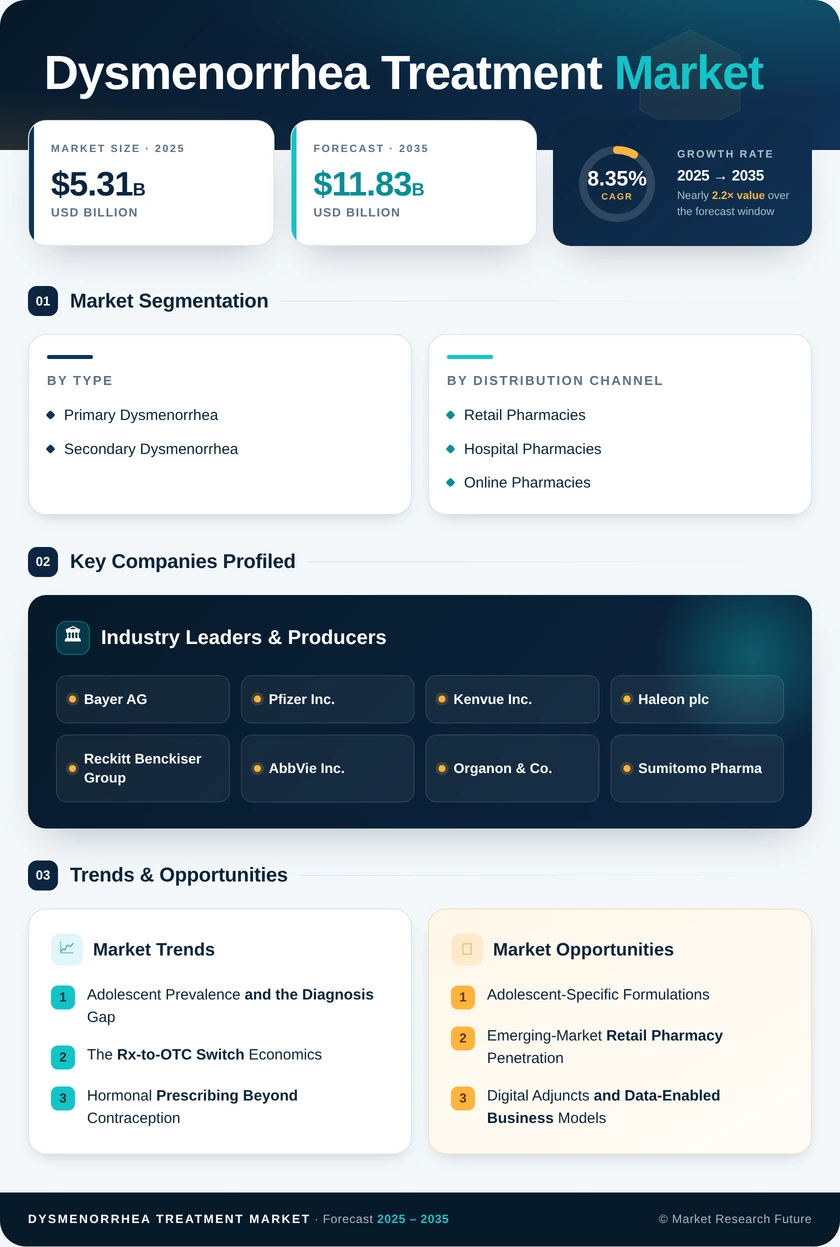
Dysmenorrhea Treatment Market (2026 - 2035)

Dysmenorrhea Treatment Market Research Report Information By Product Type (Primary Dysmenorrhea, Secondary Dysmenorrhea), By Type of Treatment (Pain Relievers, Hormonal Therapy, And Surgery), By End-User (Hospitals & Clinics And Research Centers), And By Region (North America, Europe, Asia-Pacific, And Rest Of The World) – Industry Therapeutics - Forecast Till 2035

Forecast Period
2026-2035
CAGR
8.35%
2025 Market Size
USD 5.31 Billion
2035 Market Size
USD 11.83 Billion
Healthcare ● Updated August 2026 Report ID: MRFR/HC/0256-CR | Pages: 111 | Author: Rahul Gotadki, Nidhi Mandole
  1. 1 Market Summary |
    1. 1.1 Study Assumptions & Market Definition |
    2. 1.2 Scope of the Study |
    3. 1.3 Research Methodology
  2. 2 Key Report Takeaways |
    1. 2.1 By Treatment Type |
    2. 2.2 By Type |
    3. 2.3 By Geography
  3. 3 Market Size & Forecast (2021–2035) |
    1. 3.1 Historical Market Size (2021–2024) |
    2. 3.2 Base Year Estimate (2025) |
    3. 3.3 Forecast Market Size (2026–2035) |
    4. 3.4 Year-over-Year Growth Analysis
  4. 4 Driver Impact Analysis |
    1. 4.1 Adolescent Prevalence and the Diagnosis Gap |
    2. 4.2 The Rx-to-OTC Switch Economics |
    3. 4.3 Hormonal Prescribing Beyond Contraception
  5. 5 Restraints Impact Analysis |
    1. 5.1 Under-Presentation and Cultural Normalisation |
    2. 5.2 Safety Labelling and Formulary Pressure |
    3. 5.3 Price Compression in Mature Channels
  6. 6 Opportunity Analysis |
    1. 6.1 Adolescent-Specific Formulations |
    2. 6.2 Emerging-Market Retail Pharmacy Penetration |
    3. 6.3 Digital Adjuncts and Data-Enabled Business Models |
    4. 6.4 Non-Hormonal Novel Mechanisms |
    5. 6.5 Employer and Payer Menstrual Health Programmes |
    6. 6.6 Industry Value Chain Analysis |
    7. 6.7 Porter's Five Forces Analysis
  7. 7 Regional Market Share & Country-Level Analysis |
    1. 7.1 North America | |
      1. 7.1.1 US | |
      2. 7.1.2 Canada | |
      3. 7.1.3 Mexico |
    2. 7.2 Europe | |
      1. 7.2.1 Germany | |
      2. 7.2.2 UK | |
      3. 7.2.3 France | |
      4. 7.2.4 Italy | |
      5. 7.2.5 Spain | |
      6. 7.2.6 Nordic Countries | |
      7. 7.2.7 Russia | |
      8. 7.2.8 Rest of Europe |
    3. 7.3 Asia-Pacific | |
      1. 7.3.1 China | |
      2. 7.3.2 India | |
      3. 7.3.3 Japan | |
      4. 7.3.4 South Korea | |
      5. 7.3.5 ASEAN | |
      6. 7.3.6 Rest of Asia-Pacific |
    4. 7.4 South America | |
      1. 7.4.1 Brazil | |
      2. 7.4.2 Argentina | |
      3. 7.4.3 Rest of South America |
    5. 7.5 Middle East & Africa | |
      1. 7.5.1 Saudi Arabia | |
      2. 7.5.2 UAE | |
      3. 7.5.3 South Africa | |
      4. 7.5.4 Egypt | |
      5. 7.5.5 Rest of Middle East & Africa
  8. 8 Future Outlook (2026–2035) |
    1. 8.1 Precision Diagnosis and Biomarker Stratification |
    2. 8.2 Platform Economics in Women's Health |
    3. 8.3 Non-Hormonal Innovation Cycle |
    4. 8.4 Health Equity Reporting and Access Mandates
  9. 9 Market Segmentation Analysis |
    1. 9.1 By Treatment Type | |
      1. 9.1.1 Non-Steroidal Anti-Inflammatory Drugs (NSAIDs) | |
      2. 9.1.2 Hormonal Therapy |
    2. 9.2 By Type | |
      1. 9.2.1 Primary Dysmenorrhea | |
      2. 9.2.2 Secondary Dysmenorrhea |
    3. 9.3 By Distribution Channel | |
      1. 9.3.1 Retail Pharmacies | |
      2. 9.3.2 Hospital Pharmacies | |
      3. 9.3.3 Online Pharmacies
  10. 10 Competitive Landscape |
    1. 10.1 Market Concentration Analysis (2026) |
    2. 10.2 Competitive Benchmarking Matrix |
    3. 10.3 Company Profiles | |
      1. 10.3.1 Bayer AG | |
      2. 10.3.2 Pfizer Inc. | |
      3. 10.3.3 Kenvue Inc. | |
      4. 10.3.4 Haleon plc | |
      5. 10.3.5 Reckitt Benckiser Group | |
      6. 10.3.6 AbbVie Inc. | |
      7. 10.3.7 Organon & Co. | |
      8. 10.3.8 Sumitomo Pharma | |
      9. 10.3.9 Teva Pharmaceutical Industries | |
      10. 10.3.10 Viatris Inc. | |
      11. 10.3.11 Gedeon Richter
  11. 11 Recent Developments & News
  12. 12 Report Scope & Methodology |
    1. 12.1 Study Period & Base Year |
    2. 12.2 Data Sources & Citations |
    3. 12.3 Abbreviations
  13. 13 Detailed Sources and Citations
  14. 14 Frequently Asked Questions
  15. 15 LIST OF TABLES |
  16. TABLE 1 Global Dysmenorrhea Treatment Market Size & Forecast, by Revenue (USD Billion), 2021–2035 |
  17. TABLE 2 Global Dysmenorrhea Treatment Market – Year-over-Year Growth Analysis, 2021–2035 |
  18. TABLE 3 Driver Impact Analysis Matrix, 2026–2035 |
  19. TABLE 4 Restraint Impact Analysis Matrix, 2026–2035 |
  20. TABLE 5 Global Dysmenorrhea Treatment Market Size, by Region, 2021–2035 (USD Billion) |
  21. TABLE 6 North America Dysmenorrhea Treatment Market Size, by Country, 2021–2035 (USD Billion) |
  22. TABLE 7 Europe Dysmenorrhea Treatment Market Size, by Country, 2021–2035 (USD Billion) |
  23. TABLE 8 Asia-Pacific Dysmenorrhea Treatment Market Size, by Country, 2021–2035 (USD Billion) |
  24. TABLE 9 South America Dysmenorrhea Treatment Market Size, by Country, 2021–2035 (USD Billion) |
  25. TABLE 10 Middle East & Africa Dysmenorrhea Treatment Market Size, by Country, 2021–2035 (USD Billion) |
  26. TABLE 11 Global Dysmenorrhea Treatment Market Size, by Treatment Type, 2021–2035 (USD Billion) |
  27. TABLE 12 Global Dysmenorrhea Treatment Market Size, by Type, 2021–2035 (USD Billion) |
  28. TABLE 13 Global Dysmenorrhea Treatment Market Size, by Distribution Channel, 2021–2035 (USD Billion) |
  29. TABLE 14 North America Dysmenorrhea Treatment Market Size, by Treatment Type, 2021–2035 (USD Billion) |
  30. TABLE 15 North America Dysmenorrhea Treatment Market Size, by Type, 2021–2035 (USD Billion) |
  31. TABLE 16 Europe Dysmenorrhea Treatment Market Size, by Treatment Type, 2021–2035 (USD Billion) |
  32. TABLE 17 Europe Dysmenorrhea Treatment Market Size, by Type, 2021–2035 (USD Billion) |
  33. TABLE 18 Asia-Pacific Dysmenorrhea Treatment Market Size, by Treatment Type, 2021–2035 (USD Billion) |
  34. TABLE 19 Asia-Pacific Dysmenorrhea Treatment Market Size, by Type, 2021–2035 (USD Billion) |
  35. TABLE 20 South America Dysmenorrhea Treatment Market Size, by Treatment Type, 2021–2035 (USD Billion) |
  36. TABLE 21 Middle East & Africa Dysmenorrhea Treatment Market Size, by Treatment Type, 2021–2035 (USD Billion) |
  37. TABLE 22 US Dysmenorrhea Treatment Market Size, by Distribution Channel, 2021–2035 (USD Billion) |
  38. TABLE 23 China Dysmenorrhea Treatment Market Size, by Distribution Channel, 2021–2035 (USD Billion) |
  39. TABLE 24 India Dysmenorrhea Treatment Market Size, by Distribution Channel, 2021–2035 (USD Billion) |
  40. TABLE 25 Competitive Benchmarking Matrix – Global Dysmenorrhea Treatment Market, 2026 |
  41. TABLE 26 Company Profiles – Key Players, Global Dysmenorrhea Treatment Market |
  42. TABLE 27 Recent Developments & Strategic Announcements, 2023–2025 |
  43. TABLE 28 Report Scope & Methodology Summary |
  44. TABLE 29 Detailed Sources and Citations Index |
  45. TABLE 30 Segmentation Quick Reference – Dominant and Fastest Growing Segments
  46. 16 LIST OF FIGURES |
  47. FIGURE 1 Global Dysmenorrhea Treatment Market Dynamics – Drivers, Restraints, Opportunities |
  48. FIGURE 2 Industry Value Chain Analysis – Dysmenorrhea Treatment |
  49. FIGURE 3 Porter's Five Forces Analysis – Dysmenorrhea Treatment |
  50. FIGURE 4 Global Market Size Trend Line, 2021–2035 (USD Billion) |
  51. FIGURE 5 Year-over-Year Growth Curve, 2022–2035 (%) |
  52. FIGURE 6 Market Share by Treatment Type, 2025 vs 2035 (%) |
  53. FIGURE 7 Market Share by Type, 2025 vs 2035 (%) |
  54. FIGURE 8 Market Share by Distribution Channel, 2025 vs 2035 (%) |
  55. FIGURE 9 Regional Market Share Distribution, 2025 (%) |
  56. FIGURE 10 Regional Market Share Distribution, 2035 (%) |
  57. FIGURE 11 Regional CAGR Comparison, 2026–2035 (%) |
  58. FIGURE 12 North America Country-Level Share Breakdown, 2025 (%) |
  59. FIGURE 13 Europe Country-Level Share Breakdown, 2025 (%) |
  60. FIGURE 14 Asia-Pacific Country-Level Share Breakdown, 2025 (%) |
  61. FIGURE 15 Competitive Landscape – Estimated Revenue Share Bands, 2026 |
  62. FIGURE 16 Competitive Positioning Matrix – Portfolio Breadth vs Specialty Focus |
  63. FIGURE 17 Driver Impact Contribution Chart, 2026–2035 |
  64. FIGURE 18 Restraint Impact Contribution Chart, 2026–2035 |
  65. FIGURE 19 Future Outlook Roadmap, 2026–2035 |
  66. FIGURE 20 Diagnosis Penetration vs Treatment Value Curve by Region
Share::
Request Free Sample

Segmentation Quick Reference

DimensionSub-SegmentsDominant SegmentFastest Growing Segment
By Treatment TypeNon-Steroidal Anti-Inflammatory Drugs (NSAIDs); Hormonal TherapyNon-Steroidal Anti-Inflammatory Drugs (NSAIDs)Hormonal Therapy
By TypePrimary Dysmenorrhea; Secondary DysmenorrheaPrimary DysmenorrheaSecondary Dysmenorrhea
By Distribution ChannelRetail Pharmacies; Hospital Pharmacies; Online PharmaciesRetail PharmaciesOnline Pharmacies
By GeographyNorth America; Europe; Asia-Pacific; South America; Middle East & AfricaNorth AmericaAsia-Pacific


Market Segmentation Overview

By Treatment Type

Sub-SegmentKey Trend
Non-Steroidal Anti-Inflammatory Drugs (NSAIDs)Volume leadership sustained by OTC access, offset by tender-driven price erosion and duration-of-therapy caps.
Hormonal TherapyIndication repositioning from contraception to pain, with GnRH antagonists anchoring the premium tier


Treatment type is the axis where volume and value diverge most sharply. NSAIDs will still dispense the overwhelming majority of units in 2035, but hormonal regimens will have closed most of the revenue gap. Manufacturers holding assets on only one side of that divide face a structural disadvantage.

By Type

Sub-SegmentKey Trend
Primary DysmenorrheaDemographic-driven, stable growth with high repeat purchase across a long patient lifespan
Secondary DysmenorrheaDiagnosis-driven expansion as endometriosis and fibroid identification accelerates.


Type segmentation is effectively a diagnostic-capacity story. Every advance in imaging access or biomarker validation reclassifies patients from the primary bucket into the secondary one, lifting average revenue per patient without adding a single new consumer to the category.

By Distribution Channel

Sub-SegmentKey Trend
Retail PharmaciesRemains the default access point, benefiting from organised chain expansion in emerging economies
Hospital PharmaciesConcentrates specialist-initiated hormonal and antagonist therapy with the highest per-script value.
Online PharmaciesFastest expansion, powered by telehealth prescribing and patient preference for discretion


Channel dynamics reward discretion and convenience in roughly equal measure. Online growth outpaces every other sub-segment across all three dimensions, though regulatory tightening in Brazil and India has moved the model toward licensed domestic partnership rather than direct fulfilment.

By Region

Sub-SegmentKey Trend
North AmericaHighest value density; specialty tier access and employer benefits design drive per-patient revenue
EuropeStrong diagnosis rates constrained by reference pricing and tender-based procurement.
Asia-PacificSteepest growth curve on retail pharmacy buildout and improving policy attention
South AmericaModerate growth shaped by public formulary listings and e-pharmacy regulation
Middle East & AfricaSmallest base; clinic capacity is expanding faster than patient presentation


Geographic weighting will shift meaningfully over the forecast window. North America retains leadership through 2035, but its share erodes by several points as Asia-Pacific converts pharmacy access into diagnosed, treated demand.




Share::
Request Free Sample
Download PDF ×

We do not share your information with anyone. However, we may send you emails based on your report interest from time to time. You may contact us at any time to opt-out.