Download Free Sample
Kindly complete the form below to receive a free sample of this Report
E-learning and Online Education Services Market Size, Share and Trends Analysis Research Report Information By End User (Students, Educators, Corporate Employees, Educational Institutions, Government Agencies), By Technology (Learning Management Systems, Artificial Intelligence, Augmented Reality, Virtual Reality, Mobile Applications), By Application (Corporate Training, Higher Education, K-12 Education, Professional Development, Language Learning), By Content Type (Video Lectures, Interactive Quizzes, E-books, Webinars, Discussion Forums), By Delivery Mode (Synchronous, Asynchronous, Blended, Mobile Learning, Virtual Classrooms), And By Region – Market Forecast Till 2035.
As per MRFR analysis, the E-learning and Online Education Services Market was estimated at 300.0 USD Billion in 2024. The E-learning industry is projected to grow from 319.5 USD Billion in 2025 to 600.0 USD Billion by 2035, exhibiting a compound annual growth rate (CAGR) of 6.5% during the forecast period 2025 - 2035.
The E-learning and Online Education Services Market is experiencing robust growth driven by technological advancements and evolving educational needs.
| 2024 Market Size | 300.0 (USD Billion) |
| 2035 Market Size | 600.0 (USD Billion) |
| CAGR (2025 - 2035) | 6.5% |
Coursera (US), Udacity (US), edX (US), LinkedIn Learning (US), Skillshare (US), Khan Academy (US), Pluralsight (US), FutureLearn (GB), Teachable (US), MasterClass (US)
Our Impact
Enabled $4.3B Revenue Impact for Fortune 500 and Leading Multinationals
Partnering with 2000+ Global Organizations Each Year
30K+ Citations by Top-Tier Firms in the Industry
The E-learning and Online Education Services Market is currently experiencing a transformative phase, characterized by rapid technological advancements and evolving consumer preferences. The integration of artificial intelligence and machine learning into educational platforms appears to enhance personalized learning experiences, catering to diverse learner needs. Furthermore, the proliferation of mobile devices and high-speed internet access facilitates greater accessibility, allowing learners from various backgrounds to engage with educational content seamlessly. This shift towards digital learning environments suggests a growing acceptance of online education as a viable alternative to traditional classroom settings. Moreover, the increasing demand for upskilling and reskilling in the workforce indicates a shift in focus towards lifelong learning. Organizations and individuals alike seem to recognize the necessity of continuous education to remain competitive in an ever-changing job market. As a result, the E-learning and Online Education Services Market is likely to expand, driven by innovative course offerings and flexible learning solutions. This evolution not only reflects changing educational paradigms but also highlights the potential for growth in various sectors, including corporate training and professional development.
The trend towards personalized learning experiences is gaining traction within the E-learning and Online Education Services Market. By leveraging advanced technologies, educational platforms can tailor content to meet individual learner preferences and pace, thereby enhancing engagement and retention.
Mobile learning solutions are becoming increasingly prevalent, as learners seek flexibility in accessing educational resources. The rise of smartphones and tablets enables users to engage with course materials anytime and anywhere, fostering a more adaptable learning environment.
There is a notable emphasis on lifelong learning, driven by the need for continuous skill development in the workforce. This trend reflects a broader recognition of the importance of ongoing education, prompting both individuals and organizations to invest in E-learning and Online Education Services.
The E-learning and Online Education Services Market is significantly influenced by the globalization of education. As educational institutions expand their reach beyond borders, learners are increasingly seeking international courses and programs. This trend is facilitated by advancements in technology, which enable seamless access to educational resources from anywhere in the world. Data indicates that the number of international students enrolling in online programs has risen by over 30 percent in recent years. This globalization not only enriches the learning experience but also fosters cultural exchange and collaboration among students from diverse backgrounds. Consequently, the E-learning and Online Education Services Market is poised for growth as it caters to a more interconnected and diverse learner population.
The E-learning and Online Education Services Market is experiencing a surge in technological advancements that enhance the learning experience. Innovations such as artificial intelligence, virtual reality, and augmented reality are being integrated into educational platforms, providing immersive and interactive learning environments. According to recent data, the adoption of AI in education is projected to grow at a compound annual growth rate of 45 percent, indicating a strong trend towards personalized learning. These technologies not only facilitate better engagement but also cater to diverse learning styles, making education more accessible and effective. As institutions increasingly adopt these technologies, the E-learning and Online Education Services Market is likely to expand, attracting more learners and educators alike.
The E-learning and Online Education Services Market is benefiting from various government initiatives aimed at promoting online education. Many governments are recognizing the importance of digital learning in enhancing educational access and quality. Initiatives such as funding for online programs, partnerships with educational institutions, and the development of digital infrastructure are becoming increasingly common. For instance, several countries have allocated significant budgets to support the integration of technology in education. These efforts are likely to bolster the E-learning and Online Education Services Market, as they create a conducive environment for the growth of online learning platforms and services, ultimately leading to improved educational outcomes.
The E-learning and Online Education Services Market is increasingly focused on skill development, reflecting the changing needs of the workforce. As industries evolve, there is a pressing need for continuous learning and upskilling. Reports indicate that over 60 percent of employers prioritize candidates with relevant skills over formal degrees. This trend has prompted educational providers to offer targeted courses that equip learners with practical skills applicable in the job market. The rise of micro-credentials and short courses is a testament to this shift, as they provide learners with the opportunity to gain specific competencies quickly. Thus, the E-learning and Online Education Services Market is adapting to these demands, ensuring that educational offerings align with industry requirements.
The E-learning and Online Education Services Market is witnessing a notable increase in demand for flexible learning options. As individuals seek to balance work, family, and education, the need for adaptable learning solutions has become paramount. Data suggests that approximately 70 percent of learners prefer online courses that allow them to study at their own pace. This shift towards flexibility is driving educational institutions to develop more online programs and courses that cater to various schedules and lifestyles. Consequently, the E-learning and Online Education Services Market is evolving to meet these demands, offering a plethora of options that empower learners to pursue their educational goals without the constraints of traditional classroom settings.
The E-learning and Online Education Services Market is diversely segmented, with Corporate Training segment holding the largest share, driven by the growing need for continuous skill development within organizations. Higher Education also constitutes a significant portion, as universities increasingly adopt online platforms for their programs. K-12 Education, while currently smaller in market share, is witnessing rapid adoption as schools integrate digital tools into classrooms to enhance learning experiences. Professional Development and Language Learning segments contribute to the overall growth, catering to adults seeking to improve skills and language proficiency respectively.
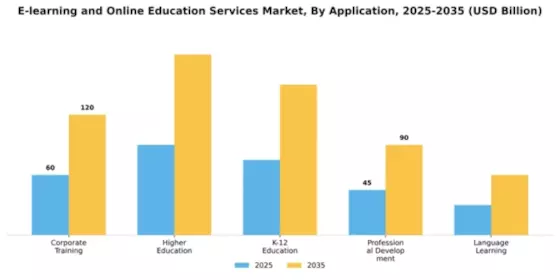
Corporate Training (Dominant) vs. K-12 Education (Emerging)
Corporate Training stands as a dominant force in the E-learning sector, characterized by extensive programs tailored for employee development and management training. Companies recognize the value of online platforms for cost-effective and scalable training solutions. In contrast, K-12 Education is an emerging segment, increasingly favored by younger generations who are digital natives. Schools are rapidly adopting online learning tools, driven by the necessity for flexible learning solutions. This segment focuses on engaging younger audiences through interactive content and gamification, making education more accessible and enjoyable. The integration of technology in both segments signifies a transformative shift in how learning is delivered.
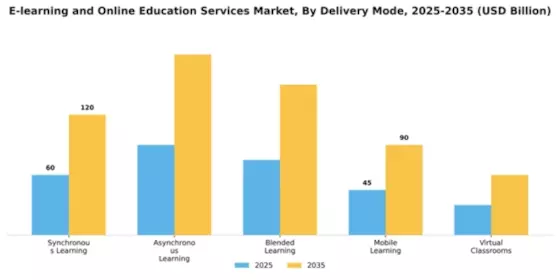
The 'Delivery Mode' segment in the E-learning and Online Education Services Market showcases a diverse distribution among its various components. Synchronous learning, characterized by real-time interaction between instructors and students, leads the market in share, appealing to traditional learning preferences. In contrast, asynchronous learning is gaining traction swiftly, favored for its flexibility, allowing learners to engage at their convenience. Blended and mobile learning are also notable, contributing to user engagement and diverse learning experiences.
Synchronous Learning (Dominant) vs. Asynchronous Learning (Emerging)
Synchronous learning stands as the dominant delivery mode in the E-learning and Online Education Services Market, offering real-time interaction that fosters immediate feedback and community. Its real-time classes, webinars, and live discussions cater to students seeking instant connectivity with educators. On the other hand, asynchronous learning, while emerging, is quickly becoming a favored alternative. Its ability to provide content anytime, anywhere allows students to learn at their own pace, making it particularly attractive to busy professionals and international learners. As these learning modes evolve, they continuously push the boundaries of how education is delivered online, catering to varied learning preferences.
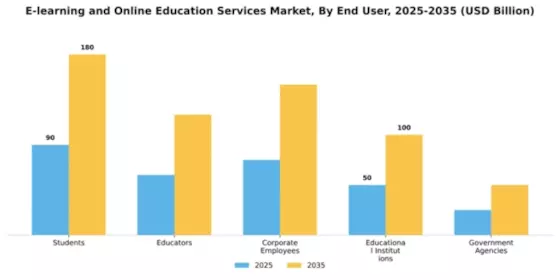
The E-learning and Online Education Services Market is distinctly segmented by various end users: Students, Educators, Corporate Employees, Educational Institutions, and Government Agencies. Among these segments, Students hold the largest market share due to their widespread adoption of online platforms for learning, especially in the wake of global shifts towards remote education. The trend has solidified their dominant position, as they continuously seek flexible and accessible learning solutions tailored to diverse educational needs. On the other hand, Educators are identified as the fastest-growing segment within the market. This growth can be attributed to the increasing shift towards digital teaching tools, professional development opportunities, and the necessity for educators to adapt to new instructional modalities. As they embrace innovative e-learning platforms, this segment is not only growing in numbers but also in ancillary services that enhance teaching effectiveness and student engagement.
Students: Dominant vs. Educators: Emerging
The Students segment in the E-learning and Online Education Services Market is characterized by its broad participation across various educational levels—from primary school to higher education. Their predominant use of mobile devices and the internet facilitates extensive access to a multitude of online courses, resources, and interactive learning tools. This dominance is complemented by a growing acceptance of digital credentials, which underscores the demand for personalized education. Conversely, the Educators segment represents an emerging force, driven by the increasing need for professional growth and the integration of technology in teaching. This group is rapidly adopting e-learning solutions that support skills enhancement and methodical pedagogy. As educators seek innovative techniques to engage students, this segment is expected to expand significantly, offering a range of services and tools designed to promote effective learning outcomes.
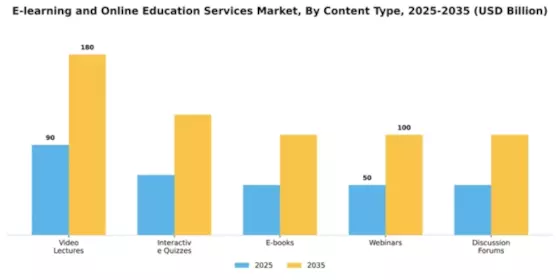
In the E-learning and Online Education Services Market, video lectures hold the largest share, dominating content consumption due to their effectiveness in delivering information in an engaging format. This segment's prominence is attributed to the increasing preference for visual learning, making it the go-to option for institutions and learners alike. Interactive quizzes, on the other hand, represent the fastest-growing segment, appealing to the gamification trend and the need for measurable learning outcomes. Their ability to enhance user engagement and retention places them at the forefront of content innovation in online education. The growth trends within this segment show a clear shift toward interactive and multimedia content. Video lectures are evolving with advancements in technology that allow for better quality and integration of multimedia features, making them indispensable for online courses. Interactive quizzes are gaining traction as educational providers recognize the benefits of active learning techniques. As such, both content types are crucial to the future of e-learning, with video lectures providing foundational knowledge and interactive quizzes enhancing the learning experience through immediacy and feedback.
Video Lectures (Dominant) vs. Webinars (Emerging)
Video lectures are the dominant content type in the E-learning and Online Education Services Market, often utilized in a wide variety of courses due to their accessibility and efficiency in conveying complex information. Their popularity is fueled by the ability to reach a large audience simultaneously, providing a structured learning path. In contrast, webinars are considered an emerging content type, offering real-time engagement between instructors and learners. The interactive nature of webinars fosters a community feel among participants, making them ideal for topics that benefit from discussion and feedback. Both content types serve distinct roles, with video lectures offering pre-recorded, self-paced learning, while webinars provide live, collaborative opportunities, making them vital in the diverse ecosystem of online education.
In the E-learning and Online Education Services Market, Learning Management Systems (LMS) hold the largest share due to their widespread adoption in educational institutions and corporate training programs. They provide an efficient platform for managing and delivering educational content, which enhances accessibility and engagement. Meanwhile, Artificial Intelligence (AI) is rapidly growing as a key segment. AI-driven solutions are enhancing personalization and engagement in the learning process, making education more adaptive to individual needs.
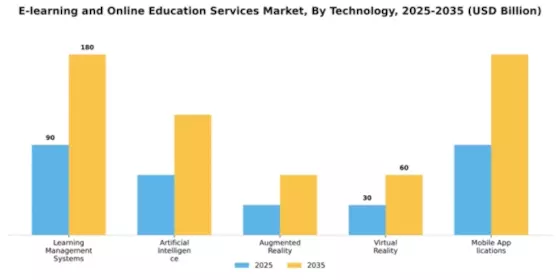
Technology: LMS (Dominant) vs. AI (Emerging)
Learning Management Systems are the cornerstone of e-learning platforms, enabling instructors to deliver content effectively while tracking student engagement and performance. They offer features such as course management, assessment tools, and user analytics, making them indispensable for schools and organizations invested in online education. On the other hand, Artificial Intelligence is emerging as a transformative force within this sector, providing adaptive learning environments and intelligent tutoring systems. AI applications cater to diverse learning styles, facilitating customized learning experiences that can enhance student outcomes. Together, these segments portray a dynamic landscape where established technologies combine with innovative advancements to reshape the future of education.
Get more detailed insights about E-learning and Online Education Services Market Request Free Sample
North America continues to lead the E-learning and Online Education Services Market, holding a significant market share of 120.0 in 2024. The region's growth is driven by increasing demand for flexible learning solutions, technological advancements, and a strong emphasis on lifelong learning. Regulatory support for online education initiatives further catalyzes this growth, making it a hub for innovation in educational technology. The competitive landscape is robust, with key players such as Coursera, Udacity, and edX dominating the market. The presence of major tech companies and educational institutions enhances the region's appeal, fostering partnerships that drive course offerings and accessibility. As the market evolves, North America is expected to maintain its leadership position, continually adapting to the needs of learners and educators alike.
Europe is rapidly emerging as a significant player in the E-learning and Online Education Services Market, with a market size of 80.0 in 2024. The region benefits from a diverse population eager for accessible education, alongside supportive government policies promoting digital learning. The increasing integration of technology in traditional education systems is a key driver of this growth, enhancing the overall learning experience. Leading countries such as Germany, the UK, and France are at the forefront of this transformation, with numerous platforms like FutureLearn and Teachable gaining traction. The competitive landscape is characterized by a mix of established players and innovative startups, all vying for a share of the growing market. As Europe continues to invest in digital education, it is poised for sustained growth in the coming years.
Asia-Pacific is witnessing a remarkable expansion in the E-learning and Online Education Services Market, with a market size of 85.0 in 2024. The region's growth is fueled by a large, tech-savvy population and increasing internet penetration, which drives demand for online learning solutions. Government initiatives aimed at improving educational access and quality further bolster this trend, making E-learning a viable option for many learners. Countries like China, India, and Australia are leading the charge, with numerous platforms catering to diverse educational needs. The competitive landscape is vibrant, featuring both local and international players, including established names and emerging startups. As the region continues to embrace digital education, it is set to become a key player in the global E-learning market.
The Middle East and Africa region is gradually developing its E-learning and Online Education Services Market, with a market size of 15.0 in 2024. The growth is driven by increasing smartphone penetration and a young population eager for educational opportunities. Governments are recognizing the importance of digital education, leading to initiatives aimed at enhancing online learning access and quality across the region. Countries like South Africa and the UAE are making strides in adopting E-learning solutions, with various platforms emerging to meet local educational needs. The competitive landscape is still in its infancy, but the presence of international players is beginning to shape the market. As investments in technology and infrastructure grow, the region is poised for significant advancements in online education.
The E-learning and Online Education Services Market is characterized by a dynamic competitive landscape, driven by rapid technological advancements and an increasing demand for flexible learning solutions. Major players such as Coursera (US), Udacity (US), and edX (US) are strategically positioned to leverage their extensive course offerings and partnerships with prestigious institutions. These companies focus on innovation and digital transformation, enhancing user experience through personalized learning paths and adaptive technologies. Their collective strategies not only foster competition but also contribute to a more robust market environment, where the emphasis is on quality and accessibility of education.In terms of business tactics, companies are increasingly localizing their content to cater to diverse learner demographics, optimizing their supply chains to ensure timely delivery of educational resources. The market appears moderately fragmented, with a mix of established players and emerging startups. This structure allows for a variety of educational approaches, fostering competition that encourages continuous improvement and innovation among key players.In November Coursera (US) announced a partnership with several leading universities to expand its offerings in artificial intelligence and machine learning courses. This strategic move is likely to enhance Coursera's position as a leader in tech-focused education, responding to the growing demand for skills in these critical areas. By aligning with academic institutions, Coursera not only broadens its course catalog but also reinforces its credibility in the market.In October Udacity (US) launched a new initiative aimed at providing free access to its foundational courses for underprivileged communities. This initiative reflects a commitment to social responsibility and inclusivity, potentially attracting a wider audience and enhancing brand loyalty. By addressing educational disparities, Udacity positions itself as a socially conscious player in the market, which may resonate well with learners seeking meaningful educational experiences.In September edX (US) introduced a subscription model that allows learners to access a wide range of courses for a fixed monthly fee. This innovative pricing strategy could disrupt traditional payment models in the E-learning sector, making education more affordable and accessible. By offering a subscription service, edX may attract a broader audience, particularly those who prefer flexibility in their learning journeys.As of December current trends in the E-learning and Online Education Services Market indicate a strong focus on digitalization, sustainability, and the integration of artificial intelligence. Strategic alliances among companies are shaping the competitive landscape, fostering collaboration that enhances educational offerings. Looking ahead, competitive differentiation is likely to evolve, with a shift from price-based competition to a focus on innovation, technology, and supply chain reliability. This transition suggests that companies will need to invest in cutting-edge technologies and sustainable practices to maintain their competitive edge.






The E-learning and Online Education Services Market is projected to grow at a 6.5% CAGR from 2025 to 2035, driven by technological advancements, increasing demand for flexible learning, and globalization of education.
New opportunities lie in:
By 2035, the market is expected to be robust, reflecting substantial growth and innovation.
| MARKET SIZE 2024 | 300.0(USD Billion) |
| MARKET SIZE 2025 | 319.5(USD Billion) |
| MARKET SIZE 2035 | 600.0(USD Billion) |
| COMPOUND ANNUAL GROWTH RATE (CAGR) | 6.5% (2025 - 2035) |
| REPORT COVERAGE | Revenue Forecast, Competitive Landscape, Growth Factors, and Trends |
| BASE YEAR | 2024 |
| Market Forecast Period | 2025 - 2035 |
| Historical Data | 2019 - 2024 |
| Market Forecast Units | USD Billion |
| Key Companies Profiled | Coursera (US), Udacity (US), edX (US), LinkedIn Learning (US), Skillshare (US), Khan Academy (US), Pluralsight (US), FutureLearn (GB), Teachable (US), MasterClass (US) |
| Segments Covered | Application, Delivery Mode, End User, Content Type, Technology |
| Key Market Opportunities | Integration of artificial intelligence enhances personalized learning experiences in the E-learning and Online Education Services Market. |
| Key Market Dynamics | Rising demand for personalized learning experiences drives innovation and competition in the E-learning and Online Education Services Market. |
| Countries Covered | North America, Europe, APAC, South America, MEA |
The market valuation reached 300.0 USD Billion in 2024.
The market is expected to grow to 600.0 USD Billion by 2035.
The market is anticipated to experience a CAGR of 6.5% from 2025 to 2035.
Key players include Coursera, Udacity, edX, LinkedIn Learning, Skillshare, Khan Academy, Pluralsight, FutureLearn, Teachable, and MasterClass.
The main applications include Corporate Training, Higher Education, K-12 Education, Professional Development, and Language Learning.
The market segments by delivery mode into Synchronous Learning, Asynchronous Learning, Blended Learning, Mobile Learning, and Virtual Classrooms.
End users primarily consist of Students, Educators, Corporate Employees, Educational Institutions, and Government Agencies.
Common content types include Video Lectures, Interactive Quizzes, E-books, Webinars, and Discussion Forums.
The market is driven by technologies such as Learning Management Systems, Artificial Intelligence, Augmented Reality, Virtual Reality, and Mobile Applications.
The Corporate Training segment is projected to grow from 60.0 USD Billion in 2024 to 120.0 USD Billion by 2035.


Kindly complete the form below to receive a free sample of this Report

“This is really good guys. Excellent work on a tight deadline. I will continue to use you going forward and recommend you to others. Nice job”


“Thanks. It’s been a pleasure working with you, please use me as reference with any other Intel employees.”


“Thanks for sending the report it gives us a good global view of the Betaïne market.”


“Thank you, this will be very helpful for OQS.”


“We found the report very insightful! we found your research firm very helpful. I'm sending this email to secure our future business.”


“I am very pleased with how market segments have been defined in a relevant way for my purposes (such as "Portable Freezers & refrigerators" and "last-mile"). In general the report is well structured. Thanks very much for your efforts.”


“I have been reading the first document or the study, ,the Global HVAC and FP market report 2021 till 2026. Must say, good info! I have not gone in depth at all parts, but got a good indication of the data inside!”


“We got the report in time, we really thank you for your support in this process. I also thank to all of your team as they did a great job.”


“The Automotive 48V ECU Components Procurement Intelligence Study” was a complex project, but the Market Research Future (MRFR) team handled it with quality, agility, and customer-centricity. They delivered all requested data on time and within the agreed scope. The team, including Shubhendra Anand and Rahul Gotadki, was always readily available to clarify questions and swiftly implement necessary adjustments, driving the project to a successful conclusion within a very demanding timeframe.
I would also like to specifically commend Akshay Agarwal for his responsiveness and support at every stage—from our initial inquiry on May 6th through to final delivery on June 18th. His dedication made the entire process seamless.”



