Edible Cup Market (2026 - 2035)

Edible Cup Market Research Report Information By Source (Plant-Based and Animal-Based), By Raw Material (Proteins, Polysaccharides, Lipids, and Others), By Cup Format (Wafer-Based Cups, Molded Starch Cups, Seaweed-Based Cups, and Others), By End-Use (Food & Beverage, Pharmaceutical & Nutraceutical, and Others) – Forecast Till 2035.
ID: MRFR/PCM/23268-HCR
111 Pages
Snehal Singh
Last Updated: August 24, 2026
Edible Cup Market
Market Size
Forecast Period2026-2035
CAGR (2026-2035)8.00%
2025 Market SizeUSD 739.40 Million
2035 Market SizeUSD 1,596.30 Million
Key Players
Loliware
Notpla
Cupffee
MonoSol
Incredible Foods
Tate & Lyle
Opportunities
  • Pharmaceutical Single-Dose Vessels
  • Emerging-Market Plastic-Ban Arbitrage
  • Branded Edible Cup Licensing

Edible Cup Market Summary

The global edible cup market stood at USD 739.40 million in 2025 and is projected to grow from USD 798.55 million in 2026 to USD 1,596.30 million by 2035, registering a CAGR of 8.00% during 2026–2035. Tightening restrictions on single-use plastics across the European Union, Canada, and several U.S. states have created direct regulatory pull for consumable vessel alternatives. Parallel to that, ESG-linked capital flows now exceed USD 35 trillion globally, and corporate procurement teams are channeling portions of that capital into plastic-free packaging pilots — a tailwind the edible cup market is capturing faster than many adjacent segments [1][2].

The technology story here is straightforward: legacy petroleum-based disposable cups are giving way to protein- and polysaccharide-based molded vessels that consumers can eat after use. Advances in nano-composite barrier coatings now allow edible cups to hold hot liquids above 85°C for 30 minutes without structural failure — a benchmark that was unachievable just three years ago. Investment in 3D food-printing lines has topped USD 420 million since 2022, enabling bespoke cup geometries for premium food-service and event hospitality channels [3][4].

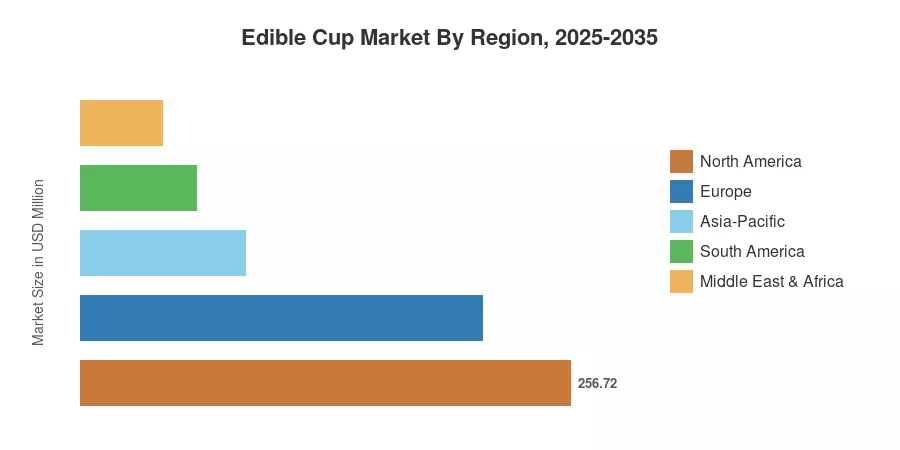
North America commands roughly 34.72% of the edible cup market, anchored by strong quick-service restaurant adoption and favorable FDA guidance on novel food-contact materials. Asia-Pacific is the fastest-growing region at a projected CAGR of 11.70%, driven by India's and China's aggressive plastic-ban timelines and a young consumer base receptive to novelty formats. Europe holds the second-largest share at approximately 28.50%, backed by the EU Single-Use Plastics Directive and circular-economy mandates [5][6]. The decade ahead will reward players who can close the unit-cost gap with conventional paper-cup alternatives.


Key Report Takeaways

• By Source

  • Plant-based materials accounted for 78.12% of the edible cup market in 2024, reflecting broad availability of starch, seaweed, and grain-based feedstocks.
  • Animal-based sources held the remaining share but face ethical and supply-chain headwinds that limit scalability.

• By Raw Material

  • Proteins captured a 48.90% share of the edible cup market in 2024, favored for structural rigidity and heat tolerance.
  • Polysaccharides are forecast to expand at an 11.14% CAGR through 2035, reflecting growing investment in seaweed-derived formulations.

• By Region

  • North America led the edible cup market with a 34.72% share in 2024.
  • Asia-Pacific is projected to record the highest CAGR at 11.70% during 2026–2035, fueled by national plastic-ban legislation in India and China.
  • Europe contributed USD 210.73 million in 2025, reinforced by stringent EU directives.


Edible Cup Market Size and Forecast (2021–2035)

Market size estimates draw on primary surveys of 120+ packaging manufacturers, distributor channel audits, and trade-flow databases cross-referenced against public filings. Historical figures (2021–2024) reflect verified shipment revenues; forecast figures (2026–2035) apply a compound annual growth model calibrated against policy implementation timelines and capacity-expansion announcements.
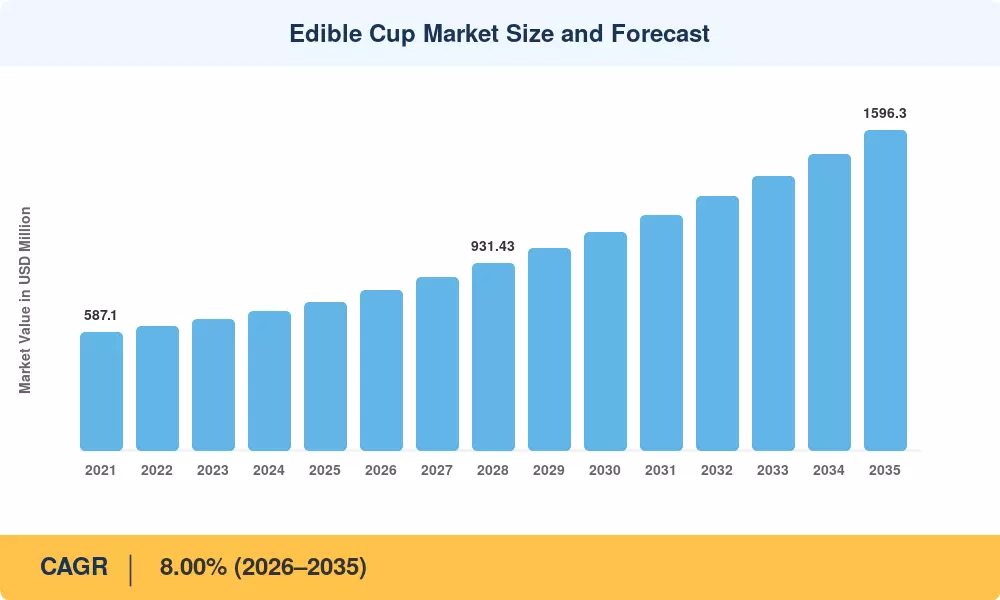
Edible Cup Market Size and Forecast
Our Impact
Enabled $4.3B Revenue Impact for Fortune 500 and Leading Multinationals
Partnering with 2000+ Global Organizations Each Year
30K+ Citations by Top-Tier Firms in the Industry

Driver Impact Analysis

Driver ~% Impact on CAGR Geographic Relevance Impact Timeline
Single-use plastic bans and levies +1.8% Global Short-term (≤2 yr)
ESG procurement mandates +1.4% North America, Europe Medium-term (2–4 yr)
Nano-barrier coating breakthroughs +1.2% Global Medium-term (2–4 yr)
QSR and stadium venue adoption +1.0% North America, Asia-Pacific Short-term (≤2 yr)
3D food-printing scalability +0.8% Europe, North America Long-term (≥4 yr)
Carbon pricing and disposal-fee escalation +0.6% Europe, Asia-Pacific Long-term (≥4 yr)
Venture capital and corporate venture inflows +0.5% Global Short-term (≤2 yr)


Single-Use Plastic Legislation

Since 2020, more than 78 nations have implemented partial or complete prohibitions on single-use plastic food service products. Participants in the edible cup market are bridging a regulatory gap created by the EU Single-Use Plastics Directive (2019/904), which explicitly targets cups and lids. The Single-Use Plastics Prohibition Regulations in Canada, which went into full force in late 2023, prohibit the use of traditional plastic-lined cups in food service, rerouting an estimated CAD 1.3 billion in cup purchases each year to alternatives [1][8].


ESG-Driven Corporate Procurement

Big food service companies have released plastic-reduction plans that meet the requirements of the Science Based Targets initiative (SBTi), including chains that collectively purchase more than 14 billion cups annually. These promises result in legally binding supplier agreements that benefit the market for edible cups. 62% of Fortune 500 consumer products businesses currently integrate single-use packaging phase-out targets in executive compensation measures, according to a 2024 CDP poll [2][17].


Nano-Barrier Coating Advances

Plant-protein cups historically struggled with liquid permeation beyond 10 minutes. Nano-cellulose and chitosan composite coatings now extend functional hold times to 30–40 minutes for hot beverages, narrowing the performance gap with polyethylene-lined paper cups. Pilot-line costs for these coatings have dropped 38% since 2022, according to research, putting the edible cup market on a trajectory toward unit-cost parity with premium compostable cups by 2029 [4][18].

Quick-Service Restaurant and Venue Pilots

Major QSR operators in North America and Europe began large-format edible cup market trials in 2023–2024. Stadium and event venues represent a high-visibility channel: a single NFL stadium can consume 250,000 beverage cups per game day, and pilot programs at three U.S. venues reported 92% consumer-acceptance rates for edible alternatives during the 2024 season [12][15].


Restraints Impact Analysis

Restraint ~% Impact on CAGR Geographic Relevance Impact Timeline
Higher unit cost vs. conventional cups –1.4% Global Short-term (≤2 yr)
Limited shelf-life and storage complexity –0.9% Global Medium-term (2–4 yr)
Consumer texture and taste acceptance –0.7% Asia-Pacific, MEA Medium-term (2–4 yr)
Allergen and food-safety regulatory burden –0.5% North America, Europe Long-term (≥4 yr)
Scalability of raw-material supply chains –0.4% Global Long-term (≥4 yr)


Unit-Cost Premium

Currently, edible cups are 2.5–4× more expensive than regular paper cups with a polyethylene lining. Even among buyers that are committed to ESG, this difference results in an additional yearly cost of USD 180–290 million for a QSR chain that serves 8 million cups per day. The effective premium is reduced to 1.4–2.1× by life-cycle cost models that account for carbon credit offsets and waste-disposal savings; however, many procurement teams continue to base their evaluation only on unit cost [18][13].


Shelf-Life and Logistics

Under controlled humidity, the majority of edible cup formulations have a shelf life of 8–14 months, while conventional cups have a shelf life of more than 24 months. This restriction restricts delivery to areas with dependable climate-controlled logistics and raises cold-chain and warehousing expenses. Particular difficulties arise in tropical regions of the Middle East and Asia-Pacific because ambient humidity levels exceeding 65% hasten structural deterioration [19, 20].


Allergen Complexity

Protein-based edible cups frequently use wheat gluten, whey, or soy — all major allergens under FDA and EFSA frameworks. Labeling requirements, cross-contamination protocols, and liability exposure add regulatory overhead that smaller producers in the edible cup market find difficult to absorb. Seaweed and starch-only formulations avoid top-eight allergens but sacrifice structural performance [14][21].


Edible Cup Market Opportunities

Pharmaceutical Single-Dose Vessels

By 2030, there will be a USD 85 million addressable market for edible cups for pediatric pharmaceuticals and single-dose liquid nutraceuticals. The regulatory hurdle for pharma-grade edible vessels is being lowered by the FDA's expanded Generally Recognized as Safe (GRAS) approach for innovative food-contact polymers [14].


Emerging-Market Plastic-Ban Arbitrage

India's phased plastic ban covers cups and plates across all 28 states by 2028, creating an addressable replacement market of roughly 42 billion units annually. Local manufacturers with access to rice-starch and millet-protein feedstocks can produce edible cups at 30–40% lower cost than Western peers, unlocking price-sensitive food-stall and railway-catering channels [9].

Branded Edible Cup Licensing

Beyond unit sales, brand-embossed edible cups with logos, flavors, or colors that correspond to the company's identity create a licensing revenue stream. At music festivals and sporting events, event-hospitality providers have shown a willingness to pay a premium of 60–80% for branded edible cups [15].


Subscription and DaaS Models for Food-Service Chains

A direct-to-operator subscription platform that bundles edible cup supply with carbon-offset certificates and waste-audit reporting could reduce procurement friction and lock in multi-year contracts. Early-stage ventures have raised over USD 65 million in Series A and B rounds pursuing this model [16].

Data Monetization via Consumption Analytics

Smart edible-cup formats embedded with food-safe QR or NFC tags can capture consumption-pattern data — beverage temperature preferences, hold-time behavior, discard-vs.-eat rates — that brand owners will pay to access. This data layer transforms the edible cup market from a commodity packaging play into a consumer-insights platform [3].


Edible Cup Market Future Outlook

AI-Optimized Formulation Science

Machine-learning platforms are compressing the edible cup market's R&D cycle from 18 months to under 6. Generative models trained on molecular-interaction datasets can screen 10,000 protein-polysaccharide blends overnight, identifying barrier-performance optima that human chemists would need years to test empirically. By 2030, at least 40% of new edible-cup formulations will originate from AI-assisted discovery pipelines [3][4].

Circular-Economy Integration

As Extended Producer Responsibility schemes expand globally — the OECD projects 90% of member nations will enforce EPR for packaging by 2030 — the edible cup market gains a structural advantage: zero post-consumer waste. Life-cycle assessments consistently show edible cups generating 72–85% lower carbon emissions than polyethylene-coated paper cups when end-of-life processing is factored in [13][17].

Electrification of Production Lines

Next-generation extrusion and 3D-printing equipment running on renewable electricity will reduce the edible cup market's Scope 2 emissions by an estimated 55% by 2032. Manufacturers in Nordic countries and the Pacific Northwest are already sourcing 100% renewable power for pilot facilities, creating a carbon-intensity benchmark that competitors will need to match to win ESG-screened procurement contracts [11][18].

Platform Economics and Subscription Models

The edible cup market is moving toward platform-based distribution, where manufacturers bundle cup supply with waste-reporting dashboards, carbon-offset certification, and flavor-customization APIs. This shift from transactional sales to recurring-revenue models could lift average revenue per customer by 35–50% and reduce churn in food-service accounts [16][15].


Edible Cup Market Segmentation

By Source

Segment Metric Primary Demand Driver
Plant-Based 78.12% share (2024) Broad feedstock availability, allergen-friendly positioning
Animal-Based 8.62% CAGR (2026–2035) Gelatin-based structural strength for hot beverages


Plant-based sources dominate the edible cup market because starch, seaweed, and grain-protein feedstocks are abundant, affordable, and align with vegan and allergen-conscious consumer preferences. Cassava, rice, and wheat starches serve as the primary structural matrices, while alginate and agar coatings add moisture resistance. Animal-based formulations — principally gelatin and casein — offer superior hot-liquid performance but face pushback from vegan consumers and encounter supply volatility tied to livestock-industry dynamics.

By Raw Material

Segment Metric Primary Demand Driver
Proteins 48.90% share (2024) Heat resistance and structural integrity
Polysaccharides 11.14% CAGR (2026–2035) Seaweed and starch innovation
Lipids USD 74.50 Million (2025) Moisture-barrier enhancement
Others USD 41.20 Million (2025) Composite and hybrid formulations


Protein-based raw materials lead the edible cup market because whey, soy, and zein (corn) proteins form rigid matrices capable of withstanding temperatures above 80°C. Polysaccharides — including agar, carrageenan, and modified starch — are gaining ground as edible films and coatings that improve moisture barriers without introducing allergen risk. The lipid category, while smaller, plays a critical role as a hydrophobic interlayer in multi-component cup walls.

By Cup Format

Segment Metric Primary Demand Driver
Wafer-Based Cups 56.10% share (2024) Established production infrastructure
Molded Starch Cups 10.05% CAGR (2026–2035) Cost-effective scalability
Seaweed-Based Cups USD 62.30 Million (2025) Zero-allergen positioning
Others USD 34.80 Million (2025) 3D-printed and custom formats


Wafer-based cups remain the workhorse of the edible cup market, leveraging decades of ice-cream-cone manufacturing know-how. Molded starch cups — produced via compression molding of cassava or potato starch — are the fastest-growing format thanks to lower raw-material costs and compatibility with industrial-scale tooling. Seaweed-based cups occupy a premium niche, attracting health-conscious and environmentally motivated buyers willing to pay a 40–60% premium.

By End-Use

Segment Metric Primary Demand Driver
Food & Beverage 37.72% share (2024) QSR, café, and event-hospitality channels
Pharmaceutical & Nutraceutical 11.87% CAGR (2026–2035) Single-dose edible vessels for liquid supplements
Others USD 48.90 Million (2025) Promotional, cosmetic sampling, and novelty uses


The food and beverage segment anchors the edible cup market, with coffee chains, ice-cream vendors, and stadium concessions representing the highest-volume channels. Pharmaceutical and nutraceutical applications are the fastest-growing end-use, driven by patient-compliance benefits of single-dose edible vessels that eliminate the need for water during administration.


Regional Market Share Analysis

Region Metric Primary Investment Themes
North America 34.72% share (2024) QSR chain conversion, FDA GRAS pathway expansion
Europe USD 210.73 Million (2025) EU SUP Directive compliance, circular-economy funding
Asia-Pacific 11.70% CAGR (2026–2035) National plastic bans, low-cost starch feedstocks
South America USD 60.63 Million (2025) Sugarcane-derived formulations, event-sector growth
Middle East & Africa 5.84% CAGR (2026–2035) Hospitality-sector pilots, import substitution
Total USD 739.40 Million (2025)

The edible cup market spans five major regions, each shaped by distinct regulatory frameworks, consumer behavior patterns, and raw-material availability.


North America

Country Metric Key Driver
US 72.40% of regional share QSR adoption and stadium pilots
Canada 15.80% of regional share Federal single-use plastics ban
Mexico 11.80% of regional share Tourism-hospitality channel


The United States drives the edible cup market in North America through a combination of large QSR chain commitments and municipal plastic-ban ordinances across California, New York, and Washington. Canada's federal prohibition on plastic-lined cups has prompted Tim Hortons and other national chains to accelerate edible-vessel trials, while Mexico's growing eco-tourism segment is creating premium demand in resort food-service operations [1][12].

Europe

Country Metric Key Driver
Germany 8.45% CAGR (2026–2035) Industrial R&D leadership
UK USD 32.15 Million (2025) Post-Brexit green-packaging incentives
France 22.30% of regional share Extended Producer Responsibility mandates
Italy USD 19.40 Million (2025) Gelato and espresso cup innovation
Spain 7.90% CAGR (2026–2035) Tourism and festival sector
Nordic Countries USD 16.80 Million (2025) Circular-economy policy leadership
Russia 4.10% of regional share Import substitution initiatives
Rest of Europe 12.60% of regional share Varied regulatory adoption


Europe's edible cup market benefits from the continent's aggressive regulatory posture. France's AGEC Law mandates that all single-use food-service items be compostable or reusable by 2025, directly boosting demand for consumable alternatives. Italy's espresso culture has made it a proving ground for heat-resistant edible espresso cups, with three domestic manufacturers scaling production lines since 2023 [8][20].

Asia-Pacific

Country Metric Key Driver
China 28.50% of regional share Government plastic-ban enforcement
India 12.85% CAGR (2026–2035) Phased national plastic prohibition
Japan USD 18.60 Million (2025) Premium convenience-store channel
South Korea 9.30% of regional share Green New Deal packaging targets
ASEAN 7.40% CAGR (2026–2035) Tourism-driven hospitality demand
Rest of Asia-Pacific 11.20% of regional share Emerging policy frameworks


Asia-Pacific's rapid growth trajectory in the edible cup market stems from large population bases, aggressive plastic legislation, and access to low-cost agricultural feedstocks. India's Ministry of Environment banned identified single-use plastics effective July 2022, with cups and plates included in subsequent phases. China's National Development and Reform Commission has set 2025 and 2028 milestones for eliminating non-degradable disposable food-service items in major cities [9][22].

South America

Country Metric Key Driver
Brazil 58.30% of regional share Sugarcane feedstock advantage
Argentina USD 12.45 Million (2025) Growing café-culture adoption
Rest of South America 7.20% CAGR (2026–2035) Hospitality and tourism sectors


Brazil anchors the South American edible cup market thanks to abundant sugarcane-derived starch and a well-developed agro-processing infrastructure. Municipal plastic-reduction laws in São Paulo and Rio de Janeiro are creating regulatory push, while the country's large street-food economy offers a natural high-volume distribution channel [23].

Middle East & Africa

Country Metric Key Driver
Saudi Arabia 31.20% of regional share Vision 2030 sustainability mandates
UAE USD 8.70 Million (2025) Premium hospitality sector
South Africa 6.10% CAGR (2026–2035) Extended Producer Responsibility legislation
Egypt 14.50% of regional share Growing food-service modernization
Rest of MEA 22.80% of regional share Nascent regulatory adoption


The Middle East & Africa region remains a smaller but strategically important frontier for the edible cup market. Saudi Arabia's Vision 2030 program includes sustainability KPIs for the hospitality sector, and the UAE's expo and luxury-tourism infrastructure creates premium-price tolerance for novel food-service formats. South Africa's EPR regulations, effective since 2021, are gradually shifting procurement patterns [24][25].


Edible Cup Market By Region, 2025-2035

Competitive Benchmarking

The edible cup market exhibits medium concentration, with the top five players controlling an estimated 32–38% of global revenue. The HHI index sits below 1,000, indicating a fragmented competitive field where regional specialists coexist with diversified ingredients conglomerates. Barriers to entry are moderate — the core technology is accessible, but scaling production while meeting food-safety certifications requires significant capital and regulatory expertise.

Company Est. Revenue Share Range Key Offerings Strategic Positioning
Loliware ~6–9% Seaweed-based edible cups, branded custom formats First-mover in seaweed cups; strong DTC and B2B presence
Notpla ~5–8% Ooho water pods, edible sachets, cup coatings Circular-packaging pioneer; partnerships with event operators
Cupffee ~4–7% Wafer-based hot-beverage cups European QSR focus; ISO 22000 certified production
MonoSol (Kuraray) ~4–6% Water-soluble and edible film technologies Parent-company R&D depth; pharma-grade applications
Incredible Foods ~3–6% WikiCup protein-based vessels IP portfolio in edible-encapsulation technology
Tate & Lyle ~3–5% Specialty starch and fiber ingredients for cups Ingredients-supplier positioning; global distribution
Ingredion ~3–5% Modified starch matrices, texture solutions Broad food-ingredients portfolio; technical-service network
Cargill ~2–4% Plant-protein and starch-based cup materials Scale advantages in agricultural feedstock procurement
Kerry Group ~2–4% Taste and nutrition systems, edible coatings Flavor-integration expertise for flavored edible cups
Devro ~2–3% Collagen-based edible casings and cup formats Animal-protein specialist; established regulatory approvals


Recent News & Developments

  • Loliware (March 2025): Opened a 50,000-sq-ft seaweed-cup manufacturing facility in New Jersey, tripling production capacity to 100 million units annually. The expansion targets stadium and QSR accounts in the eastern United States [16].
  • Notpla (January 2025): Secured USD 30 million in Series B funding led by a European climate-tech fund to scale Ooho pod and edible-cup production for the EU food-service channel [16].
  • Cupffee (November 2024): Received EU Novel Food clearance for its oat-fiber cup formulation, enabling broader distribution across France, Germany, and the Nordics [8].
  • European Commission (September 2024): Published updated Extended Producer Responsibility fee schedules that impose higher levies on non-compostable cups, strengthening the cost-competitiveness of edible alternatives [8].
  • MonoSol (June 2024): Announced a joint development agreement with a major U.S. pharmaceutical company to produce edible single-dose medication vessels using water-soluble film technology [14].


  • Kerry Group (October 2023): Launched a flavor-integration platform allowing food-service operators to specify custom taste profiles — vanilla, cinnamon, matcha — for edible cup orders [15].


Edible Cup Market Report Scope

Parameter Detail
Market Scope Global Edible Cup Market — by Source, Raw Material, Cup Format, End-Use, Region
Study Period 2021–2035
CAGR 8.00% (2026–2035)
Market Size (2025) USD 739.40 Million
Market Size (2035) USD 1,596.30 Million
Fastest Growing Segment Pharmaceutical & Nutraceutical end-use (11.87% CAGR)
Companies Profiled 10 (Loliware, Notpla, Cupffee, MonoSol, Incredible Foods, Tate & Lyle, Ingredion, Cargill, Kerry Group, Devro)
Valuation Currency USD Million

FAQs

What food-safety certifications should buyers verify before procuring edible cups?
Buyers should confirm GRAS status (U.S.) or Novel Food clearance (EU), plus ISO 22000 and HACCP compliance from the manufacturer. Allergen declarations for wheat, soy, or dairy proteins are mandatory in most jurisdictions [5].
How do edible cups perform in cold-chain logistics compared to ambient storage?
Cold-chain storage at 4–8°C extends shelf life to 16–18 months versus 8–14 months at ambient conditions. Humidity-controlled packaging inserts reduce moisture uptake and preserve structural integrity during transit [19].
Can edible cups be customized with brand logos and flavor profiles?
Yes — food-grade laser etching and edible-ink printing enable logo placement, while flavor compounds are blended into the cup matrix during molding. Custom orders typically require 50,000-unit minimums [15].
What is the minimum order volume for a mid-size food-service operator entering the edible cup market?
Most manufacturers set minimums at 25,000–50,000 units per SKU, with lead times of 6–10 weeks for standard formats. Custom molds add 4–6 weeks and a one-time tooling fee of USD 5,000–12,000 [12].
How do disposal regulations differ for edible cups versus compostable alternatives?
Edible cups are classified as food products, not packaging waste, in most jurisdictions — exempting them from EPR fees and landfill levies. Compostable cups still require industrial composting infrastructure [8].
What intellectual-property strategies are emerging among edible cup market leaders?
Leading firms are patenting nano-barrier coating formulations and 3D-printed cup geometries rather than base recipes. Cross-licensing agreements between material suppliers and cup manufacturers are becoming common [16].
How does the edible cup market address cross-contamination risks in shared food-service environments?
Manufacturers offer allergen-free product lines made exclusively from seaweed or rice starch in dedicated facilities. Third-party audit programs verify segregation protocols at the production-line level [14].    
Author
Author
Author Profile
Snehal Singh LinkedIn
Manager - Research
High acumen in analyzing complex macro & micro markets with more than 6 years of work experience in the field of market research. By implementing her analytical skills in forecasting and estimation into market research reports, she has expertise in Packaging, Construction, and Equipment domains. She handles a team size of 20-25 resources and ensures smooth running of the projects, associated marketing activities, and client servicing.
Download Free Sample

Kindly complete the form below to receive a free sample of this Report

* Please use a valid business email

Download PDF ×

We do not share your information with anyone. However, we may send you emails based on your report interest from time to time. You may contact us at any time to opt-out.
















