Electric Vehicle Battery Swapping Market (2025 - 2035)

Electric Vehicle Battery Swapping Market Size, Share & Growth Analysis Report By Vehicle Type (Two-Wheeler, Three-Wheeler, Four-Wheeler & Above), By Service Model (Subscription, On-Demand), By Station Type (Manual, Automated), By Battery Chemistry (Lithium-Ion, Lead-Acid) and By Regional (North America, Europe, South America, Asia Pacific, Middle East and Africa) – Industry Growth & Forecast to 2035
ID: MRFR/EnP/21286-HCR
100 Pages
Chitranshi Jaiswal
Last Updated: July 10, 2026
Electric Vehicle Battery Swapping Market
Market Size
Forecast Period2025-2035
CAGR (2025-2035)26.18%
2025 Market SizeUSD 1.73 Billion
2035 Market SizeUSD 22.85 Billion
Key Players
NIO Inc.
CATL
Aulton New Energy
Gogoro Inc.
Battery Smart
Sun Mobility
Opportunities
  • Two-Wheeler and Three-Wheeler Expansion in South and Southeast Asia
  • Second-Life Battery Grid Storage
  • Data Monetization and Predictive Analytics

Electric Vehicle Battery Swapping Market Summary

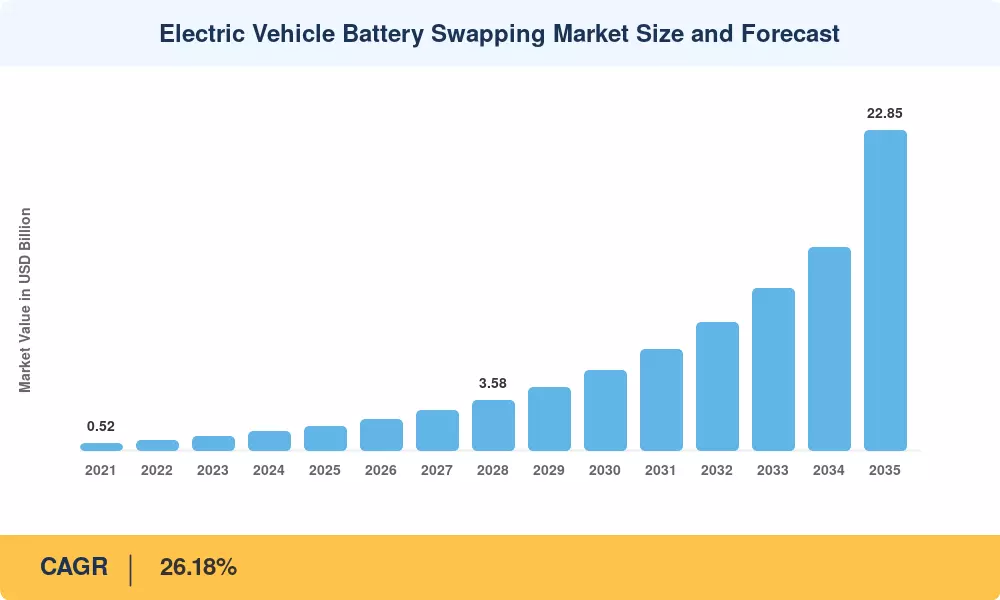
The Electric Vehicle Battery Swapping Market was valued at USD 1.73 billion in 2025 and is projected to reach USD 2.22 billion in 2026 before expanding to USD 22.85 billion by 2035, registering a CAGR of 26.18% during the forecast period (2026–2035). This growth trajectory is anchored in aggressive fleet-electrification mandates across Asia and mounting global pressure to decarbonize last-mile logistics. China's national push toward a standardized battery swap protocol — exemplified by CATL's Choco-SEB packs enabling sub-two-minute swaps — has catalyzed investment exceeding USD 4 billion in station infrastructure since 2023 [2].

Battery swapping is rapidly displacing conventional plug-in charging for high-utilization commercial fleets. Where a DC fast charger still demands 20–40 minutes of vehicle downtime, an automated battery swap robot station completes an exchange in under 120 seconds. India's FAME-III subsidy framework now channels INR 2,500 crore toward two-wheeler battery swapping in India's infrastructure, targeting 10,000 swap points by 2027 [3]. The battery-as-a-service swapping model converts steep upfront battery costs into predictable monthly subscriptions, a structure ride-hailing and delivery operators increasingly prefer.

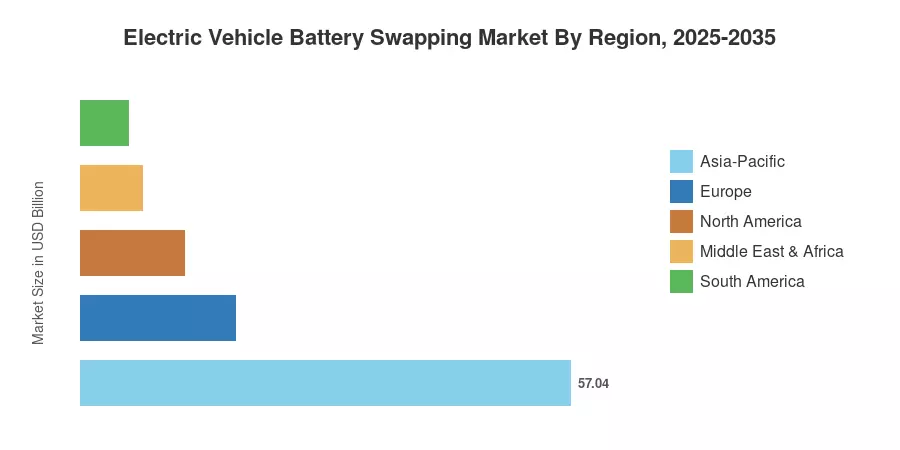
Asia-Pacific commands roughly 57% of the Electric Vehicle Battery Swapping Market, driven by China's 2,400+ operational swap stations and India's rapidly expanding electric scooter swappable battery ecosystem. The Middle East & Africa region is the fastest climber with a projected CAGR of 36.12%, fueled by sovereign green-mobility funds in the UAE and Saudi Arabia. Europe holds the second-largest share at approximately 18%, led by pilot programs in Norway and the Netherlands The decade ahead will see battery swap station EV NIO-style networks proliferate well beyond their Chinese origins.


Key Report Takeaways

• By Vehicle Type

  • Two-wheelers dominated the Electric Vehicle Battery Swapping Market with 84.37% share in 2025, reflecting massive adoption in Asian urban delivery fleets
  • Three-wheelers represent the fastest-growing vehicle category, projected at a 39.81% CAGR through 2035, as electric cargo rickshaws gain traction

• By Service Model

  • Subscription services captured USD 1.05 billion in 2025 revenue, validating the battery-as-a-service swapping model for fleet operators
  • On-demand transactions are forecast to expand at a 27.94% CAGR, attracting occasional users and tourist-heavy urban zones

• By Region

  • Asia-Pacific held 57.04% of the Electric Vehicle Battery Swapping Market in 2025, with China and India as twin engines
  • The Middle East & Africa is poised for a 36.12% CAGR, the highest among all regions, underpinned by sovereign wealth fund investments
  • North America's share stood at approximately 12% in 2025, with pilot deployments accelerating across California and Texas


Market Size and Forecast (2021–2035)

The projections below combine bottom-up station deployment data, subscription revenue modeling, and top-down macroeconomic cross-checks against IEA EV Outlook and BloombergNEF battery pricing indices. Historical values (2021–2024) reflect realized revenues; the base year (2025) is estimated from confirmed operator filings and government subsidy disbursements.
Electric Vehicle Battery Swapping Market Size and Forecast
Our Impact
Enabled $4.3B Revenue Impact for Fortune 500 and Leading Multinationals
Partnering with 2000+ Global Organizations Each Year
30K+ Citations by Top-Tier Firms in the Industry

Driver Impact Analysis

Driver ~% Impact on CAGR Geographic Relevance Impact Timeline
Government fleet-electrification mandates 22% Global Short-term (≤2 yr)
Standardized battery swap protocol adoption 18% China, India, ASEAN Medium-term (2–4 yr)
Subscription pricing economics for fleets 16% Global Short-term (≤2 yr)
Automated station cost reductions 14% China, Europe Medium-term (2–4 yr)
Two-wheeler and three-wheeler EV penetration 15% India, Southeast Asia Short-term (≤2 yr)
Second-life battery revenue models 8% Global Long-term (≥4 yr)
Urban congestion and emission zone policies 7% Europe, China Medium-term (2–4 yr)


Government Fleet-Electrification Mandates

China's State Council directive mandating 80% electrification of urban delivery fleets by 2030 has created a guaranteed demand floor for swap infrastructure. India's FAME-III program allocates INR 2,500 crore specifically for the two-wheeler battery swapping India deployment, targeting tier-2 and tier-3 cities where grid constraints make DC fast charging impractical [3]. These mandates convert policy ambition into bankable station-level revenue, compressing payback periods to under three years for high-traffic locations.

Standardized Battery Swap Protocol Adoption

Interoperability has long been the sector's Achilles' heel. China's GB/T 40032 standard, finalized in 2024, establishes uniform connector specifications and communication protocols that allow vehicles from different OEMs to use the same swap station [5]. CATL's Choco-SEB modular pack architecture supports this standardized battery swap protocol by decoupling pack design from vehicle platform. When battery swap station EV NIO-compatible hardware becomes interoperable with Changan and Geely vehicles, station utilization rates are projected to double [4].

Subscription Pricing and Fleet Economics

The battery-as-a-service swapping model eliminates the single largest cost barrier for commercial EV adoption — the battery itself. A ride-hailing operator in Mumbai pays approximately USD 45/month per electric scooter swappable battery subscription, compared with USD 1,200–1,500 for outright battery purchase [8]. This operating-expense structure aligns perfectly with the cash-flow profiles of gig-economy platforms, accelerating fleet conversion timelines by 18–24 months versus ownership models.

Automated Station Deployment

Fully automated battery swap robot station designs from Aulton and NIO have reduced per-swap labor costs to near zero, while cutting swap times to 90 seconds [10]. Station footprints have shrunk to under 60 square meters, enabling deployment inside parking garages and fuel-station forecourts. BloombergNEF projects that automated station hardware costs will decline 35% by 2032 as robotics supply chains mature [10].


Restraints Impact Analysis

Restraint ~% Negative Impact Geographic Relevance Impact Timeline
Lack of cross-OEM interoperability –18% Global (ex-China) Medium-term (2–4 yr)
High station CAPEX and grid upgrade costs –16% Emerging markets Short-term (≤2 yr)
Battery degradation and liability ambiguity –12% Global Long-term (≥4 yr)
Limited consumer awareness outside Asia –10% Europe, Americas Medium-term (2–4 yr)
Competing ultra-fast charging improvements –9% North America, Europe Long-term (≥4 yr)


Cross-OEM Interoperability Gaps

There isn't a large-scale, legally binding battery exchange protocol outside of China. Due to the reluctance of European and North American automakers to give up their proprietary battery-pack designs, ecosystems have become fragmented, with each station network catering to a single brand [5]. Station operators are at risk of underutilization until ISO or SAE approves a common swap interface, and OEMs are hesitant.


High Station CAPEX and Grid Infrastructure

Excluding grid-connection upgrades, the deployment cost of a single automated battery swap robot station is between $350,000 and $500,000. Transformer capacity and distribution-line reinforcements might increase project costs by 30–40% in areas like rural India and sub-Saharan Africa. This burden is somewhat mitigated by government subsidies, but station economics are still marginal below 40 swaps per day.


Battery Degradation Liability

Shared battery pools introduce complex questions about warranty responsibility. When a pack degrades faster than expected, the dispute between the station operator, battery manufacturer, and vehicle OEM can stall deployment. Insurance products tailored to battery-as-a-service swapping model structures are still nascent, adding risk premiums that inflate subscription pricing by an estimated 8–12%.


Electric Vehicle Battery Swapping Market Opportunities

Two-Wheeler and Three-Wheeler Expansion in South and Southeast Asia

India alone has over 200 million registered two-wheelers, yet electric penetration sits below 6%. Two-wheeler battery swapping India programs backed by Convergence Energy, Battery Smart, and Sun Mobility are converting this gap into a USD 3 billion addressable opportunity by 2030 [7]. Indonesia, Vietnam, and the Philippines present analogous markets where electric scooter swappable battery networks can leapfrog charging infrastructure

Second-Life Battery Grid Storage

An estimated USD 1.2 billion in additional revenue will be generated globally by 2033 from the repurposing of retired swap-pool batteries with 70–80% capacity for stationary grid storage [12]. Incorporating second-life storage into their facilities allows station operators to increase demand-response and peak-shaving revenue while prolonging battery economic life by five to seven years


Data Monetization and Predictive Analytics

Every battery swap generates telemetry — state of health, charge cycles, temperature profiles. Aggregated across thousands of daily swaps, this data supports predictive maintenance algorithms, insurance underwriting models, and grid-load forecasting products. Operators who monetize swap data could add 8–15% to station-level EBITDA.

Middle East Sovereign Green-Mobility Initiatives

Over USD 1 billion has been set aside for EV infrastructure, including battery swap station EV NIO-style experiments in Riyadh and Abu Dhabi, as part of Saudi Arabia's Vision 2030 and the UAE's Net Zero 2050 policy [9]. MEA may become the fastest-growing region for the electric vehicle battery swapping market thanks to these sovereign-backed initiatives that de-risk private investment.


Standardization-Led Network Effects

As the standardized battery swap protocol matures, multi-brand station networks unlock Metcalfe's law dynamics — each additional compatible vehicle model increases per-station utilization exponentially [5]. Early movers that invest in protocol-compliant hardware will capture outsized market share once interoperability becomes the regulatory default


Electric Vehicle Battery Swapping Market Future Outlook

AI-Optimized Station Networks

Machine-learning algorithms will increasingly manage battery dispatch, predicting demand spikes by time of day, weather, and ride-hail surge patterns. By 2030, AI-driven station networks could improve utilization rates by 25–30%, according to IEA modeling [2]. Automated battery swap robot station configurations will integrate predictive maintenance, preconditioning packs to optimal temperatures before dispatch.

Platform Economics and Interoperability

The Electric Vehicle Battery Swapping Market is migrating toward platform business models where station operators serve multiple OEMs through a single standardized battery swap protocol. CATL's EVOGO platform already serves three Chinese automakers, and its Choco-SEB architecture is designed for cross-brand compatibility [5]. By 2032, platform operators are expected to control 40–50% of global swap transactions, capturing value through data, energy arbitrage, and subscription management.

Electrification Supercycle in Emerging Markets

IEA projects global EV sales will reach 40 million units annually by 2030, with emerging markets accounting for 35% of that volume [2]. In markets where grid infrastructure lags behind EV adoption, battery swapping offers a grid-friendly alternative that decouples vehicle charging from peak-demand periods. Two-wheeler battery swapping in India alone could serve 25 million vehicles by 2035, creating the world's largest swap ecosystem outside China [7].

ESG Reporting and Circular-Economy Integration

Corporate sustainability mandates (EU CSRD, SEC climate-disclosure rules) are compelling logistics operators to document Scope 1 and Scope 3 emissions reductions [6]. Battery swapping provides auditable per-swap carbon-intensity data, simplifying ESG compliance. Circular-economy frameworks that track battery materials from first life through grid storage to recycling will become a competitive differentiator for the Electric Vehicle Battery Swapping Market operators who invest early [12].


Electric Vehicle Battery Swapping Market Segmentation

By Vehicle Type

Segment Key Metric Primary Demand Driver
Two-Wheeler 84.37% share (2025) Urban delivery and ride-hail fleets
Three-Wheeler 39.81% CAGR (2026–2035) Cargo rickshaw electrification in India
Four-Wheeler & Above USD 0.14 Billion (2025) NIO/Aulton passenger-vehicle networks


The Electric Vehicle Battery Swapping Market is overwhelmingly driven by two-wheelers, which account for over four-fifths of all swap transactions globally. Electric scooter swappable battery platforms such as Gogoro in Taiwan, Battery Smart in India, and Immotor in China have built dense urban networks where riders exchange a depleted pack for a fully charged one in under 30 seconds. The convenience factor is decisive — delivery riders cannot afford the 2–4 hour downtime that plug-in charging demands.

Three-wheelers are the fastest-growing vehicle type within the Electric Vehicle Battery Swapping Market, fueled by India's push to electrify its 10-million-strong auto-rickshaw fleet. Two-wheeler battery swapping India operators like Sun Mobility are extending their swap cabinets to accommodate three-wheeler packs, leveraging existing station footprints to serve both vehicle classes.

By Service Model

Segment Key Metric Primary Demand Driver
Subscription USD 1.05 Billion (2025) Fleet operators seeking predictable OPEX
On-Demand 27.94% CAGR (2026–2035) Occasional users, tourist zones


Subscription services dominate because the battery-as-a-service swapping model aligns with fleet-operator economics. A fixed monthly fee covering unlimited swaps converts battery depreciation from a capital expense into an operating line item. On-demand pay-per-swap services are growing rapidly in tourist-heavy cities and among private vehicle owners who swap infrequently.

By Station Type

Segment Key Metric Primary Demand Driver
Manual 63.28% share (2025) Lower CAPEX in emerging markets
Automated 26.52% CAGR (2026–2035) Labor cost reduction and speed


Manual stations, where an attendant physically exchanges batteries, dominate in cost-sensitive markets across India and Southeast Asia. Automated battery swap robot station deployments are scaling rapidly in China, where NIO and Aulton have demonstrated fully robotic exchanges. As robotics costs decline, automated stations are expected to overtake manual installations by swap volume before 2033.

By Battery Chemistry

Segment Key Metric Primary Demand Driver
Lithium-Ion 88.14% share (2025) Energy density and cycle-life superiority
Lead-Acid 11.86% share (2025) Legacy two-wheeler fleets in price-sensitive markets


Lithium-ion packs are the backbone of the Electric Vehicle Battery Swapping Market, offering 3–4x the energy density of lead-acid alternatives. Sodium-ion chemistries may emerge as a cost-competitive option for low-speed vehicles by 2030, but lithium-ion will retain dominance through the forecast period [15].


Regional Market Share Analysis

Region Key Metric Primary Investment Themes
Asia-Pacific 57.04% share (2025) Two-wheeler ecosystems, OEM-integrated networks
Europe 18.02% share (2025) Emission-zone mandates, fleet electrification
North America 12.15% share (2025) Commercial fleet pilots, standardization lobbying
South America 5.63% share (2025) Urban delivery fleet conversions
Middle East & Africa 7.16% share (2025) Sovereign fund-backed infrastructure
Total 100%

The Electric Vehicle Battery Swapping Market exhibits pronounced regional asymmetry, with Asia-Pacific accounting for the majority of both installed stations and swap transactions. Adoption in other regions is accelerating as pilot programs transition to commercial scale.


North America

Country Key Metric Key Driver
US 68.4% of regional share California ZEV mandate expansion
Canada 19.1% of regional share Federal iZEV incentive program
Mexico 12.5% of regional share Cross-border logistics fleet demand


North America's Electric Vehicle Battery Swapping Market is concentrated in commercial fleet applications. Ample, operating in San Francisco, has deployed automated swap stations for ride-hail and delivery vehicles, processing over 10,000 swaps monthly [17]. Canada's iZEV purchase-incentive program now extends to commercial vehicles using swappable batteries, while Mexico's proximity to US logistics corridors creates cross-border fleet demand for standardized swap infrastructure.

Europe

Country Key Metric Key Driver
Germany 26.3% CAGR (2026–2035) Autobahn corridor swap pilots
UK USD 0.08 Billion (2025) London ULEZ fleet conversions
France 21.8% CAGR (2026–2035) La Poste electric fleet mandate
Italy 14.2% of regional share Urban scooter-sharing battery swaps
Spain 9.8% of regional share Tourism-zone electric scooter swappable battery rentals
Nordic Countries 18.5% of regional share Green-mobility leadership
Russia 3.1% of regional share Nascent pilot stage
Rest of Europe 7.6% of regional share Varied regulatory environments


Europe's approach to the Electric Vehicle Battery Swapping Market emphasizes commercial fleet use cases within urban emission zones. NIO launched its first European battery swap station EV NIO network in Norway in 2022 and has since expanded to Germany and the Netherlands, targeting premium passenger-vehicle owners who value sub-three-minute exchanges [4]. La Poste's mandate to electrify 100% of its French delivery fleet by 2030 is driving interest in electric scooter swappable battery logistics solutions.

Asia-Pacific

Country Key Metric Key Driver
China USD 0.82 Billion (2025) GB/T standardized battery swap protocol
India 38.45% CAGR (2026–2035) FAME-III two-wheeler incentives
Japan 8.7% of regional share Honda-led consortium for light EVs
South Korea 7.2% of regional share Battery tech leadership and KEPCO pilots
ASEAN 33.6% CAGR (2026–2035) Grab/Gojek fleet electrification
Rest of Asia-Pacific 4.8% of regional share Early adoption phase


Asia-Pacific's dominance in the Electric Vehicle Battery Swapping Market stems from China's first-mover advantage — the country operates over 2,400 swap stations, more than the rest of the world combined [2]. India's two-wheeler battery swapping ecosystem is the fastest-growing segment within the region, with Battery Smart and Sun Mobility collectively operating 1,000+ swap points across 30 cities. ASEAN markets, particularly Indonesia and Vietnam, are attracting investment from Gogoro and local startups targeting ride-hail and delivery fleets.

South America

Country Key Metric Key Driver
Brazil 61.3% of regional share São Paulo delivery fleet pilots
Argentina 22.7% of regional share Lithium mining ecosystem synergies
Rest of South America 16.0% of regional share Early-stage exploration


South America's Electric Vehicle Battery Swapping Market is nascent but promising. Brazil's iFood and Rappi delivery platforms are piloting electric scooter swappable battery programs in São Paulo and Rio de Janeiro, converting high-mileage gasoline scooters to swap-capable electric models [11]. Argentina's lithium reserves position it as a potential battery-manufacturing hub that could lower regional swap-pack costs.

Middle East & Africa

Country Key Metric Key Driver
Saudi Arabia 31.4% CAGR (2026–2035) Vision 2030 green transport fund
UAE USD 0.04 Billion (2025) Dubai RTA electric-taxi mandates
South Africa 22.7% of regional share Minibus-taxi electrification pilots
Egypt 15.3% of regional share COP-27 green-transport commitments
Rest of MEA 11.6% of regional share Fragmented early-stage activity


The Middle East & Africa region is the fastest-growing territory for the Electric Vehicle Battery Swapping Market, projected at a 36.12% CAGR. Dubai's Roads and Transport Authority has mandated that 50% of its taxi fleet be zero-emission by 2030, creating direct demand for battery swap station EV NIO-type infrastructure at taxi ranks [9]. South Africa's minibus-taxi industry — carrying 15 million daily passengers — represents a large-scale commercial opportunity for swap-based electrification.


Electric Vehicle Battery Swapping Market By Region, 2025-2035

Competitive Benchmarking

The Electric Vehicle Battery Swapping Market exhibits medium concentration, with the top five players controlling an estimated 45–55% of global revenues. The competitive field blends vertically integrated OEMs (NIO), pure-play swap operators (Aulton, Battery Smart), battery manufacturers (CATL), and technology-platform companies (Gogoro). Regional fragmentation is pronounced — Chinese players dominate Asia, while Ample and Gogoro lead in Western markets.

Company Est. Revenue Share Range Key Offerings Strategic Positioning
NIO Inc. 12–16% Battery swap station EV NIO Power Swap 3.0, BaaS subscription Vertically integrated OEM-operator
CATL (EVOGO) 8–12% Choco-SEB modular packs, multi-brand station platform Battery-first platform play
Aulton New Energy 7–10% Automated battery swap robot station, multi-OEM compatibility China's largest independent operator
Gogoro Inc. 6–9% Electric scooter swappable battery network, GoShare platform Two-wheeler swap pioneer
Battery Smart 4–6% Two-wheeler battery swapping India network, subscription model India market leader
Sun Mobility 3–5% Modular swap stations, multi-vehicle compatibility India-focused multi-format operator
Ample Inc. 3–5% Modular battery blocks, autonomous swap stations US commercial fleet specialist
Oyika Pte. Ltd. 2–4% Southeast Asia two-wheeler swap subscriptions ASEAN regional player
Lithion Power 2–3% Swap infrastructure for three-wheelers, India Niche three-wheeler focus
E-Swap Technologies 1–3% European pilot swap networks Early-stage European entrant


Recent News & Developments

  • NIO Inc. (March 2025): Launched Power Swap Station 4.0 with 23-battery capacity and 90-second swap time, targeting 5,000 stations globally by 2027 [4].
  • CATL (January 2025): Announced EVOGO expansion to Indonesia and Thailand, deploying Choco-SEB packs for electric scooter swappable battery fleets serving Grab and Gojek [2].
  • Battery Smart (November 2024): Raised USD 65 million Series B to expand two-wheeler battery swapping India operations to 100 cities by 2026 [7].
  • Gogoro (September 2024): Partnered with Yamaha and Suzuki to establish a standardized battery swap protocol for two-wheelers across India and ASEAN [5].
  • Aulton New Energy (June 2024): Opened its 1,000th automated battery swap robot station in China, compatible with Changan, BAIC, and GAC vehicles [10].
  • Government of India (April 2024): Released draft EV battery-swapping policy mandating interoperability standards for two-wheeler and three-wheeler packs [3].
  • Ample Inc. (February 2024): Signed fleet partnership with Uber in San Francisco for autonomous modular battery swapping across 500 vehicles [17].
  • Saudi Arabia PIF (December 2023): Committed USD 300 million to EV swap-station deployment across Riyadh and Jeddah under Vision 2030 green transport allocations [9].


Electric Vehicle Battery Swapping Market Report Scope

Parameter Detail
Market Scope Electric Vehicle Battery Swapping Market — stations, services, battery packs, and ancillary software
Study Period 2021–2035
CAGR (2026–2035) 26.18%
Market Size (2025) USD 1.73 Billion
Market Size (2035) USD 22.85 Billion
Fastest Growing Segments Three-wheelers (by vehicle); Automated (by station type); Middle East & Africa (by region)
Companies Profiled NIO, CATL, Aulton, Gogoro, Battery Smart, Sun Mobility, Ample, Oyika, Lithion Power, E-Swap Technologies
Valuation Currency USD Billion


FAQs

How does battery swapping compare with ultra-fast DC charging for commercial fleet ROI?
Battery swapping delivers 90-second turnarounds versus 20–40 minutes for 350 kW DC fast charging, translating into 15–20% higher daily vehicle utilization for delivery fleets [8]. Fleet operators typically recover the subscription premium within six months through increased trip revenue.
What insurance products exist for shared battery-pool liability?
Specialized parametric insurance policies now cover capacity-fade risk and thermal-event liability within battery-as-a-service swapping model contracts [14]. Allianz and Swiss Re launched fleet-battery coverage products in 2024, targeting station operators in Asia and Europe.
Can existing petrol stations be retrofitted into battery swap locations?
Retrofitting a fuel-station forecourt requires approximately 50–60 square meters and a 200 kW grid connection, costing USD 120,000–180,000 per station [13]. Several Indian oil-marketing companies, including HPCL, have piloted forecourt swap kiosks in Mumbai and Delhi.
How do sodium-ion batteries affect the Electric Vehicle Battery Swapping Market outlook?
Sodium-ion packs offer 20–30% lower cell costs but deliver roughly 40% less energy density than lithium-ion equivalents [15]. They may suit low-speed urban two-wheelers by 2029, though lithium-ion will remain dominant for higher-performance applications.
What role does the Electric Vehicle Battery Swapping Market play in grid-balancing strategies?
Swap stations with pooled batteries function as distributed energy storage assets, enabling demand-response participation and peak-shaving services [12]. Operators in China already earn ancillary-service revenue by discharging stored energy during grid-peak windows.
How does the Electric Vehicle Battery Swapping Market address rural electrification challenges?
Swap stations require smaller grid connections than DC fast-charger clusters, making them viable in areas with constrained transformer capacity [3]. Solar-integrated swap cabinets are being piloted in rural India to serve agricultural and last-mile delivery vehicles.
What cybersecurity risks are unique to connected battery swap networks?
Each swap transaction transmits battery-health telemetry, user credentials, and payment data across cloud platforms, creating attack surfaces for data interception and firmware manipulation [16]. Operators are adopting ISO 27001 and IEC 62443 frameworks to harden station-to-cloud communication.    
Author
Author
Author Profile
Chitranshi Jaiswal LinkedIn
Team Lead - Research
Chitranshi is a Team Leader in the Chemicals & Materials (CnM) and Energy & Power (EnP) domains, with 6+ years of experience in market research. She leads and mentors teams to deliver cross-domain projects that equip clients with actionable insights and growth strategies. She is skilled in market estimation, forecasting, competitive benchmarking, and both primary & secondary research, enabling her to turn complex data into decision-ready insights. An engineer and MBA professional, she combines technical expertise with strategic acumen to solve dynamic market challenges. Chitranshi has successfully managed projects that support market entry, investment planning, and competitive positioning, while building strong client relationships. Certified in Advanced Excel & Power BI she leverages data-driven approaches to ensure accuracy, clarity, and impactful outcomes.

Research Approach


Secondary Research

The secondary research process involved comprehensive analysis of regulatory databases, industry publications, technical standards, and authoritative energy and transportation organizations. Key sources included the US Department of Energy (DOE), Environmental Protection Agency (EPA), National Renewable Energy Laboratory (NREL), European Alternative Fuels Observatory (EAFO), European Commission Directorate-General for Mobility and Transport (DG MOVE), International Energy Agency (IEA) Global EV Outlook, International Council on Clean Transportation (ICCT), China Association of Automobile Manufacturers (CAAM), Society of Indian Automobile Manufacturers (SIAM), Japan Automobile Manufacturers Association (JAMA), International Electrotechnical Commission (IEC), SAE International, International Organization for Standardization (ISO), World Bank Energy Sector Management Assistance Program (ESMAP), International Transport Forum (ITF/OECD), BloombergNEF, International Council on Clean Transportation (ICCT), and national energy ministry reports from key markets.

The market landscape analysis for lithium-ion, solid-state, lead-acid, and nickel-metal hydride battery technologies across passenger vehicles, commercial vehicles, and two/three-wheeler segments was conducted using these sources to gather data on EV adoption, battery swapping infrastructure, regulatory frameworks, charging standards, and carbon emission reduction targets.


Primary Research

In order to gather both qualitative and quantitative insights, supply-side and demand-side stakeholders were interviewed during the primary research process. CEOs, CTOs, VPs of battery technology, heads of charging infrastructure, heads of regulatory affairs, and commercial directors from battery manufacturers, EV OEMs, battery swapping station operators, and energy utility firms were examples of supply-side sources. Fleet managers, logistics firms, ride-sharing service providers, EV fleet procurement leads, urban mobility planners, and end users from last-mile delivery services, commercial transportation companies, and local transit authorities were among the demand-side sources. In addition to gathering information on technology acceptance patterns, pricing models, Battery-as-a-Service (BaaS) subscription dynamics, and interoperability standards, primary research verified market segmentation and battery switching station deployment schedules.

Primary Respondent Breakdown:

By Designation: C-level Primaries (42%), Director Level (25%), Others (33%)

By Region: North America (32%), Europe (30%), Asia-Pacific (35%), Rest of World (3%)


Market Size Estimation

Revenue mapping and swapping station deployment analysis were used to determine the global market valuation. The methodology comprised:

Finding more than fifty major producers and distributors in North America, Europe, Asia-Pacific, Latin America, the Middle East, and Africa

Product mapping for solid-state, lead-acid, nickel-metal hydride, and lithium-ion batteries

Technology mapping between switching systems that are automated, semi-automated, and manual

Application coverage for two- and three-wheelers, commercial vehicles, and passenger cars

Examination of reported and projected yearly income for battery swapping portfolios and BaaS subscriptions

coverage of producers and businesses that will account for 75–80% of the world market in 2024

Extrapolation of segment-specific valuations for captive and third-party business models utilizing top-down (manufacturer/operator revenue validation) and bottom-up (swapping station deployment × usage rate × subscription fees by nation) methods

Download Free Sample

Kindly complete the form below to receive a free sample of this Report

Download PDF ×

We do not share your information with anyone. However, we may send you emails based on your report interest from time to time. You may contact us at any time to opt-out.

















