Electrical Wiring and Panel Inspection Services Market
Electrical Wiring and Panel Inspection Services Market Research Report Information By End Use (New Construction, Renovation, Maintenance, Upgrades), By Application (Residential, Commercial, Industrial, Institutional), By Service Type (Visual Inspection, Thermal Imaging, Electrical Testing, Code Compliance), By Inspection Frequency (Annual, Biannual, Quarterly, On-Demand), By Regulatory Compliance (National Electrical Code, Local Building Codes, Safety Standards) And By Region (North America, Europe, Asia-Pacific, And Rest Of The World) – Market Forecast Till 2035.
Forecast Period
2025 - 2035
CAGR
3.46%
2024 Market Size
$ 5.5 Billion
2035 Market Size
$ 8 Billion
MRO● Updated April 24, 2026Report ID: MRFR/MRO/64794-HCR|Pages: 200|Author: Shubham Munde
Electrical Wiring and Panel Inspection Services Market Summary
As per MRFR analysis, the Electrical Wiring and Panel Inspection Services Market was estimated at 5.5 USD Billion in 2024. The Electrical Wiring and Panel Inspection Services industry is projected to grow from 5.69 USD Billion in 2025 to 8.0 USD Billion by 2035, exhibiting a compound annual growth rate (CAGR) of 3.46% during the forecast period 2025 - 2035.
Key Market Trends & Highlights
The Electrical Wiring and Panel Inspection Services Market is experiencing a dynamic evolution driven by technological advancements and regulatory demands.
Technological integration is reshaping inspection methodologies, enhancing accuracy and efficiency in the market.
North America remains the largest market, while Asia-Pacific is emerging as the fastest-growing region for inspection services.
The residential segment dominates the market, whereas the commercial segment is witnessing rapid growth due to increasing infrastructure projects.
Key drivers include rising awareness of electrical safety and regulatory compliance requirements, fueling demand for inspection services.
Market Size & Forecast
2024 Market Size
5.5 (USD Billion)
2035 Market Size
8.0 (USD Billion)
CAGR (2025 - 2035)
3.46%
Major Players
Schneider Electric (FR), Siemens (DE), General Electric (US), Eaton (US), ABB (CH), Honeywell (US), Emerson Electric (US), Rockwell Automation (US), Legrand (FR)
Our Impact
Enabled $4.3B Revenue Impact for Fortune 500 and Leading Multinationals
Partnering with 2000+ Global Organizations Each Year
30K+ Citations by Top-Tier Firms in the Industry
Electrical Wiring and Panel Inspection Services Market Trends
The Electrical Wiring and Panel Inspection Services Market is currently experiencing a notable evolution, driven by increasing awareness regarding safety standards and regulatory compliance. As electrical systems become more complex, the demand for thorough inspections has intensified. This trend is further fueled by the growing emphasis on energy efficiency and sustainability, prompting both residential and commercial sectors to prioritize regular assessments. Consequently, service providers are adapting their offerings to meet these emerging needs, incorporating advanced technologies and methodologies to enhance inspection accuracy and efficiency. Moreover, the market landscape is characterized by a rising number of service providers, which fosters competition and innovation. Companies are increasingly investing in training and certification programs to ensure their personnel are equipped with the latest knowledge and skills. This focus on professional development not only improves service quality but also builds consumer trust. As the Electrical Wiring and Panel Inspection Services Market continues to expand, it appears poised for further growth, with potential opportunities arising from technological advancements and evolving consumer expectations.
Technological Integration
The integration of advanced technologies, such as artificial intelligence and machine learning, is transforming the Electrical Wiring and Panel Inspection Services Market. These innovations enhance the precision of inspections, allowing for quicker identification of potential issues and reducing the likelihood of human error.
Regulatory Compliance
There is a growing emphasis on adherence to safety regulations and standards within the Electrical Wiring and Panel Inspection Services Market. This trend is prompting businesses to prioritize regular inspections, ensuring that their electrical systems meet the necessary legal requirements and safety protocols.
Sustainability Focus
An increasing focus on sustainability is influencing the Electrical Wiring and Panel Inspection Services Market. Companies are adopting eco-friendly practices and promoting energy-efficient solutions, which not only align with consumer preferences but also contribute to broader environmental goals.
Electrical Wiring and Panel Inspection Services Market Drivers
Increased Infrastructure Development
The ongoing expansion of infrastructure projects across various sectors appears to drive the Electrical Wiring and Panel Inspection Services Market. As urbanization accelerates, the demand for reliable electrical systems in residential, commercial, and industrial buildings intensifies. According to recent data, the construction sector is projected to grow at a compound annual growth rate of approximately 5% over the next few years. This growth necessitates rigorous inspection services to ensure compliance with safety standards and regulations. Consequently, the Electrical Wiring and Panel Inspection Services Market is likely to experience heightened demand as stakeholders prioritize safety and efficiency in their electrical installations.
Rising Awareness of Electrical Safety
There seems to be a growing awareness regarding electrical safety among consumers and businesses, which significantly influences the Electrical Wiring and Panel Inspection Services Market. Educational campaigns and regulatory initiatives have heightened the understanding of the risks associated with faulty wiring and electrical panels. As a result, more property owners are opting for regular inspections to mitigate potential hazards. Data indicates that nearly 30% of electrical fires are attributed to faulty wiring, underscoring the importance of proactive inspection services. This increasing consciousness about safety is likely to bolster the demand for inspection services, thereby enhancing the market's growth prospects.
Growing Demand for Renewable Energy Solutions
The shift towards renewable energy solutions, such as solar and wind power, appears to influence the Electrical Wiring and Panel Inspection Services Market positively. As more businesses and homeowners invest in renewable energy systems, the complexity of electrical installations increases, necessitating specialized inspection services. The International Energy Agency reports that renewable energy capacity is expected to grow significantly, leading to a corresponding rise in the need for inspections to ensure system integrity and safety. This trend suggests that the Electrical Wiring and Panel Inspection Services Market may experience robust growth as the adoption of renewable energy solutions continues to expand.
Regulatory Standards and Compliance Requirements
The enforcement of stringent regulatory standards and compliance requirements is a critical driver for the Electrical Wiring and Panel Inspection Services Market. Governments and regulatory bodies are increasingly mandating regular inspections to ensure that electrical systems meet safety and performance standards. This regulatory landscape compels businesses and property owners to engage inspection services to avoid penalties and ensure compliance. Recent statistics suggest that non-compliance can lead to fines exceeding thousands of dollars, further incentivizing the use of inspection services. As regulations evolve, the market is likely to see sustained growth driven by the need for compliance and safety assurance.
Technological Advancements in Inspection Techniques
The advent of advanced technologies, such as infrared thermography and digital inspection tools, appears to revolutionize the Electrical Wiring and Panel Inspection Services Market. These innovations enable more accurate and efficient inspections, reducing the time and cost associated with traditional methods. The integration of smart technologies into electrical systems also necessitates specialized inspection services to ensure optimal performance and safety. As the market for smart homes and buildings expands, the demand for technologically adept inspection services is expected to rise. This trend indicates a potential shift in the market landscape, where companies that adopt these technologies may gain a competitive edge.
Market Segment Insights
By Application: Residential (Largest) vs. Commercial (Fastest-Growing)
In the Electrical Wiring and Panel Inspection Services Market, the application segment showcases a diverse range of services catering to various sectors. Among these, the residential segment holds the largest market share, driven by increasing home renovations and safety concerns regarding electrical systems. The rise in residential construction projects has further propelled the need for efficient wiring and panel inspection services, highlighting its significant position within the market.
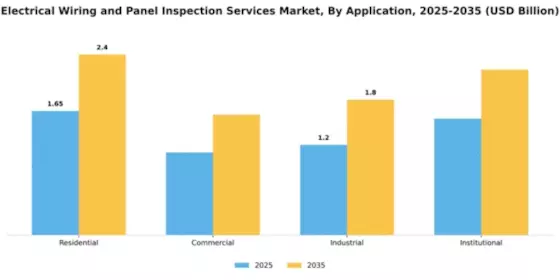
Residential (Dominant) vs. Commercial (Emerging)
The residential application segment stands out as the dominant force in the Electrical Wiring and Panel Inspection Services Market, largely due to the growing emphasis on safety and compliance with electrical standards. Homeowners are increasingly investing in inspection services to ensure the safety and reliability of their electrical systems, making this segment indispensable. In contrast, the commercial application is considered an emerging segment, witnessing rapid growth. Factors such as the expansion of commercial facilities and increased regulatory requirements for electrical installations are fostering a heightened demand for inspection services, enabling commercial inspection providers to capitalize on new opportunities.
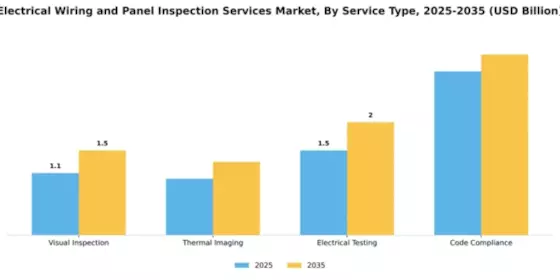
By Service Type: Visual Inspection (Largest) vs. Thermal Imaging (Fastest-Growing)
In the Electrical Wiring and Panel Inspection Services Market, Visual Inspection stands out as the largest segment, capturing significant market share due to its traditional approach combined with widespread acceptance. This method is trusted for its simplicity and effectiveness in identifying visible deficiencies in wiring and panels. Meanwhile, Thermal Imaging is emerging rapidly in the market, drawing attention for its ability to detect electrical issues that are invisible to the naked eye. This technology is increasingly adopted due to its efficiency and accuracy, growing in popularity among service providers and customers alike.
Thermal Imaging: Fastest-Growing vs. Electrical Testing: Emerging
Thermal Imaging as a service type in Electrical Wiring and Panel Inspection is gaining momentum due to its innovative approach to identifying potential hazards before they escalate. By detecting variations in temperature that indicate potential failures, it provides a proactive solution to electrical maintenance. On the other hand, Electrical Testing, while crucial for ensuring system functionality and safety, is seen as an emerging segment. It focuses on verifying the performance and safety of electrical systems, relying heavily on regulations and standards. The demand for Electrical Testing is expected to grow as awareness increases and regulatory bodies enforce stricter compliance, ensuring that this segment keeps pace with the rapid advancements seen in Thermal Imaging.
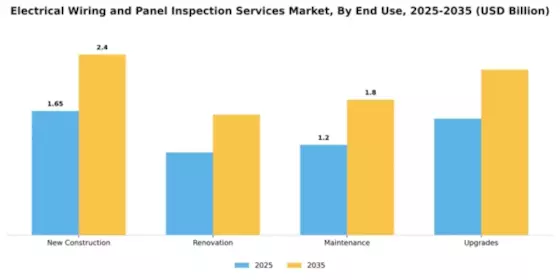
By End Use: New Construction (Largest) vs. Renovation (Fastest-Growing)
The Electrical Wiring and Panel Inspection Services Market is significantly influenced by its end use segments, namely New Construction, Renovation, Maintenance, and Upgrades. Among these, New Construction holds the largest market share as it encompasses a wide range of new buildings and infrastructure developments, necessitating comprehensive wiring inspections to ensure safety and compliance. In contrast, the Renovation segment has emerged as the fastest-growing area, driven by an increasing number of property owners opting for upgrades and enhancements in existing buildings to meet modern standards and energy efficiency requirements.
New Construction (Dominant) vs. Renovation (Emerging)
In the Electrical Wiring and Panel Inspection Services Market, New Construction stands out as the dominant segment due to the steady demand for new installations in residential, commercial, and industrial projects. This segment benefits from ongoing urbanization and population growth, creating a continuous need for new infrastructure. Conversely, the Renovation segment is rapidly emerging, propelled by trends in sustainable living and energy efficiency that encourage property owners to modernize their existing wiring systems and panels. This trend not only enhances building aesthetics but also aligns with regulatory compliance, making Renovations a critical area for market growth.
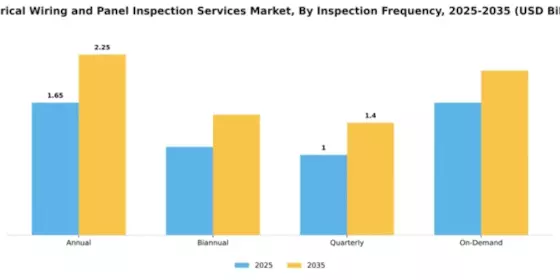
By Inspection Frequency: Annual (Largest) vs. Quarterly (Fastest-Growing)
In the Electrical Wiring and Panel Inspection Services Market, the annual inspection frequency holds the largest market share, appealing to a broad range of residential and commercial clients who prefer scheduled, predictable maintenance. This segment caters well to clients seeking compliance with safety regulations and building codes, ensuring reliability and safety across electrical infrastructures. On the other hand, the quarterly inspections have emerged as the fastest-growing segment, driven by the increasing emphasis on timely maintenance and the prevention of electrical failures. This shift reflects a trend where customers are becoming more proactive about their electrical systems, aiming for maximized safety and operational efficiency.
Annual (Dominant) vs. Quarterly (Emerging)
The annual inspection frequency is highly regarded for its predictability and thoroughness, appealing to clients focused on fulfilling safety and regulatory obligations. Establishments with large, complex electrical systems favor this approach, as it provides a comprehensive look at their wiring and panel components once a year. Conversely, the quarterly inspections have positioned themselves as an emerging necessity in the market, favored by sectors that operate in critical environments where downtime must be minimized. Clients opting for quarterly checks often prioritize immediate detection of issues and rapid remediation, reflecting a growing trend toward increased regularity in maintenance practices to avoid costly electrical failures.
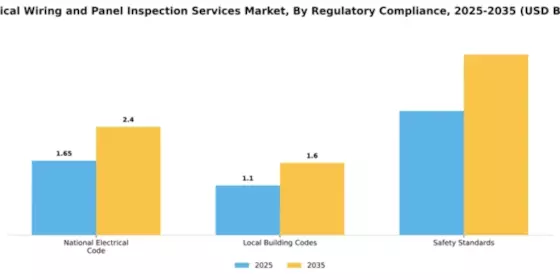
By Regulatory Compliance: National Electrical Code (Largest) vs. Local Building Codes (Fastest-Growing)
The Electrical Wiring and Panel Inspection Services Market is significantly influenced by various regulatory compliance standards. The National Electrical Code (NEC) remains the largest segment, driven by its comprehensive guidelines that cover safety, installation, and maintenance practices for electrical systems. Local Building Codes follow closely, showcasing a growing need for adherence to region-specific regulations that cater to community safety and construction practices. As regulatory bodies push for more stringent safety measures, the demand for compliance has notably increased in both segments.
Regulatory Standards: National Electrical Code (Dominant) vs. Local Building Codes (Emerging)
The National Electrical Code (NEC) stands as the dominant force in the regulatory compliance arena, reflecting a well-established standard recognized nationally across the United States, ensuring safe electrical installations. Its extensive guidelines serve as a critical reference for electricians and inspectors alike. In contrast, Local Building Codes have emerged as a rapidly growing segment as municipalities emphasize localized regulations that address specific environmental and safety concerns unique to their jurisdictions. This growth is propelled by increasing municipal enforcement and the assessment of building methods that prioritize community safety. Both segments play crucial roles in ensuring the safety and reliability of electrical installations, but the local codes are carving a significant niche due to the customization they offer.
Get more detailed insights about Electrical Wiring and Panel Inspection Services MarketRequest Free Sample
Regional Insights
North America : Market Leader in Innovation
North America is poised to maintain its leadership in the Electrical Wiring and Panel Inspection Services Market, holding a significant market share of 2.75 billion. The region's growth is driven by stringent safety regulations, increasing demand for energy-efficient solutions, and advancements in technology. The push for smart grid initiatives and renewable energy integration further catalyzes market expansion, ensuring compliance with evolving standards. The competitive landscape is robust, with key players like General Electric, Siemens, and Eaton leading the charge. The U.S. and Canada are the primary markets, benefiting from substantial investments in infrastructure and modernization projects. The presence of established companies fosters innovation and enhances service delivery, positioning North America as a hub for electrical services.
Europe : Regulatory Framework Driving Growth
Europe's Electrical Wiring and Panel Inspection Services Market is valued at 1.5 billion, driven by rigorous regulatory frameworks and a growing emphasis on safety standards. The European Union's directives on electrical safety and energy efficiency are pivotal in shaping market dynamics. The increasing adoption of smart technologies and sustainable practices further fuels demand, as businesses seek to comply with regulations while enhancing operational efficiency. Leading countries such as Germany, France, and the UK dominate the market, with significant contributions from companies like Schneider Electric and ABB. The competitive landscape is characterized by a mix of established firms and emerging players, all vying for market share. The focus on innovation and compliance ensures a dynamic environment, fostering growth and investment in electrical services.
Asia-Pacific : Emerging Market with Potential
The Asia-Pacific region, with a market size of 1.2 billion, is witnessing rapid growth in the Electrical Wiring and Panel Inspection Services Market. This growth is fueled by urbanization, industrialization, and increasing investments in infrastructure. Countries like China and India are at the forefront, driven by government initiatives aimed at enhancing electrical safety and efficiency. The rising demand for renewable energy sources also plays a crucial role in shaping market trends. The competitive landscape is evolving, with both local and international players, including Honeywell and Emerson Electric, expanding their presence. The region's diverse market dynamics present opportunities for innovation and collaboration. As regulatory frameworks become more stringent, the demand for inspection services is expected to rise, further propelling market growth.
Middle East and Africa : Nascent Market with Challenges
The Middle East and Africa region represents a nascent market for Electrical Wiring and Panel Inspection Services, valued at just 0.05 billion. The growth is hindered by economic challenges, limited infrastructure development, and varying regulatory standards across countries. However, there is a growing awareness of the importance of electrical safety and compliance, which could drive future demand. The region's focus on diversifying economies and investing in infrastructure may also create opportunities for market expansion. Countries like South Africa and the UAE are leading the way, but the competitive landscape remains fragmented. Key players are beginning to establish a foothold, but the market is still in its infancy. As awareness and regulatory frameworks improve, the potential for growth in electrical services will likely increase, attracting investment and innovation.
Key Players and Competitive Insights
The Electrical Wiring and Panel Inspection Services Market is characterized by a dynamic competitive landscape, driven by increasing demand for safety and compliance in electrical installations. Key players such as Schneider Electric (FR), Siemens (DE), and General Electric (US) are at the forefront, each adopting distinct strategies to enhance their market positioning. Schneider Electric (FR) emphasizes innovation through its digital solutions, focusing on smart grid technologies and energy management systems. Siemens (DE) leverages its extensive portfolio in automation and digitalization, aiming to integrate advanced technologies into traditional inspection services. General Electric (US) is concentrating on expanding its service offerings, particularly in renewable energy sectors, which aligns with global sustainability trends. Collectively, these strategies foster a competitive environment that prioritizes technological advancement and operational efficiency.The market structure appears moderately fragmented, with numerous players vying for market share. Key business tactics include localizing manufacturing to reduce costs and optimize supply chains, which is crucial in maintaining competitive pricing. The influence of major companies is significant, as they not only set industry standards but also drive innovation through research and development initiatives. This competitive structure encourages smaller firms to adopt niche strategies or collaborate with larger entities to enhance their service capabilities.In November ABB (CH) announced a strategic partnership with a leading software firm to develop AI-driven inspection tools aimed at improving the accuracy and efficiency of electrical inspections. This move is likely to position ABB as a leader in integrating artificial intelligence into traditional inspection processes, potentially setting new benchmarks for service quality and operational efficiency. The partnership underscores the growing trend of digital transformation within the industry, as companies seek to leverage technology to enhance service delivery.In October Eaton (US) launched a new suite of inspection services tailored for the renewable energy sector, focusing on solar and wind installations. This initiative reflects Eaton's commitment to sustainability and its strategic pivot towards supporting green energy solutions. By aligning its services with the burgeoning renewable energy market, Eaton not only diversifies its offerings but also strengthens its competitive edge in a rapidly evolving landscape.In September Honeywell (US) expanded its inspection service capabilities by acquiring a regional player specializing in electrical safety audits. This acquisition is indicative of Honeywell's strategy to enhance its market presence and service portfolio, particularly in safety compliance, which is increasingly critical in today's regulatory environment. The integration of specialized expertise from the acquired firm is expected to bolster Honeywell's service offerings and improve customer trust in its capabilities.As of December the competitive trends within the Electrical Wiring and Panel Inspection Services Market are increasingly defined by digitalization, sustainability, and the integration of AI technologies. Strategic alliances are becoming more prevalent, as companies recognize the value of collaboration in enhancing service offerings and operational efficiencies. Looking ahead, competitive differentiation is likely to evolve from traditional price-based competition to a focus on innovation, technological advancements, and supply chain reliability. This shift suggests that companies that prioritize these elements will be better positioned to thrive in an increasingly complex market.

Key Companies in the Electrical Wiring and Panel Inspection Services Market include
Future Outlook
Electrical Wiring and Panel Inspection Services Market Future Outlook
The Electrical Wiring and Panel Inspection Services Market is projected to grow at a 3.46% CAGR from 2025 to 2035, driven by increasing safety regulations and technological advancements.
New opportunities lie in:
Integration of AI-driven diagnostic tools for predictive maintenance. Expansion of remote inspection services using drones and IoT technology. Development of customized inspection packages for commercial clients.
By 2035, the market is expected to be robust, reflecting sustained growth and innovation.
Market Segmentation
electrical-wiring-and-panel-inspection-services-market End Use Outlook
New Construction
Renovation
Maintenance
Upgrades
electrical-wiring-and-panel-inspection-services-market Application Outlook
Residential
Commercial
Industrial
Institutional
electrical-wiring-and-panel-inspection-services-market Service Type Outlook
Visual Inspection
Thermal Imaging
Electrical Testing
Code Compliance
electrical-wiring-and-panel-inspection-services-market Inspection Frequency Outlook
Annual
Biannual
Quarterly
On-Demand
electrical-wiring-and-panel-inspection-services-market Regulatory Compliance Outlook
National Electrical Code
Local Building Codes
Safety Standards
Report Scope
MARKET SIZE 2024
5.5(USD Billion)
MARKET SIZE 2025
5.69(USD Billion)
MARKET SIZE 2035
8.0(USD Billion)
COMPOUND ANNUAL GROWTH RATE (CAGR)
3.46% (2025 - 2035)
REPORT COVERAGE
Revenue Forecast, Competitive Landscape, Growth Factors, and Trends
BASE YEAR
2024
Market Forecast Period
2025 - 2035
Historical Data
2019 - 2024
Market Forecast Units
USD Billion
Key Companies Profiled
Schneider Electric (FR), Siemens (DE), General Electric (US), Eaton (US), ABB (CH), Honeywell (US), Emerson Electric (US), Rockwell Automation (US), Legrand (FR)
Segments Covered
Application, Service Type, End Use, Inspection Frequency, Regulatory Compliance
Key Market Opportunities
Integration of advanced diagnostic technologies enhances efficiency in the Electrical Wiring and Panel Inspection Services Market.
Key Market Dynamics
Rising regulatory standards and technological advancements drive demand for comprehensive electrical wiring and panel inspection services.
Countries Covered
North America, Europe, APAC, South America, MEA
Table of Contents
SECTION I: EXECUTIVE SUMMARY AND KEY HIGHLIGHTS |
1.1 EXECUTIVE SUMMARY | |
1.1.1 Market Overview | |
1.1.2 Key Findings | |
1.1.3 Market Segmentation | |
1.1.4 Competitive Landscape | |
1.1.5 Challenges and Opportunities | |
1.1.6 Future Outlook 2
SECTION II: SCOPING, METHODOLOGY AND MARKET STRUCTURE |
2.1 MARKET INTRODUCTION | |
2.1.1 Definition | |
2.1.2 Scope of the study | | |
2.1.2.1 Research Objective | | |
2.1.2.2 Assumption | | |
2.1.2.3 Limitations |
2.2 RESEARCH METHODOLOGY | |
2.2.1 Overview | |
2.2.2 Data Mining | |
2.2.3 Secondary Research | |
2.2.4 Primary Research | | |
2.2.4.1 Primary Interviews and Information Gathering Process | | |
2.2.4.2 Breakdown of Primary Respondents | |
2.2.5 Forecasting Model | |
2.2.6 Market Size Estimation | | |
2.2.6.1 Bottom-Up Approach | | |
2.2.6.2 Top-Down Approach | |
2.2.7 Data Triangulation | |
2.2.8 Validation 3
SECTION III: QUALITATIVE ANALYSIS |
3.1 MARKET DYNAMICS | |
3.1.1 Overview | |
3.1.2 Drivers | |
3.1.3 Restraints | |
3.1.4 Opportunities |
3.2 MARKET FACTOR ANALYSIS | |
3.2.1 Value chain Analysis | |
3.2.2 Porter's Five Forces Analysis | | |
3.2.2.1 Bargaining Power of Suppliers | | |
3.2.2.2 Bargaining Power of Buyers | | |
3.2.2.3 Threat of New Entrants | | |
3.2.2.4 Threat of Substitutes | | |
3.2.2.5 Intensity of Rivalry | |
3.2.3 COVID-19 Impact Analysis | | |
3.2.3.1 Market Impact Analysis | | |
3.2.3.2 Regional Impact | | |
3.2.3.3 Opportunity and Threat Analysis 4
SECTION IV: QUANTITATIVE ANALYSIS |
4.1 Healthcare, BY Application (USD Billion) | |
4.1.1 Residential | |
4.1.2 Commercial | |
4.1.3 Industrial | |
4.1.4 Institutional |
4.2 Healthcare, BY Service Type (USD Billion) | |
4.2.1 Visual Inspection | |
4.2.2 Thermal Imaging | |
4.2.3 Electrical Testing | |
4.2.4 Code Compliance |
4.3 Healthcare, BY End Use (USD Billion) | |
4.3.1 New Construction | |
4.3.2 Renovation | |
4.3.3 Maintenance | |
4.3.4 Upgrades |
4.4 Healthcare, BY Inspection Frequency (USD Billion) | |
4.4.1 Annual | |
4.4.2 Biannual | |
4.4.3 Quarterly | |
4.4.4 On-Demand |
4.5 Healthcare, BY Regulatory Compliance (USD Billion) | |
4.5.1 National Electrical Code | |
4.5.2 Local Building Codes | |
4.5.3 Safety Standards |
4.6 Healthcare, BY Region (USD Billion) | |
4.6.1 North America | | |
4.6.1.1 US | | |
4.6.1.2 Canada | |
4.6.2 Europe | | |
4.6.2.1 Germany | | |
4.6.2.2 UK | | |
4.6.2.3 France | | |
4.6.2.4 Russia | | |
4.6.2.5 Italy | | |
4.6.2.6 Spain | | |
4.6.2.7 Rest of Europe | |
4.6.3 APAC | | |
4.6.3.1 China | | |
4.6.3.2 India | | |
4.6.3.3 Japan | | |
4.6.3.4 South Korea | | |
4.6.3.5 Malaysia | | |
4.6.3.6 Thailand | | |
4.6.3.7 Indonesia | | |
4.6.3.8 Rest of APAC | |
4.6.4 South America | | |
4.6.4.1 Brazil | | |
4.6.4.2 Mexico | | |
4.6.4.3 Argentina | | |
4.6.4.4 Rest of South America | |
4.6.5 MEA | | |
4.6.5.1 GCC Countries | | |
4.6.5.2 South Africa | | |
4.6.5.3 Rest of MEA 5
SECTION V: COMPETITIVE ANALYSIS |
5.1 Competitive Landscape | |
5.1.1 Overview | |
5.1.2 Competitive Analysis | |
5.1.3 Market share Analysis | |
5.1.4 Major Growth Strategy in the Healthcare | |
5.1.5 Competitive Benchmarking | |
5.1.6 Leading Players in Terms of Number of Developments in the Healthcare | |
5.1.7 Key developments and growth strategies | | |
5.1.7.1 New Product Launch/Service Deployment | | |
5.1.7.2 Merger & Acquisitions | | |
5.1.7.3 Joint Ventures | |
5.1.8 Major Players Financial Matrix | | |
5.1.8.1 Sales and Operating Income | | |
5.1.8.2 Major Players R&D Expenditure. 2023 |
5.2 Company Profiles | |
5.2.1 Schneider Electric (FR) | | |
5.2.1.1 Financial Overview | | |
5.2.1.2 Products Offered | | |
5.2.1.3 Key Developments | | |
5.2.1.4 SWOT Analysis | | |
5.2.1.5 Key Strategies | |
5.2.2 Siemens (DE) | | |
5.2.2.1 Financial Overview | | |
5.2.2.2 Products Offered | | |
5.2.2.3 Key Developments | | |
5.2.2.4 SWOT Analysis | | |
5.2.2.5 Key Strategies | |
5.2.3 General Electric (US) | | |
5.2.3.1 Financial Overview | | |
5.2.3.2 Products Offered | | |
5.2.3.3 Key Developments | | |
5.2.3.4 SWOT Analysis | | |
5.2.3.5 Key Strategies | |
5.2.4 Eaton (US) | | |
5.2.4.1 Financial Overview | | |
5.2.4.2 Products Offered | | |
5.2.4.3 Key Developments | | |
5.2.4.4 SWOT Analysis | | |
5.2.4.5 Key Strategies | |
5.2.5 ABB (CH) | | |
5.2.5.1 Financial Overview | | |
5.2.5.2 Products Offered | | |
5.2.5.3 Key Developments | | |
5.2.5.4 SWOT Analysis | | |
5.2.5.5 Key Strategies | |
5.2.6 Honeywell (US) | | |
5.2.6.1 Financial Overview | | |
5.2.6.2 Products Offered | | |
5.2.6.3 Key Developments | | |
5.2.6.4 SWOT Analysis | | |
5.2.6.5 Key Strategies | |
5.2.7 Emerson Electric (US) | | |
5.2.7.1 Financial Overview | | |
5.2.7.2 Products Offered | | |
5.2.7.3 Key Developments | | |
5.2.7.4 SWOT Analysis | | |
5.2.7.5 Key Strategies | |
5.2.8 Rockwell Automation (US) | | |
5.2.8.1 Financial Overview | | |
5.2.8.2 Products Offered | | |
5.2.8.3 Key Developments | | |
5.2.8.4 SWOT Analysis | | |
5.2.8.5 Key Strategies | |
5.2.9 Legrand (FR) | | |
5.2.9.1 Financial Overview | | |
5.2.9.2 Products Offered | | |
5.2.9.3 Key Developments | | |
5.2.9.4 SWOT Analysis | | |
5.2.9.5 Key Strategies |
5.3 Appendix | |
5.3.1 References | |
5.3.2 Related Reports 6 LIST OF FIGURES |
6.1 MARKET SYNOPSIS |
6.2 NORTH AMERICA MARKET ANALYSIS |
6.3 US MARKET ANALYSIS BY APPLICATION |
6.4 US MARKET ANALYSIS BY SERVICE TYPE |
6.5 US MARKET ANALYSIS BY END USE |
6.6 US MARKET ANALYSIS BY INSPECTION FREQUENCY |
6.7 US MARKET ANALYSIS BY REGULATORY COMPLIANCE |
6.8 CANADA MARKET ANALYSIS BY APPLICATION |
6.9 CANADA MARKET ANALYSIS BY SERVICE TYPE |
6.10 CANADA MARKET ANALYSIS BY END USE |
6.11 CANADA MARKET ANALYSIS BY INSPECTION FREQUENCY |
6.12 CANADA MARKET ANALYSIS BY REGULATORY COMPLIANCE |
6.13 EUROPE MARKET ANALYSIS |
6.14 GERMANY MARKET ANALYSIS BY APPLICATION |
6.15 GERMANY MARKET ANALYSIS BY SERVICE TYPE |
6.16 GERMANY MARKET ANALYSIS BY END USE |
6.17 GERMANY MARKET ANALYSIS BY INSPECTION FREQUENCY |
6.18 GERMANY MARKET ANALYSIS BY REGULATORY COMPLIANCE |
6.19 UK MARKET ANALYSIS BY APPLICATION |
6.20 UK MARKET ANALYSIS BY SERVICE TYPE |
6.21 UK MARKET ANALYSIS BY END USE |
6.22 UK MARKET ANALYSIS BY INSPECTION FREQUENCY |
6.23 UK MARKET ANALYSIS BY REGULATORY COMPLIANCE |
6.24 FRANCE MARKET ANALYSIS BY APPLICATION |
6.25 FRANCE MARKET ANALYSIS BY SERVICE TYPE |
6.26 FRANCE MARKET ANALYSIS BY END USE |
6.27 FRANCE MARKET ANALYSIS BY INSPECTION FREQUENCY |
6.28 FRANCE MARKET ANALYSIS BY REGULATORY COMPLIANCE |
6.29 RUSSIA MARKET ANALYSIS BY APPLICATION |
6.30 RUSSIA MARKET ANALYSIS BY SERVICE TYPE |
6.31 RUSSIA MARKET ANALYSIS BY END USE |
6.32 RUSSIA MARKET ANALYSIS BY INSPECTION FREQUENCY |
6.33 RUSSIA MARKET ANALYSIS BY REGULATORY COMPLIANCE |
6.34 ITALY MARKET ANALYSIS BY APPLICATION |
6.35 ITALY MARKET ANALYSIS BY SERVICE TYPE |
6.36 ITALY MARKET ANALYSIS BY END USE |
6.37 ITALY MARKET ANALYSIS BY INSPECTION FREQUENCY |
6.38 ITALY MARKET ANALYSIS BY REGULATORY COMPLIANCE |
6.39 SPAIN MARKET ANALYSIS BY APPLICATION |
6.40 SPAIN MARKET ANALYSIS BY SERVICE TYPE |
6.41 SPAIN MARKET ANALYSIS BY END USE |
6.42 SPAIN MARKET ANALYSIS BY INSPECTION FREQUENCY |
6.43 SPAIN MARKET ANALYSIS BY REGULATORY COMPLIANCE |
6.44 REST OF EUROPE MARKET ANALYSIS BY APPLICATION |
6.45 REST OF EUROPE MARKET ANALYSIS BY SERVICE TYPE |
6.46 REST OF EUROPE MARKET ANALYSIS BY END USE |
6.47 REST OF EUROPE MARKET ANALYSIS BY INSPECTION FREQUENCY |
6.48 REST OF EUROPE MARKET ANALYSIS BY REGULATORY COMPLIANCE |
6.49 APAC MARKET ANALYSIS |
6.50 CHINA MARKET ANALYSIS BY APPLICATION |
6.51 CHINA MARKET ANALYSIS BY SERVICE TYPE |
6.52 CHINA MARKET ANALYSIS BY END USE |
6.53 CHINA MARKET ANALYSIS BY INSPECTION FREQUENCY |
6.54 CHINA MARKET ANALYSIS BY REGULATORY COMPLIANCE |
6.55 INDIA MARKET ANALYSIS BY APPLICATION |
6.56 INDIA MARKET ANALYSIS BY SERVICE TYPE |
6.57 INDIA MARKET ANALYSIS BY END USE |
6.58 INDIA MARKET ANALYSIS BY INSPECTION FREQUENCY |
6.59 INDIA MARKET ANALYSIS BY REGULATORY COMPLIANCE |
6.60 JAPAN MARKET ANALYSIS BY APPLICATION |
6.61 JAPAN MARKET ANALYSIS BY SERVICE TYPE |
6.62 JAPAN MARKET ANALYSIS BY END USE |
6.63 JAPAN MARKET ANALYSIS BY INSPECTION FREQUENCY |
6.64 JAPAN MARKET ANALYSIS BY REGULATORY COMPLIANCE |
6.65 SOUTH KOREA MARKET ANALYSIS BY APPLICATION |
6.66 SOUTH KOREA MARKET ANALYSIS BY SERVICE TYPE |
6.67 SOUTH KOREA MARKET ANALYSIS BY END USE |
6.68 SOUTH KOREA MARKET ANALYSIS BY INSPECTION FREQUENCY |
6.69 SOUTH KOREA MARKET ANALYSIS BY REGULATORY COMPLIANCE |
6.70 MALAYSIA MARKET ANALYSIS BY APPLICATION |
6.71 MALAYSIA MARKET ANALYSIS BY SERVICE TYPE |
6.72 MALAYSIA MARKET ANALYSIS BY END USE |
6.73 MALAYSIA MARKET ANALYSIS BY INSPECTION FREQUENCY |
6.74 MALAYSIA MARKET ANALYSIS BY REGULATORY COMPLIANCE |
6.75 THAILAND MARKET ANALYSIS BY APPLICATION |
6.76 THAILAND MARKET ANALYSIS BY SERVICE TYPE |
6.77 THAILAND MARKET ANALYSIS BY END USE |
6.78 THAILAND MARKET ANALYSIS BY INSPECTION FREQUENCY |
6.79 THAILAND MARKET ANALYSIS BY REGULATORY COMPLIANCE |
6.80 INDONESIA MARKET ANALYSIS BY APPLICATION |
6.81 INDONESIA MARKET ANALYSIS BY SERVICE TYPE |
6.82 INDONESIA MARKET ANALYSIS BY END USE |
6.83 INDONESIA MARKET ANALYSIS BY INSPECTION FREQUENCY |
6.84 INDONESIA MARKET ANALYSIS BY REGULATORY COMPLIANCE |
6.85 REST OF APAC MARKET ANALYSIS BY APPLICATION |
6.86 REST OF APAC MARKET ANALYSIS BY SERVICE TYPE |
6.87 REST OF APAC MARKET ANALYSIS BY END USE |
6.88 REST OF APAC MARKET ANALYSIS BY INSPECTION FREQUENCY |
6.89 REST OF APAC MARKET ANALYSIS BY REGULATORY COMPLIANCE |
6.90 SOUTH AMERICA MARKET ANALYSIS |
6.91 BRAZIL MARKET ANALYSIS BY APPLICATION |
6.92 BRAZIL MARKET ANALYSIS BY SERVICE TYPE |
6.93 BRAZIL MARKET ANALYSIS BY END USE |
6.94 BRAZIL MARKET ANALYSIS BY INSPECTION FREQUENCY |
6.95 BRAZIL MARKET ANALYSIS BY REGULATORY COMPLIANCE |
6.96 MEXICO MARKET ANALYSIS BY APPLICATION |
6.97 MEXICO MARKET ANALYSIS BY SERVICE TYPE |
6.98 MEXICO MARKET ANALYSIS BY END USE |
6.99 MEXICO MARKET ANALYSIS BY INSPECTION FREQUENCY |
6.100 MEXICO MARKET ANALYSIS BY REGULATORY COMPLIANCE |
6.101 ARGENTINA MARKET ANALYSIS BY APPLICATION |
6.102 ARGENTINA MARKET ANALYSIS BY SERVICE TYPE |
6.103 ARGENTINA MARKET ANALYSIS BY END USE |
6.104 ARGENTINA MARKET ANALYSIS BY INSPECTION FREQUENCY |
6.105 ARGENTINA MARKET ANALYSIS BY REGULATORY COMPLIANCE |
6.106 REST OF SOUTH AMERICA MARKET ANALYSIS BY APPLICATION |
6.107 REST OF SOUTH AMERICA MARKET ANALYSIS BY SERVICE TYPE |
6.108 REST OF SOUTH AMERICA MARKET ANALYSIS BY END USE |
6.109 REST OF SOUTH AMERICA MARKET ANALYSIS BY INSPECTION FREQUENCY |
6.110 REST OF SOUTH AMERICA MARKET ANALYSIS BY REGULATORY COMPLIANCE |
6.111 MEA MARKET ANALYSIS |
6.112 GCC COUNTRIES MARKET ANALYSIS BY APPLICATION |
6.113 GCC COUNTRIES MARKET ANALYSIS BY SERVICE TYPE |
6.114 GCC COUNTRIES MARKET ANALYSIS BY END USE |
6.115 GCC COUNTRIES MARKET ANALYSIS BY INSPECTION FREQUENCY |
6.116 GCC COUNTRIES MARKET ANALYSIS BY REGULATORY COMPLIANCE |
6.117 SOUTH AFRICA MARKET ANALYSIS BY APPLICATION |
6.118 SOUTH AFRICA MARKET ANALYSIS BY SERVICE TYPE |
6.119 SOUTH AFRICA MARKET ANALYSIS BY END USE |
6.120 SOUTH AFRICA MARKET ANALYSIS BY INSPECTION FREQUENCY |
6.121 SOUTH AFRICA MARKET ANALYSIS BY REGULATORY COMPLIANCE |
6.122 REST OF MEA MARKET ANALYSIS BY APPLICATION |
6.123 REST OF MEA MARKET ANALYSIS BY SERVICE TYPE |
6.124 REST OF MEA MARKET ANALYSIS BY END USE |
6.125 REST OF MEA MARKET ANALYSIS BY INSPECTION FREQUENCY |
6.126 REST OF MEA MARKET ANALYSIS BY REGULATORY COMPLIANCE |
6.127 KEY BUYING CRITERIA OF HEALTHCARE |
6.128 RESEARCH PROCESS OF MRFR |
6.129 DRO ANALYSIS OF HEALTHCARE |
6.130 DRIVERS IMPACT ANALYSIS: HEALTHCARE |
6.131 RESTRAINTS IMPACT ANALYSIS: HEALTHCARE |
6.132 SUPPLY / VALUE CHAIN: HEALTHCARE |
6.133 HEALTHCARE, BY APPLICATION, 2024 (% SHARE) |
6.134 HEALTHCARE, BY APPLICATION, 2024 TO 2035 (USD Billion) |
6.135 HEALTHCARE, BY SERVICE TYPE, 2024 (% SHARE) |
6.136 HEALTHCARE, BY SERVICE TYPE, 2024 TO 2035 (USD Billion) |
6.137 HEALTHCARE, BY END USE, 2024 (% SHARE) |
6.138 HEALTHCARE, BY END USE, 2024 TO 2035 (USD Billion) |
6.139 HEALTHCARE, BY INSPECTION FREQUENCY, 2024 (% SHARE) |
6.140 HEALTHCARE, BY INSPECTION FREQUENCY, 2024 TO 2035 (USD Billion) |
6.141 HEALTHCARE, BY REGULATORY COMPLIANCE, 2024 (% SHARE) |
6.142 HEALTHCARE, BY REGULATORY COMPLIANCE, 2024 TO 2035 (USD Billion) |
6.143 BENCHMARKING OF MAJOR COMPETITORS 7 LIST OF TABLES |
7.1 LIST OF ASSUMPTIONS | |
7.1.1 |
7.2 North America MARKET SIZE ESTIMATES; FORECAST | |
7.2.1 BY APPLICATION, 2025-2035 (USD Billion) | |
7.2.2 BY SERVICE TYPE, 2025-2035 (USD Billion) | |
7.2.3 BY END USE, 2025-2035 (USD Billion) | |
7.2.4 BY INSPECTION FREQUENCY, 2025-2035 (USD Billion) | |
7.2.5 BY REGULATORY COMPLIANCE, 2025-2035 (USD Billion) |
7.3 US MARKET SIZE ESTIMATES; FORECAST | |
7.3.1 BY APPLICATION, 2025-2035 (USD Billion) | |
7.3.2 BY SERVICE TYPE, 2025-2035 (USD Billion) | |
7.3.3 BY END USE, 2025-2035 (USD Billion) | |
7.3.4 BY INSPECTION FREQUENCY, 2025-2035 (USD Billion) | |
7.3.5 BY REGULATORY COMPLIANCE, 2025-2035 (USD Billion) |
7.4 Canada MARKET SIZE ESTIMATES; FORECAST | |
7.4.1 BY APPLICATION, 2025-2035 (USD Billion) | |
7.4.2 BY SERVICE TYPE, 2025-2035 (USD Billion) | |
7.4.3 BY END USE, 2025-2035 (USD Billion) | |
7.4.4 BY INSPECTION FREQUENCY, 2025-2035 (USD Billion) | |
7.4.5 BY REGULATORY COMPLIANCE, 2025-2035 (USD Billion) |
7.5 Europe MARKET SIZE ESTIMATES; FORECAST | |
7.5.1 BY APPLICATION, 2025-2035 (USD Billion) | |
7.5.2 BY SERVICE TYPE, 2025-2035 (USD Billion) | |
7.5.3 BY END USE, 2025-2035 (USD Billion) | |
7.5.4 BY INSPECTION FREQUENCY, 2025-2035 (USD Billion) | |
7.5.5 BY REGULATORY COMPLIANCE, 2025-2035 (USD Billion) |
7.6 Germany MARKET SIZE ESTIMATES; FORECAST | |
7.6.1 BY APPLICATION, 2025-2035 (USD Billion) | |
7.6.2 BY SERVICE TYPE, 2025-2035 (USD Billion) | |
7.6.3 BY END USE, 2025-2035 (USD Billion) | |
7.6.4 BY INSPECTION FREQUENCY, 2025-2035 (USD Billion) | |
7.6.5 BY REGULATORY COMPLIANCE, 2025-2035 (USD Billion) |
7.7 UK MARKET SIZE ESTIMATES; FORECAST | |
7.7.1 BY APPLICATION, 2025-2035 (USD Billion) | |
7.7.2 BY SERVICE TYPE, 2025-2035 (USD Billion) | |
7.7.3 BY END USE, 2025-2035 (USD Billion) | |
7.7.4 BY INSPECTION FREQUENCY, 2025-2035 (USD Billion) | |
7.7.5 BY REGULATORY COMPLIANCE, 2025-2035 (USD Billion) |
7.8 France MARKET SIZE ESTIMATES; FORECAST | |
7.8.1 BY APPLICATION, 2025-2035 (USD Billion) | |
7.8.2 BY SERVICE TYPE, 2025-2035 (USD Billion) | |
7.8.3 BY END USE, 2025-2035 (USD Billion) | |
7.8.4 BY INSPECTION FREQUENCY, 2025-2035 (USD Billion) | |
7.8.5 BY REGULATORY COMPLIANCE, 2025-2035 (USD Billion) |
7.9 Russia MARKET SIZE ESTIMATES; FORECAST | |
7.9.1 BY APPLICATION, 2025-2035 (USD Billion) | |
7.9.2 BY SERVICE TYPE, 2025-2035 (USD Billion) | |
7.9.3 BY END USE, 2025-2035 (USD Billion) | |
7.9.4 BY INSPECTION FREQUENCY, 2025-2035 (USD Billion) | |
7.9.5 BY REGULATORY COMPLIANCE, 2025-2035 (USD Billion) |
7.10 Italy MARKET SIZE ESTIMATES; FORECAST | |
7.10.1 BY APPLICATION, 2025-2035 (USD Billion) | |
7.10.2 BY SERVICE TYPE, 2025-2035 (USD Billion) | |
7.10.3 BY END USE, 2025-2035 (USD Billion) | |
7.10.4 BY INSPECTION FREQUENCY, 2025-2035 (USD Billion) | |
7.10.5 BY REGULATORY COMPLIANCE, 2025-2035 (USD Billion) |
7.11 Spain MARKET SIZE ESTIMATES; FORECAST | |
7.11.1 BY APPLICATION, 2025-2035 (USD Billion) | |
7.11.2 BY SERVICE TYPE, 2025-2035 (USD Billion) | |
7.11.3 BY END USE, 2025-2035 (USD Billion) | |
7.11.4 BY INSPECTION FREQUENCY, 2025-2035 (USD Billion) | |
7.11.5 BY REGULATORY COMPLIANCE, 2025-2035 (USD Billion) |
7.12 Rest of Europe MARKET SIZE ESTIMATES; FORECAST | |
7.12.1 BY APPLICATION, 2025-2035 (USD Billion) | |
7.12.2 BY SERVICE TYPE, 2025-2035 (USD Billion) | |
7.12.3 BY END USE, 2025-2035 (USD Billion) | |
7.12.4 BY INSPECTION FREQUENCY, 2025-2035 (USD Billion) | |
7.12.5 BY REGULATORY COMPLIANCE, 2025-2035 (USD Billion) |
7.13 APAC MARKET SIZE ESTIMATES; FORECAST | |
7.13.1 BY APPLICATION, 2025-2035 (USD Billion) | |
7.13.2 BY SERVICE TYPE, 2025-2035 (USD Billion) | |
7.13.3 BY END USE, 2025-2035 (USD Billion) | |
7.13.4 BY INSPECTION FREQUENCY, 2025-2035 (USD Billion) | |
7.13.5 BY REGULATORY COMPLIANCE, 2025-2035 (USD Billion) |
7.14 China MARKET SIZE ESTIMATES; FORECAST | |
7.14.1 BY APPLICATION, 2025-2035 (USD Billion) | |
7.14.2 BY SERVICE TYPE, 2025-2035 (USD Billion) | |
7.14.3 BY END USE, 2025-2035 (USD Billion) | |
7.14.4 BY INSPECTION FREQUENCY, 2025-2035 (USD Billion) | |
7.14.5 BY REGULATORY COMPLIANCE, 2025-2035 (USD Billion) |
7.15 India MARKET SIZE ESTIMATES; FORECAST | |
7.15.1 BY APPLICATION, 2025-2035 (USD Billion) | |
7.15.2 BY SERVICE TYPE, 2025-2035 (USD Billion) | |
7.15.3 BY END USE, 2025-2035 (USD Billion) | |
7.15.4 BY INSPECTION FREQUENCY, 2025-2035 (USD Billion) | |
7.15.5 BY REGULATORY COMPLIANCE, 2025-2035 (USD Billion) |
7.16 Japan MARKET SIZE ESTIMATES; FORECAST | |
7.16.1 BY APPLICATION, 2025-2035 (USD Billion) | |
7.16.2 BY SERVICE TYPE, 2025-2035 (USD Billion) | |
7.16.3 BY END USE, 2025-2035 (USD Billion) | |
7.16.4 BY INSPECTION FREQUENCY, 2025-2035 (USD Billion) | |
7.16.5 BY REGULATORY COMPLIANCE, 2025-2035 (USD Billion) |
7.17 South Korea MARKET SIZE ESTIMATES; FORECAST | |
7.17.1 BY APPLICATION, 2025-2035 (USD Billion) | |
7.17.2 BY SERVICE TYPE, 2025-2035 (USD Billion) | |
7.17.3 BY END USE, 2025-2035 (USD Billion) | |
7.17.4 BY INSPECTION FREQUENCY, 2025-2035 (USD Billion) | |
7.17.5 BY REGULATORY COMPLIANCE, 2025-2035 (USD Billion) |
7.18 Malaysia MARKET SIZE ESTIMATES; FORECAST | |
7.18.1 BY APPLICATION, 2025-2035 (USD Billion) | |
7.18.2 BY SERVICE TYPE, 2025-2035 (USD Billion) | |
7.18.3 BY END USE, 2025-2035 (USD Billion) | |
7.18.4 BY INSPECTION FREQUENCY, 2025-2035 (USD Billion) | |
7.18.5 BY REGULATORY COMPLIANCE, 2025-2035 (USD Billion) |
7.19 Thailand MARKET SIZE ESTIMATES; FORECAST | |
7.19.1 BY APPLICATION, 2025-2035 (USD Billion) | |
7.19.2 BY SERVICE TYPE, 2025-2035 (USD Billion) | |
7.19.3 BY END USE, 2025-2035 (USD Billion) | |
7.19.4 BY INSPECTION FREQUENCY, 2025-2035 (USD Billion) | |
7.19.5 BY REGULATORY COMPLIANCE, 2025-2035 (USD Billion) |
7.20 Indonesia MARKET SIZE ESTIMATES; FORECAST | |
7.20.1 BY APPLICATION, 2025-2035 (USD Billion) | |
7.20.2 BY SERVICE TYPE, 2025-2035 (USD Billion) | |
7.20.3 BY END USE, 2025-2035 (USD Billion) | |
7.20.4 BY INSPECTION FREQUENCY, 2025-2035 (USD Billion) | |
7.20.5 BY REGULATORY COMPLIANCE, 2025-2035 (USD Billion) |
7.21 Rest of APAC MARKET SIZE ESTIMATES; FORECAST | |
7.21.1 BY APPLICATION, 2025-2035 (USD Billion) | |
7.21.2 BY SERVICE TYPE, 2025-2035 (USD Billion) | |
7.21.3 BY END USE, 2025-2035 (USD Billion) | |
7.21.4 BY INSPECTION FREQUENCY, 2025-2035 (USD Billion) | |
7.21.5 BY REGULATORY COMPLIANCE, 2025-2035 (USD Billion) |
7.22 South America MARKET SIZE ESTIMATES; FORECAST | |
7.22.1 BY APPLICATION, 2025-2035 (USD Billion) | |
7.22.2 BY SERVICE TYPE, 2025-2035 (USD Billion) | |
7.22.3 BY END USE, 2025-2035 (USD Billion) | |
7.22.4 BY INSPECTION FREQUENCY, 2025-2035 (USD Billion) | |
7.22.5 BY REGULATORY COMPLIANCE, 2025-2035 (USD Billion) |
7.23 Brazil MARKET SIZE ESTIMATES; FORECAST | |
7.23.1 BY APPLICATION, 2025-2035 (USD Billion) | |
7.23.2 BY SERVICE TYPE, 2025-2035 (USD Billion) | |
7.23.3 BY END USE, 2025-2035 (USD Billion) | |
7.23.4 BY INSPECTION FREQUENCY, 2025-2035 (USD Billion) | |
7.23.5 BY REGULATORY COMPLIANCE, 2025-2035 (USD Billion) |
7.24 Mexico MARKET SIZE ESTIMATES; FORECAST | |
7.24.1 BY APPLICATION, 2025-2035 (USD Billion) | |
7.24.2 BY SERVICE TYPE, 2025-2035 (USD Billion) | |
7.24.3 BY END USE, 2025-2035 (USD Billion) | |
7.24.4 BY INSPECTION FREQUENCY, 2025-2035 (USD Billion) | |
7.24.5 BY REGULATORY COMPLIANCE, 2025-2035 (USD Billion) |
7.25 Argentina MARKET SIZE ESTIMATES; FORECAST | |
7.25.1 BY APPLICATION, 2025-2035 (USD Billion) | |
7.25.2 BY SERVICE TYPE, 2025-2035 (USD Billion) | |
7.25.3 BY END USE, 2025-2035 (USD Billion) | |
7.25.4 BY INSPECTION FREQUENCY, 2025-2035 (USD Billion) | |
7.25.5 BY REGULATORY COMPLIANCE, 2025-2035 (USD Billion) |
7.26 Rest of South America MARKET SIZE ESTIMATES; FORECAST | |
7.26.1 BY APPLICATION, 2025-2035 (USD Billion) | |
7.26.2 BY SERVICE TYPE, 2025-2035 (USD Billion) | |
7.26.3 BY END USE, 2025-2035 (USD Billion) | |
7.26.4 BY INSPECTION FREQUENCY, 2025-2035 (USD Billion) | |
7.26.5 BY REGULATORY COMPLIANCE, 2025-2035 (USD Billion) |
7.27 MEA MARKET SIZE ESTIMATES; FORECAST | |
7.27.1 BY APPLICATION, 2025-2035 (USD Billion) | |
7.27.2 BY SERVICE TYPE, 2025-2035 (USD Billion) | |
7.27.3 BY END USE, 2025-2035 (USD Billion) | |
7.27.4 BY INSPECTION FREQUENCY, 2025-2035 (USD Billion) | |
7.27.5 BY REGULATORY COMPLIANCE, 2025-2035 (USD Billion) |
7.28 GCC Countries MARKET SIZE ESTIMATES; FORECAST | |
7.28.1 BY APPLICATION, 2025-2035 (USD Billion) | |
7.28.2 BY SERVICE TYPE, 2025-2035 (USD Billion) | |
7.28.3 BY END USE, 2025-2035 (USD Billion) | |
7.28.4 BY INSPECTION FREQUENCY, 2025-2035 (USD Billion) | |
7.28.5 BY REGULATORY COMPLIANCE, 2025-2035 (USD Billion) |
7.29 South Africa MARKET SIZE ESTIMATES; FORECAST | |
7.29.1 BY APPLICATION, 2025-2035 (USD Billion) | |
7.29.2 BY SERVICE TYPE, 2025-2035 (USD Billion) | |
7.29.3 BY END USE, 2025-2035 (USD Billion) | |
7.29.4 BY INSPECTION FREQUENCY, 2025-2035 (USD Billion) | |
7.29.5 BY REGULATORY COMPLIANCE, 2025-2035 (USD Billion) |
7.30 Rest of MEA MARKET SIZE ESTIMATES; FORECAST | |
7.30.1 BY APPLICATION, 2025-2035 (USD Billion) | |
7.30.2 BY SERVICE TYPE, 2025-2035 (USD Billion) | |
7.30.3 BY END USE, 2025-2035 (USD Billion) | |
7.30.4 BY INSPECTION FREQUENCY, 2025-2035 (USD Billion) | |
7.30.5 BY REGULATORY COMPLIANCE, 2025-2035 (USD Billion) |
What is the current market valuation of the Electrical Wiring and Panel Inspection Services Market?
The market valuation reached 5.5 USD Billion in 2024.
What is the projected market size for the Electrical Wiring and Panel Inspection Services Market by 2035?
The market is expected to grow to 8.0 USD Billion by 2035.
What is the expected CAGR for the Electrical Wiring and Panel Inspection Services Market during the forecast period?
The market is projected to experience a CAGR of 3.46% from 2025 to 2035.
Which segments are included in the Electrical Wiring and Panel Inspection Services Market?
The market segments include Residential, Commercial, Industrial, and Institutional applications.
What are the key service types in the Electrical Wiring and Panel Inspection Services Market?
Key service types encompass Visual Inspection, Thermal Imaging, Electrical Testing, and Code Compliance.
How does the market perform in terms of inspection frequency?
The market segments by inspection frequency include Annual, Biannual, Quarterly, and On-Demand inspections.
What are the end-use categories in the Electrical Wiring and Panel Inspection Services Market?
End-use categories consist of New Construction, Renovation, Maintenance, and Upgrades.
Which regulatory compliance standards are relevant to the market?
The market adheres to the National Electrical Code, Local Building Codes, and Safety Standards.
Who are the key players in the Electrical Wiring and Panel Inspection Services Market?
Prominent players include Schneider Electric, Siemens, General Electric, Eaton, and ABB.
What is the expected growth trend for the Electrical Wiring and Panel Inspection Services Market?
The market appears to be on a growth trajectory, with increasing demand for inspection services projected through 2035.

Author
Author
Shubham Munde
Team Lead - Research
Shubham brings over 7 years of expertise in Market Intelligence and Strategic Consulting, with a strong focus on the Automotive, Aerospace, and Defense sectors. Backed by a solid foundation in semiconductors, electronics, and software, he has successfully delivered high-impact syndicated and custom research on a global scale. His core strengths include market sizing, forecasting, competitive intelligence, consumer insights, and supply chain mapping. Widely recognized for developing scalable growth strategies, Shubham empowers clients to navigate complex markets and achieve a lasting competitive edge. Trusted by start-ups and Fortune 500 companies alike, he consistently converts challenges into strategic opportunities that drive sustainable growth.
No country-specific reports available for this market.
Customer Stories
“This is really good guys. Excellent work on a tight deadline. I will continue to use you going forward and recommend you to others. Nice job”

Noah MalgeriCo-Founder
“Thanks. It’s been a pleasure working with you, please use me as reference with any other Intel employees.”
Joseph AguayoSales Operations & Pricing Manager
“Thanks for sending the report it gives us a good global view of the Betaïne market.”
Peter Groot koerkampAccount and Business Manager
“Thank you, this will be very helpful for OQS.”

La Terria DoddProgram Support Specialist
“We found the report very insightful! we found your research firm very helpful. I'm sending this email to secure our future business.”

Younghwan ChoiSenior Retail Manager
“I am very pleased with how market segments have been defined in a relevant way for my purposes (such as "Portable Freezers & refrigerators" and "last-mile").
In general the report is well structured. Thanks very much for your efforts.”

Mark IrwinManagement Consultant
“I have been reading the first document or the study, ,the Global HVAC and FP market report 2021 till 2026. Must say, good info! I have not gone in depth at all parts, but got a good indication of the data inside!”

Rob KooikerGroup Product Manager HVAC & Fire Protection GMA
“We got the report in time, we really thank you for your support in this process. I also thank to all of your team as they did a great job.”

Akif MorogluStrategy & Business Development Director
“The Automotive 48V ECU Components Procurement Intelligence Study” was a complex project, but the Market Research Future (MRFR) team handled it with quality, agility, and customer-centricity. They delivered all requested data on time and within the agreed scope. The team, including Shubhendra Anand and Rahul Gotadki, was always readily available to clarify questions and swiftly implement necessary adjustments, driving the project to a successful conclusion within a very demanding timeframe.
I would also like to specifically commend Akshay Agarwal for his responsiveness and support at every stage—from our initial inquiry on May 6th through to final delivery on June 18th. His dedication made the entire process seamless.”

Guilherme Gomes MartinsProduct Management Director