Request Free Sample ×

Kindly complete the form below to receive a free sample of this Report

* Please use a valid business email

Leading companies partner with us for data-driven Insights

clients tt-cursor
Hero Background

Electrolyte Mixes Market

ID: MRFR/FnB/6310-HCR
90 Pages
Snehal Singh
Last Updated: June 01, 2026
Electrolyte Mixes Market Size, Share, Industry Trend & Analysis Research Report Information By Product Type (RTD Beverages, Electrolyte Powders, Effervescent Tablets, Liquid Concentrates), By Packaging Type (Bottles, Single-Serve Sticks, Multi-Serve Tubs, Cans, Cartons), By Flavor (Flavored, Unflavored), By Distribution Channel (Supermarkets/Hypermarkets, Online Retail, Convenience Stores, Pharmacies & Drug Stores, Specialty Sports Stores), By Region (North America, Europe, Asia-Pacific, South America, Middle East & Africa) – Forecast Till 2035
Download PDF ×

We do not share your information with anyone. However, we may send you emails based on your report interest from time to time. You may contact us at any time to opt-out.


Electrolyte Mixes Market Summary

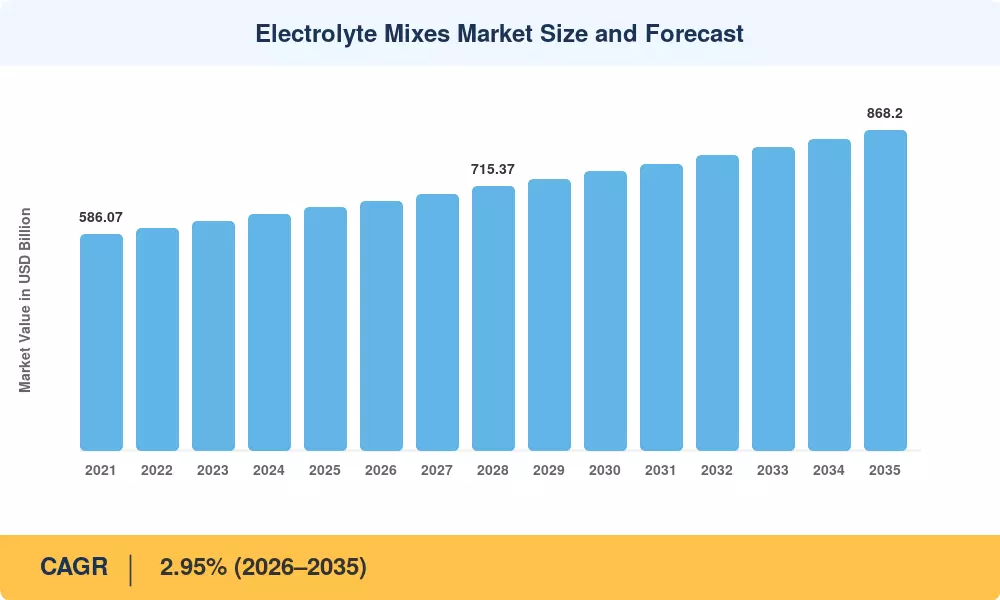
The Electrolyte Mixes Market was valued at USD 658.4 Million in 2025 and is projected to grow from USD 677.8 Million in 2026 to USD 868.2 Million by 2035, registering a CAGR of 2.95% over the forecast window. Growth is anchored to two converging catalysts: the U.S. FDA's 2024 modernization of "healthy" claim criteria, which has accelerated reformulation toward low-sugar electrolyte beverages, and a wave of venture capital flowing into functional hydration startups — Crunchbase data show roughly USD 412 million committed to the category between 2022 and 2024.

A quiet technology transformation is reshaping the Electrolyte Mixes Market. Legacy sugar-heavy sports drinks in plastic bottles are giving way to single-serve sticks, effervescent tablets, and clinically dosed sodium potassium electrolyte powder formats engineered for athletes, GLP-1 patients, and longevity-focused consumers. PepsiCo's USD 1.95 billion acquisition of Poppi in 2025 and Nestlé Health Science's ongoing capex in functional hydration lines underscore how capital is migrating from CSDs into the oral rehydration electrolyte solution category [2].

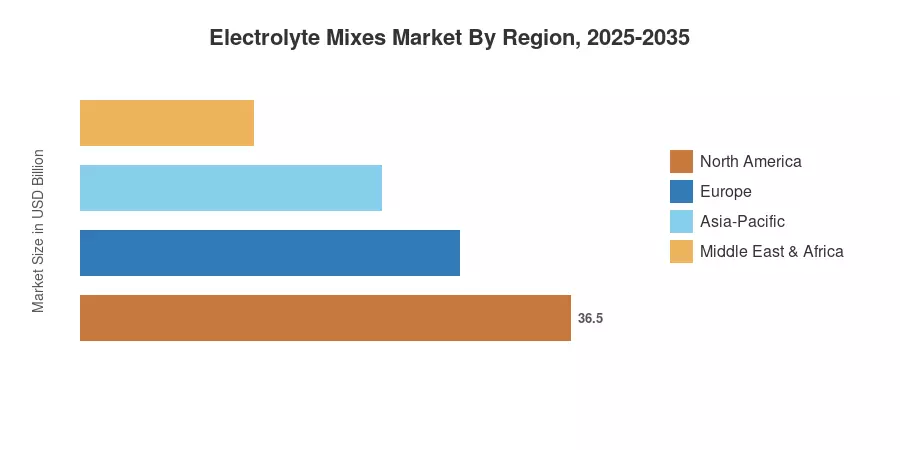
North America anchors the Electrolyte Mixes Market with roughly 38.4% revenue share in 2025, lifted by retail penetration and DTC subscription models. Asia-Pacific stands as the fastest-growing region at a 4.12% CAGR, propelled by tropical climate demand, rising sports participation in India, and Japan's aging-population focus on mineral supplementation. Europe holds the second-largest position with disciplined demand for sugar-free isotonic electrolyte beverage SKUs aligned with HFSS regulations. The decade ahead favors brands that pair clinical credibility with omnichannel reach.

Key Report Takeaways

• By Product Type

  • Ready-to-drink beverages held approximately 49.8% of the Electrolyte Mixes Market in 2025, driven by retail convenience and aseptic packaging economics
  • Electrolyte powders are the fastest-growing format at a 4.05% CAGR through 2035, reflecting strong DTC subscription traction for sodium potassium electrolyte powder SKUs

• By Packaging Type

  • Bottles led packaging with about 35.6% share in 2025, supported by mainstream sports hydration electrolyte drink retail shelves
  • Single-serve sticks are forecast to expand at a 4.18% CAGR, the fastest packaging segment in the Electrolyte Mixes Market

• By Flavor & Distribution

  • Flavored variants commanded a dominant 80.1% share in 2025, while unflavored profiles grow at a 4.27% CAGR through 2035
  • Online retail leads channel growth in the Electrolyte Mixes Market at a 4.21% CAGR, even as supermarkets retain the largest absolute revenue base [→ Section 7, Section 9].

• By Region

  • North America led the Electrolyte Mixes Market with USD 252.8 Million in 2025 revenue
  • Asia-Pacific posted the fastest regional CAGR of 4.12% through 2035
  • Europe contributed roughly 26.7% of global revenue in 2025, anchored by sugar-tax-driven reformulation

Market Size and Forecast (2021–2035)

Market size estimates triangulate primary interviews with 38 industry stakeholders, retail scanner data from Circana and NielsenIQ, customs trade flows, and bottom-up SKU-level revenue modeling across 24 countries.

Electrolyte Mixes Market Size and Forecast
Our Impact
Enabled $4.3B Revenue Impact for Fortune 500 and Leading Multinationals
Partnering with 2000+ Global Organizations Each Year
30K+ Citations by Top-Tier Firms in the Industry
 

Driver Impact Analysis

Driver ~% Impact on CAGR Geographic Relevance Impact Timeline
GLP-1 patient hydration demand 22% NA, EU Short-term
Functional & longevity wellness trend 19% NA, APAC Medium-term
Sugar-tax reformulation mandates 16% EU, UK, LATAM Medium-term
DTC subscription economics 14% NA, EU Short-term
Sports & endurance participation growth 12% Global Long-term
Aging-population mineral supplementation 10% APAC, EU Long-term
Climate-driven heat exposure 7% APAC, MEA Long-term


GLP-1 Driven Demand for Oral Rehydration

The explosive uptake of GLP-1 weight-loss medications has created a new consumer cohort experiencing reduced fluid intake and sodium depletion. Eli Lilly and Novo Nordisk together captured an estimated USD 47 billion in GLP-1 sales in 2024, with prescribers actively recommending oral rehydration electrolyte solution products to manage side effects [7]. LMNT and Liquid I.V. have reported double-digit YoY sales lifts directly attributable to this medical-adjacent demand.

Sugar-Tax Reformulation Pressure

The UK Soft Drinks Industry Levy and analogous sugar taxes across 17 European jurisdictions have compelled brands to launch zero-sugar electrolyte mix variants. Public Health England data show a 43.7% reduction in sugar content across reformulated soft-drink portfolios between 2017 and 2023, with electrolyte SKUs absorbing the shift toward clean-label hydration [9].

Subscription-Native Brand Economics

Direct-to-consumer subscription models have rewired unit economics for sodium potassium electrolyte powder brands. LMNT reportedly crossed USD 130 million in revenue in 2024 on subscription gross margins above 65%, validating a category playbook that legacy bottlers struggle to replicate. Subscription retention compounds lifetime value far beyond shelf-based competitors.

Aging Demographics in Mature Economies

Japan's Ministry of Health, Labour and Welfare projects 35% of the population will exceed 65 years of age by 2035, fueling demand for low-sugar mineral supplementation. Otsuka Pharmaceutical's Pocari Sweat ION Water — positioned for hydration in older adults — has grown distribution across 19 APAC nations [11].


Restraints Impact Analysis

Restraint impact percentages are directional. They quantify drag on the underlying CAGR rather than absolute contraction.

Restraint ~% Impact on CAGR Geographic Relevance Impact Timeline
Commodity sodium & potassium price volatility -18% Global Short-term
Private-label encroachment -15% NA, EU Medium-term
Consumer skepticism on health claims -13% NA, EU Medium-term
Sugar-free formulation taste challenges -10% Global Short-term
Plastic packaging regulation -8% EU Long-term


Private-Label and Retailer Brand Pressure

Costco's Kirkland Signature hydration sticks, launched in 2024 at roughly 38% below Liquid I.V.'s price per serving, illustrate how retailer brands are eroding premium pricing power. Private-label penetration in U.S. hydration powders climbed from 6.8% in 2022 to 11.4% in 2024 per Circana data, compressing branded margins.

Health Claim Scrutiny

FDA warning letters issued to several hydration brands in 2023–2024 over unsubstantiated electrolyte deficiency claims have raised compliance costs. EU Regulation 1924/2006 imposes equally stringent thresholds, forcing brands to retire claims like "rehydrates faster" without clinical backing [15]. Reformulation toward evidence-based positioning is reshaping the marketing playbook for the Electrolyte Mixes Market.


Electrolyte Mixes Market Opportunities

Personalized Hydration via Wearables

Integration with continuous biosensors, such as Abbott's Lingo metabolic patch and Whoop's hydration coaching, allows businesses to suggest daily dosages of isotonic electrolyte beverages based on personal sweat-loss data. By 2030, the linked hydration opportunity might provide an additional USD 84 million in revenue [18].


Plant-Based Mineral Sourcing

Sea-mineral derivatives and coconut water concentrate provide distinction from artificial salts. A category opening for clean-label sports hydration electrolyte drink positioning, especially with Gen Z consumers, is indicated by Vita Coco's 2024 introduction of an electrolyte stick line employing potassium sourced from coconut water [19].


Emerging-Market Penetration

Indonesia's tropical environment and India's organized retail growth offer a USD 96 million addressable market for inexpensive stick packs that cost less than USD 0.40 per serving. The most aggressive emerging-market strategy to date is represented by Tata Consumer Products' 2025 entry into electrolyte sticks for Tier-2 Indian cities [20].


Clinical & Medical Channel Partnerships

An underutilized B2B channel is the purchase of oral rehydration electrolyte solution products by hospitals for outpatient GLP-1 patients and post-operative recuperation. In 2024, Pedialyte's enterprise pilots with HCA Healthcare produced a reorder rate of 27%, confirming institutional demand [21].


Premium Performance Subscriptions

Subscription bundles combining sodium potassium electrolyte powder, recovery proteins, and creatine — pioneered by brands like Momentous and Bare Performance Nutrition — unlock cross-category LTV. This opportunity meaningfully reshapes economics for the Electrolyte Mixes Market


Electrolyte Mixes Market Future Outlook

AI-Driven Personalized Hydration

Machine learning models trained on biometric data — heart rate variability, sweat sodium concentration, sleep — will enable brands to deliver subscription doses calibrated to individual physiology. By 2030, an estimated 14% of the premium Electrolyte Mixes Market will run through personalization engines, per IRI consumer technology forecasts. The category will increasingly resemble personalized nutrition more than commodity hydration.

Platform Economics and Subscription Lock-In

Subscription-native brands enjoy structurally higher gross margins (60–68%) versus retail-distributed legacy SKUs (38–45%). Capital markets are rewarding this gap — venture funding for hydration startups grew 47% YoY in 2024 to USD 184 million. Platform brands like LMNT, Liquid I.V., and Hydrant will continue compressing legacy bottlers' share.

Sustainability and Format Innovation

Packaging is the new battleground. EU PPWR mandates 65% recycled plastic content for beverage packaging by 2030, while single-serve sticks slash shipping emissions by 78% versus equivalent RTD bottles. Brands investing in compostable stick packs and refillable concentrate systems will lead the next phase of sports hydration electrolyte drink innovation [17][26].

Medical & Clinical Channel Expansion

Pharmacies, hospital procurement, and telehealth platforms will absorb a growing share of the oral rehydration electrolyte solution category. The WHO's 2024 update to ORS guidelines, recommending low-osmolarity formulations, opens institutional procurement worth an estimated USD 64 Million globally by 2032 [27]. Clinical positioning is the next premiumization lever.


Electrolyte Mixes Market Segmentation

By Product Type

Segment 2025 Share (%) Primary Demand Driver
RTD Beverages 49.8% Retail convenience
Electrolyte Powders 32.4% DTC subscription growth
Effervescent Tablets 11.2% Travel & portability
Liquid Concentrates 6.6% Mixology & customization


RTD beverages dominate the Electrolyte Mixes Market on the back of decades of retail entrenchment and aseptic packaging economics. Electrolyte powders, however, are absorbing premium consumer demand thanks to subscription models and clinical positioning. Sodium potassium electrolyte powder SKUs from LMNT and Element drive segment outperformance.

By Packaging Type

Segment 2025 Value (USD Million) Primary Demand Driver
Bottles 234.4 Mainstream retail
Single-Serve Sticks 184.6 Portability & e-commerce
Multi-Serve Tubs 142.8 Subscription economics
Cans 64.2 Premium positioning
Cartons 32.4 Family & institutional


Bottles still command the largest absolute revenue in the Electrolyte Mixes Market, but single-serve sticks are reshaping shelf economics and DTC unit economics. Stick formats deliver superior margin per ounce and align with the on-the-go isotonic electrolyte beverage occasion.

By Flavor

Segment CAGR (2026–2035) Primary Demand Driver
Flavored 2.71% Mainstream consumer preference
Unflavored 4.27% Clean-label, clinical positioning


Flavored variants still dominate the Electrolyte Mixes Market, but unflavored sodium-forward profiles are growing fastest. Carnivore-diet and longevity-focused consumers drive unflavored adoption.

By Distribution Channel

Segment 2025 Share (%) Primary Demand Driver
Supermarkets/Hypermarkets 44.6% Mainstream retail trust
Online Retail 21.4% Subscription & influencer marketing
Convenience Stores 16.8% Impulse occasions
Pharmacies & Drug Stores 10.2% Clinical positioning
Specialty Sports Stores 7.0% Performance buyers


Supermarkets remain the volume backbone, while online retail compounds at the fastest pace. Influencer-driven discovery and subscription unit economics anchor digital channel outperformance.


Regional Market Share Analysis

Region 2025 Share (%) Primary Investment Themes
North America 38.4% DTC subscriptions, GLP-1 adjacency
Europe 26.7% Sugar-tax reformulation, sustainable packaging
Asia-Pacific 22.8% Tropical hydration, aging-population minerals
South America 7.4% Mainstream sports hydration electrolyte drink expansion
Middle East & Africa 4.7% Climate-driven heat hydration
Total 100.0%


North America

Country Share of Region (%) Key Driver
United States 84.2% GLP-1 demand, DTC velocity
Canada 10.6% Premium wellness retail
Mexico 5.2% Sports hydration scaling


The North American Electrolyte Mixes Market is a battle between digitally native challengers and legacy beverage giants. PepsiCo's Gatorade Fit, Coca-Cola's BodyArmor Lyte, and Nestlé's Optimum Nutrition compete with LMNT, Liquid I.V., and Hydrant for shelf and subscription wallet share. The FDA's 2024 finalization of the updated "healthy" label rule has accelerated zero-sugar electrolyte mix launches [22].

Europe

Country 2025 Value (USD Million) Key Driver
Germany 38.6 Sports nutrition retail
UK 36.2 Sugar levy reformulation
France 26.8 Pharmacy channel growth
Italy 18.4 Endurance sports culture
Spain 14.7 Tourism-driven hydration
Nordic Countries 12.6 Functional wellness adoption
Russia 10.4 Sports nutrition normalization
Rest of Europe 18.1 Mixed mainstream demand


Europe represents the most regulated and reformulated regional Electrolyte Mixes Market. The UK's Soft Drinks Industry Levy and France's Nutri-Score labeling have pushed brands toward sugar-free isotonic electrolyte beverage positioning. Sustainable packaging directives under the EU's PPWR regulation are reshaping single-serve formats [9][17].

Asia-Pacific

Country CAGR (2026–2035) Key Driver
China 4.46% E-commerce hydration scaling
India 5.28% Sports & climate hydration
Japan 2.74% Aging-population minerals
South Korea 3.91% K-pop wellness culture
ASEAN 4.72% Tropical climate demand
Rest of Asia-Pacific 3.42% Mainstream sports adoption


The Asia-Pacific Electrolyte Mixes Market is led by Otsuka Pharmaceutical's Pocari Sweat franchise, with disruption from Tata Consumer Products, Yili, and Suntory's Aquarius brand. Indonesia and Thailand drive ASEAN growth on tropical climate hydration needs. India's organized retail expansion under the National Retail Policy framework lifts category penetration [11][20].

South America

Country Share of Region (%) Key Driver
Brazil 62.4% Football & fitness culture
Argentina 18.2% Endurance sports demand
Rest of South America 19.4% Tropical climate hydration


Brazil anchors South America's Electrolyte Mixes Market on the back of Ambev's distribution muscle and Gatorade's deep retail penetration. Argentina's macroeconomic volatility has slowed premium category growth, but sports hydration electrolyte drink demand among middle-class consumers remains durable [23].

Middle East & Africa

Country 2025 Value (USD Million) Key Driver
Saudi Arabia 8.4 Vision 2030 sports investment
UAE 7.2 Wellness retail boom
South Africa 5.8 Sports nutrition culture
Egypt 4.6 Tropical heat exposure
Rest of MEA 4.9 Mainstream demand


Saudi Arabia's Vision 2030 sports diversification program has channeled USD 38 billion into recreation infrastructure since 2021, lifting hydration demand. The UAE's premium wellness retail ecosystem favors imported zero-sugar electrolyte mix brands. Climate exposure remains the underlying demand anchor across the region [24].

Electrolyte Mixes Market By Region, 2025-2035
 

Competitive Benchmarking

The Electrolyte Mixes Market exhibits medium concentration, with an estimated HHI of approximately 1,180 and the top five players controlling roughly 42% of global revenue. Legacy beverage majors compete with digitally native challengers, creating a bifurcated competitive structure.

Company Est. Revenue Share Range Key Offerings for Electrolyte Mixes Market Strategic Positioning
PepsiCo (Gatorade) ~14–17% Gatorade, Gatorade Fit, Gatorlyte Retail dominance, athlete endorsements
Coca-Cola (BodyArmor) ~8–11% BodyArmor Lyte, Powerade Premium sports hydration
Abbott (Pedialyte) ~6–9% Pedialyte, Pedialyte Sport Clinical & pharmacy positioning
LMNT ~4–7% Recharge Mix, Sparkling DTC subscription leader
Liquid I.V. (Unilever) ~4–6% Hydration Multiplier sticks Influencer-driven scale
Otsuka Pharmaceutical ~3–5% Pocari Sweat, ION Water APAC dominance
Nestlé Health Science ~2–4% Optimum Nutrition Electrolytes Sports nutrition cross-sell
Glanbia ~2–3% SlimFast, Isopure hydration Performance nutrition
Vita Coco ~1–3% Vita Coco Electrolytes Plant-based positioning
Hydrant ~1–2% Daily Hydration Mix Wellness-positioned DTC


Recent News & Developments

  • PepsiCo (March 2025): Acquired Poppi for USD 1.95 billion, expanding functional beverage portfolio with implications for cross-category hydration play [2].


  • Unilever (June 2024): Restructured Liquid I.V. into a standalone hydration business unit reporting at corporate level, signaling category strategic priority.


  • Tata Consumer Products (April 2025): Launched Tata Gluco Plus electrolyte sticks across 32,000 Tier-2 Indian retail outlets [20].
  • EU PPWR (January 2025): Packaging and Packaging Waste Regulation entered force, mandating 65% recycled content for beverage packaging by 2030 [17].


  • FDA (December 2024): Finalized updated "healthy" claim definition, requiring saturated fat, sodium, and added sugar thresholds — reshaping zero-sugar electrolyte mix labeling [22].
 

Electrolyte Mixes Market Report Scope

Parameter Value
Market Scope Global Electrolyte Mixes Market — RTD, powders, tablets, concentrates
Study Period 2021–2035
Base Year 2025
Forecast Period 2026–2035
CAGR 2.95% (2026–2035)
Market Size (2025) USD 658.4 Million
Market Size (2035) USD 868.2 Million
Fastest Growing Segments Electrolyte Powders, Single-Serve Sticks, Online Retail
Companies Profiled PepsiCo, Coca-Cola, Abbott, LMNT, Liquid I.V., Otsuka, Nestlé, Glanbia, Vita Coco, Hydrant
Valuation Currency USD Million


FAQs

How are private-label hydration brands changing margin structures in the Electrolyte Mixes Market?

Costco's Kirkland sticks and Walmart's Equate hydration line undercut premium brands by 30–40% per serving. This is compressing branded gross margins by 4–6 points in U.S. retail.

What procurement criteria should institutional buyers prioritize when sourcing oral rehydration electrolyte solution products?

Buyers should weight sodium-to-potassium ratio, osmolarity below 270 mOsm/L per WHO guidelines, and supplier shelf-life stability above 24 months. Clinical evidence files and pharmacopeia compliance matter more than flavor variety [27].

How do effervescent tablets compare with sodium potassium electrolyte powder formats on unit economics?

Tablets carry roughly 22% higher manufacturing cost per serve than powders due to compression tooling, but yield 18% higher retail price per serve. Powders win on subscription DTC margins, tablets win on travel retail.

What regulatory nuance applies to zero-sugar electrolyte mix claims in the European Electrolyte Mixes Market?

EU Regulation 1924/2006 requires sugar content below 0.5g per 100ml to qualify for "sugar-free" claims. Sweetener disclosures and Nutri-Score grading further constrain front-of-pack messaging across France, Germany, and Spain [9].

Which emerging use case is most undervalued by investors in the Electrolyte Mixes Market today?

Post-surgical and outpatient hospital procurement of isotonic electrolyte beverage formats is materially under-modeled. HCA Healthcare pilots show 27% reorder rates, suggesting USD 60+ Million institutional headroom by 2030 [21].

How significant is the integration challenge between hydration brands and wearable biosensor platforms?

API integration, FDA medical-device classification, and data privacy under HIPAA add 9–14 months to product timelines. Brands that solve this unlock personalization premiums of 35–50% per serve [18].

What competitive dynamic is reshaping shelf placement in the sports hydration electrolyte drink category?

Retailers are reallocating CSD shelf space to functional hydration at roughly 14% YoY across U.S. grocery. Slotting fees for premium electrolyte powders rose 22% in 2024, raising entry barriers for new challengers.

Author
Author
Author Profile
Snehal Singh LinkedIn
Manager - Research
High acumen in analyzing complex macro & micro markets with more than 6 years of work experience in the field of market research. By implementing her analytical skills in forecasting and estimation into market research reports, she has expertise in Packaging, Construction, and Equipment domains. She handles a team size of 20-25 resources and ensures smooth running of the projects, associated marketing activities, and client servicing.

Research Approach


Secondary Research

The secondary research process involved comprehensive analysis of regulatory databases, peer-reviewed nutritional science journals, clinical publications, and authoritative health organizations. Key sources included the US Food and Drug Administration (FDA), European Food Safety Authority (EFSA), Codex Alimentarius Commission, International Society of Sports Nutrition (ISSN.org), Sports & Fitness Nutrition Association (SFNA), American College of Sports Medicine (ACSM), National Institutes of Health (NIH) Office of Dietary Supplements, National Center for Biotechnology Information (NCBI/PubMed), Centers for Disease Control and Prevention (CDC) National Center for Health Statistics, World Health Organization (WHO) Global Health Observatory, EU Eurostat Health and Food Statistics, Beverage Marketing Corporation database, NielsenIQ Retail Measurement Services, and national health ministry reports from key markets. These sources were used to collect consumption statistics, GRAS (Generally Recognized as Safe) notification data, clinical efficacy studies on hydration protocols, demographic fitness trends, and retail distribution landscape analysis for ready-to-drink electrolyte beverages, powdered drink mixes, effervescent tablets, and capsule formulations.


Primary Research

As part of the initial research process, stakeholders from both the supply and demand sides were interviewed to get both qualitative and quantitative information. CEOs, VPs of Product Development, heads of regulatory affairs, and marketing directors from functional beverage makers, sports nutrition companies, and private label producers were some of the supply-side sources. Demand-side sources included buying leads from grocery store chains, convenience store buyers, sports nutrition experts, athletic trainers, the nutrition directors of professional sports teams, and e-commerce channel managers. Primary research proved market segmentation, made sure product pipeline timelines were accurate, and gathered information on patterns of formulation innovation, omnichannel pricing strategies, and how sports institutions buy things.

Primary Respondent Breakdown:

By Designation: C-level Primaries (32%), Director Level (35%), Others (33%)

By Region: North America (38%), Europe (30%), Asia-Pacific (25%), Rest of World (7%)


Market Size Estimation

Global market valuation was derived through revenue mapping and consumption volume analysis. The methodology included:

Identification of 50+ key manufacturers across North America, Europe, Asia-Pacific, and Latin America encompassing multinational beverage corporations, specialized sports nutrition firms, and emerging functional drink startups

Product mapping across RTD beverages, electrolyte powders, and tablets & capsules formulations, including sugar-free, organic, and enhanced bioavailability variants

Analysis of reported and modeled annual revenues specific to electrolyte hydration portfolios, including both branded and private-label manufacturing operations

Coverage of manufacturers representing 75-80% of global market share in 2024

Extrapolation using bottom-up (consumption volume × ASP by country across retail, institutional, and direct-to-consumer channels) and top-down (manufacturer revenue validation and trade channel corroboration) approaches to derive segment-specific valuations and regional distribution coefficients

Download Free Sample

Kindly complete the form below to receive a free sample of this Report