Sports Drink Market (2026 - 2035)

Sports Drink Market Size, Share, Industry Trend & Analysis Research Report Information By Soft Drink Type (Isotonic, Hypertonic, Hypotonic, Others), By Packaging Type (PET Bottles, Glass Bottles, Metal Cans, Others), By Distribution Channel (Supermarkets/Hypermarkets, Convenience Stores, Specialty Stores, Online Retail), By Functionality (Pre-Workout, Intra-Workout, Post-Workout, Others) โ€“ Forecast Till 2035
ID: MRFR/FnB/0650-HCR
115 Pages
Sakshi Gupta
Last Updated: July 02, 2026
Sports Drink Market
Market Size
Forecast Period2026-2035
CAGR (2026-2035)5.54%
2025 Market SizeUSD 29.42 Billion
2035 Market SizeUSD 50.46 Billion
Key Players
PepsiCo Inc.
Abbott Laboratories
Otsuka Pharmaceutical Co., Ltd.
Monster Beverage Corporation
Suntory Beverage & Food Limited
Danone S.A.
Opportunities
  • Emerging-Market Gym Culture Expansion
  • Powder and Concentrate Format Innovation
  • Data-Driven Personalized Hydration Platforms

Sports Drink Market Summary

The global Sports Drink Market was valued at USD 29.42 billion in 2025 and is projected to grow from USD 31.05 billion in 2026 to USD 50.46 billion by 2035, registering a CAGR of 5.54% during the forecast period (2026โ€“2035). Government-backed fitness promotion programs across 40+ countries and the mainstreaming of electrolyte hydration drink formats among non-athlete consumers have shifted this category from a niche athletic staple into a daily wellness product. The convergence of subscription-based direct-to-consumer channels with rising health consciousness among working-age populations continues to underpin demand acceleration.

Product innovation has reshaped the Sports Drink Market over the past three years. Legacy high-sugar formulations are giving way to zero-sugar, plant-based, and functional hydration blends enriched with vitamins, BCAAs, and adaptogens. PepsiCo alone committed over USD 550 million to reformulation and capacity expansion across its Gatorade franchise between 2023 and 2025, while Coca-Cola integrated its BodyArmor acquisition into a unified sports hydration portfolio [2]. These investments reflect a broader industry pivot toward clean-label transparency and science-backed efficacy claims.

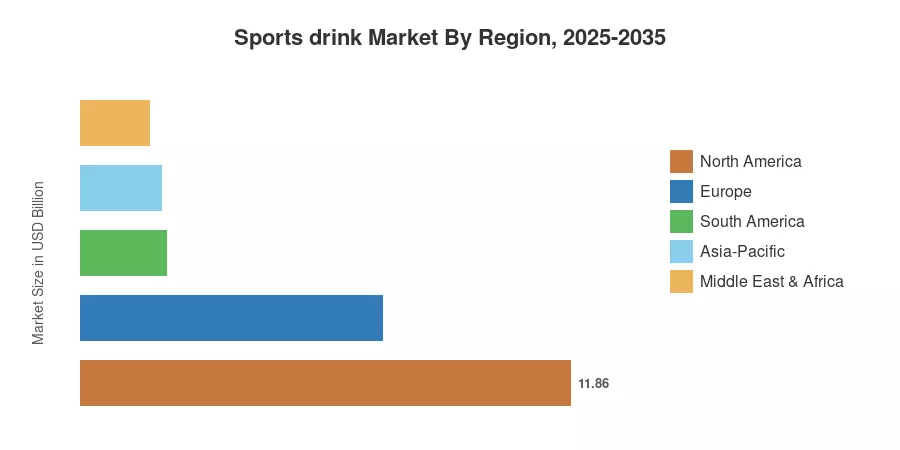
North America dominated the Sports Drink Market in 2025 with a 40.3% revenue share, driven by entrenched brand loyalty and robust convenience-store distribution networks. Asia-Pacific is set to register the fastest CAGR of 6.70% through 2035, fueled by urbanization, rising disposable incomes, and expanding gym culture in China, India, and Southeast Asia. Europe held the second-largest share at approximately 24.8%, supported by regulatory shifts encouraging reduced-sugar beverage reformulation. The decade ahead will likely see premiumization, wearable-linked personalized hydration, and powder-format convenience reshape the competitive landscape of the Sports Drink Market.

ย 

Key Report Takeaways

โ€ข By Soft Drink Type

  • Isotonic beverages captured 56.2% of total Sports Drink Market volume in 2025, supported by broad consumer familiarity and clinical endorsement for moderate-intensity rehydration.
  • Hypertonic variants are forecast to expand at a 7.12% CAGR through 2035 as endurance athletes seek higher carbohydrate concentrations for prolonged events.

โ€ข By Packaging Type

  • PET bottles accounted for 60.3% of the Sports Drink Market revenue in 2025, remaining the preferred single-serve format across retail and on-the-go consumption.
  • Aseptic packages are projected to grow at a 7.22% CAGR, gaining ground through e-commerce-friendly shipping profiles.

โ€ข By Region

  • North America generated 40.3% of the global Sports Drink Market revenue in 2025.
  • Asia-Pacific is expected to advance at a 6.70% CAGR during 2026โ€“2035, the fastest among all regions.

ย 

Market Size and Forecast (2021โ€“2035)

Market Research Future's proprietary estimation framework integrates primary trade interviews, import/export ledgers, manufacturer revenue disclosures, and distributor shipment data. Historical figures (2021โ€“2024) rely on audited company financials and verified industry databases, while forecast figures (2026โ€“2035) apply scenario-weighted regression against macroeconomic and consumer health indicators.
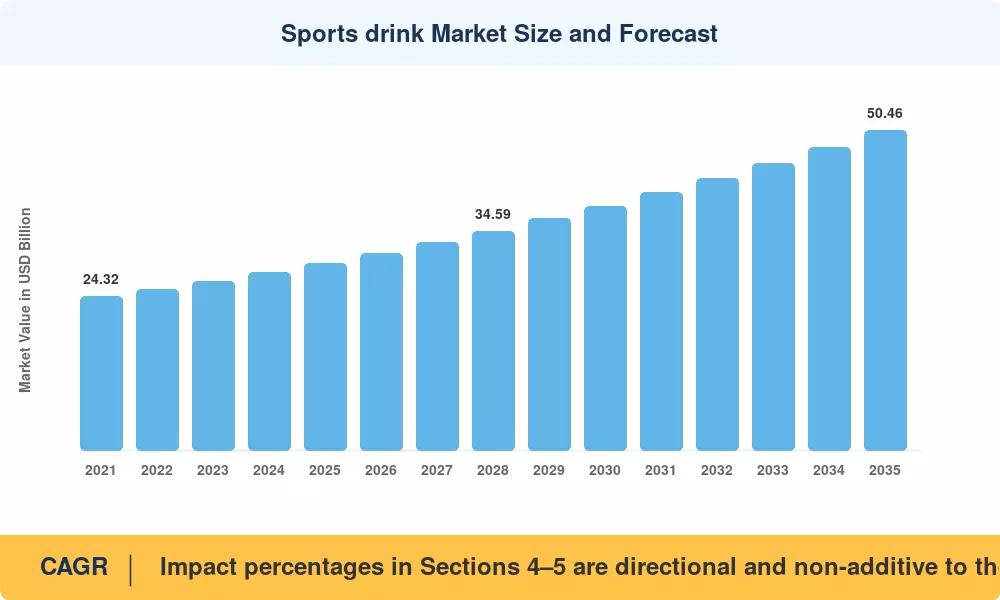
Sports drink Market Size and Forecast
Our Impact
Enabled $4.3B Revenue Impact for Fortune 500 and Leading Multinationals
Partnering with 2000+ Global Organizations Each Year
30K+ Citations by Top-Tier Firms in the Industry

Driver Impact Analysis

Driver ~% Impact on CAGR Geographic Relevance Impact Timeline
Rising health & fitness consciousness 1.3% Global Short-term
Clean-label and zero-sugar reformulation 1.1% North America, Europe Medium-term
E-commerce and DTC subscription growth 0.9% Global Short-term
Government fitness mandates 0.7% Asia-Pacific, Europe Medium-term
Wearable-linked personalized hydration 0.6% North America, Asia-Pacific Long-term
Convenience-format innovation (powders, sticks) 0.5% Global Short-term
Premiumization and functional ingredient layering 0.4% North America, Europe Long-term

ย 

Rising Health and Fitness Consciousness

Global gym memberships surpassed 210 million in 2024, up 14% from 2021, according to the International Health, Racquet & Sportsclub Association. This expansion has pulled the Sports Drink Market beyond elite athletics into everyday hydration routines. Employers in the U.S. and Japan now include hydration benefits in corporate wellness programs, creating a recurring consumption base that flattens seasonal demand volatility.

Clean-Label and Zero-Sugar Reformulation

The WHO's 2024 guideline recommending that adults limit free sugar intake to below 5% of total energy has catalyzed reformulation across the Sports Drink Market [4]. PepsiCo's Gatorade Zero franchise grew 22% year-over-year in 2024, while Coca-Cola launched Powerade Zero Sugar in 18 new markets. Stevia- and monk-fruit-sweetened variants now represent roughly 28% of new product launches in the category.

E-Commerce and DTC Subscription Growth

Online retail's share of Sports Drink Market distribution is expanding rapidly, with subscription models offering 15โ€“20% price discounts driving repeat purchase rates above 60% in North America [5]. Amazon's sports nutrition subcategory grew 31% in GMV during 2024, and regional platforms like JD.com and Mercado Libre are replicating the model in Asia-Pacific and Latin America.

Wearable-Linked Personalized Hydration

Digital platforms now connect smartwatches and fitness trackers with beverage recommendation algorithms, validating hydration efficacy in real time. Gatorade's Gx Sweat Patchโ€”used by over 2 million consumers in 2024โ€”analyzes sodium loss and recommends customized electrolyte formulations [8]. This data feedback loop supports premium pricing and brand stickiness across the Sports Drink Market.

ย 

Restraints Impact Analysis

The restraint impact figures below are directional and illustrate estimated drag on the Sports Drink Market growth trajectory. Overlaps exist among restraints, and their combined effect is non-additive.

Restraint ~% Impact on CAGR Geographic Relevance Impact Timeline
Sugar-tax legislation โ€“0.6% Europe, Asia-Pacific Medium-term
Competition from functional water and coconut water โ€“0.5% North America, Europe Short-term
Raw material price volatility (citric acid, sweeteners) โ€“0.4% Global Short-term
Negative consumer perception of artificial ingredients โ€“0.3% North America Medium-term
Regulatory fragmentation on health claims โ€“0.3% Global Long-term

ย 

Sugar-Tax Legislation

The UK's Soft Drinks Industry Levy and similar taxes in Mexico, India, and Thailand directly raise shelf prices for formulations exceeding sugar thresholds. In Mexico, sugar-taxed beverages experienced a 12% volume decline in their first two years of taxation [10]. Brands in the Sports Drink Market must reformulate or absorb margin compression, slowing category penetration in price-sensitive emerging economies.

Competition from Adjacent Hydration Categories

Functional water, enhanced coconut water, and electrolyte-infused sparkling beverages collectively grew at 9.2% CAGR between 2021 and 2024, outpacing the Sports Drink Market baseline [14]. Brands like Vita Coco and Liquid I.V. (acquired by Unilever) have captured millennial and Gen-Z consumers who perceive traditional sports drinks as over-processed or excessively sweet.

Raw Material Price Volatility

Citric acid spot prices rose 18% between Q2 2023 and Q4 2024 due to supply disruptions in China's fermentation industry [15]. Sucralose and stevia extract costs have similarly fluctuated, squeezing margins for mid-tier Sports Drink Market brands that lack the procurement scale of PepsiCo or Coca-Cola.

ย 

Sports drink Market Opportunities

Emerging-Market Gym Culture Expansion

Asia-Pacific and Latin America are experiencing tremendous buildouts in exercise infrastructure, with gym counts in India rising 19% yearly since 2022 [7]. The Sports Drink Market can reach this underserved consumer segment through sachet format pricing and regional flavor localization.

ย 

Powder and Concentrate Format Innovation

Single-serve powder sticks and liquid concentrates remove the need for a cold chain, cut shipment weight by up to 90%, and are compatible with the economics of e-commerce logistics. This format is expected to grab over 15% volume share of the worldwide Sports Drink Market by 2030 [6].

ย 

Data-Driven Personalized Hydration Platforms

Wearable biosensor integration can enable brands to create subscription-based data-personalized hydration programs. Connected Sports Nutrition Platforms might create a high margin digital overlay over the physical Sports Drink Market, with a potential addressable market of up to USD 3.4 billion globally by 2032.

ย 

Clean-Label and Plant-Based Positioning

The willingness of consumers to pay a premium of 12-18% for certified organic, non-GMO and plant-sourced electrolyte solutions creates a separate tier in the Sports Drink Market [4]. Brands that carry third-party certifications (USDA Organic, EU Organic) gain shelf-space advantage in premium retail channels.

ย 

Strategic Private-Label Expansion

Large retailers including Costco, Aldi, and Tesco are expanding private-label sports drink SKUs priced 30โ€“40% below national brands. Contract manufacturers serving this channel will benefit from guaranteed volume offtake, adding incremental capacity to the Sports Drink Market supply base.

ย 

Sports drink Market Future Outlook

AI-Powered Personalized Formulation

Machine learning platforms will analyze individual biometric dataโ€”sweat composition, metabolic rate, exercise intensityโ€”to generate bespoke hydration prescriptions. By 2030, an estimated 12% of premium Sports Drink Market revenue could flow through algorithm-driven subscription services that match formulations to real-time physiological needs [8].

Sustainability and Circular Packaging

Consumer and regulatory pressure on single-use plastics will reshape packaging across the Sports Drink Market. The EU's Single-Use Plastics Directive mandates 30% recycled content in PET bottles by 2030, while brands like Gatorade are piloting aluminum-can formats and refillable pod systems to reduce packaging waste by up to 65% [17].

Functional Convergence with Nutraceuticals

The boundary between sports drinks and nutraceutical supplements is dissolving. Products layering electrolytes with nootropics, collagen peptides, and adaptogens will claim a growing share of the Sports Drink Market as consumers consolidate their wellness spending into fewer, multi-benefit SKUs [13].

Platform Economics and DTC Scale

Direct-to-consumer subscription models will capture an estimated 18โ€“22% of the Sports Drink Market by 2035, up from approximately 8% in 2025. Brands that own first-party consumer data will deploy predictive replenishment, dynamic pricing, and loyalty gamification to reduce churn below 15% monthly [5].

ย 

Sports drink Market Segmentation

By Soft Drink Type

Segment Key Metric Primary Demand Driver
Isotonic 56.2% share (2025) Broad applicability for moderate-intensity exercise
Hypertonic 7.12% CAGR (2026โ€“2035) Endurance and ultra-distance athletic demand
Hypotonic USD 3.82 Billion (2025) Rapid fluid absorption preference
Others 4.31% CAGR (2026โ€“2035) Hybrid and emerging formulations

ย 

Isotonic formulations remain the backbone of the Sports Drink Market, prized for matching the body's natural osmolality and enabling efficient fluid absorption during moderate exercise. Retail surveys indicate that 68% of casual fitness consumers default to isotonic options due to brand familiarity and widespread availability. Hypertonic products, while niche, are accelerating as marathon and triathlon participation rates rise globally, with ultra-endurance events growing 11% annually since 2021.

By Packaging Type

Segment Key Metric Primary Demand Driver
PET Bottles 60.3% share (2025) Lightweight, cost-effective, single-serve convenience
Glass Bottles USD 1.47 Billion (2025) Premium positioning, recyclability perception
Metal Cans 6.54% CAGR (2026โ€“2035) Sustainability branding, shelf differentiation
Others (Aseptic, Pouches) 7.22% CAGR (2026โ€“2035) E-commerce shipping optimization

ย 

PET bottles dominate the Sports Drink Market packaging landscape, balancing cost efficiency with consumer expectations for resealable, portable formats. Aseptic cartons and flexible pouches are gaining traction in online retail because they reduce dimensional weight and breakage rates during last-mile delivery, aligning with the channel's logistics economics [6].

By Distribution Channel

Segment Key Metric Primary Demand Driver
Supermarkets/Hypermarkets 61.2% share (2025) Shelf visibility, impulse purchasing
Convenience Stores USD 4.89 Billion (2025) On-the-go consumption occasions
Specialty Stores 5.12% CAGR (2026โ€“2035) Expert curation, premium assortments
Online Retail 7.22% CAGR (2026โ€“2035) Subscription economics, price transparency

ย 

Supermarkets and hypermarkets remain the primary purchase channel for the Sports Drink Market, leveraging endcap promotions and co-located snack adjacencies. Online retail's surge reflects pandemic-accelerated digital habits and subscription bundles that lock in repeat purchases at discounted unit economics [5].

By Functionality

Segment Key Metric Primary Demand Driver
Post-Workout 51.4% share (2025) Recovery-focused consumer behavior
Intra-Workout 7.04% CAGR (2026โ€“2035) Real-time hydration during training
Pre-Workout USD 3.21 Billion (2025) Energy priming, caffeine-enhanced formulas
Others 4.52% CAGR (2026โ€“2035) All-day hydration positioning

ย 

Post-workout recovery drinks command the largest share of the Sports Drink Market by functionality, reflecting ingrained consumer habits around gym-exit hydration. Intra-workout products are the fastest-growing segment, driven by endurance training trends and clinical research demonstrating that mid-exercise electrolyte intake reduces fatigue onset by up to 23% [13].

ย 

Regional Market Share Analysis

Region Key Metric Primary Investment Themes
North America 40.3% share (2025) Brand premiumization, DTC channels
Europe 24.8% share (2025) Sugar-tax reformulation, organic positioning
Asia-Pacific 6.70% CAGR (2026โ€“2035) Gym infrastructure, urbanization
South America USD 2.09 Billion (2025) Retail modernization, sachet pricing
Middle East & Africa 5.71% CAGR (2026โ€“2035) Fitness mandates, youth demographics
Total USD 29.42 Billion (2025) โ€”

The Sports Drink Market exhibits a tiered regional structure. North America and Europe together account for approximately two-thirds of global revenue, while Asia-Pacific's rapid growth trajectory positions it as the long-term volume leader.

ย 

North America

Country Key Metric Key Driver
US 78.4% of regional share Gatorade/Powerade duopoly, convenience-store saturation
Canada 12.6% of regional share Health Canada clean-label guidelines
Mexico 5.87% CAGR Youth population growth, soccer culture

ย 

The U.S. remains the single largest country market within the Sports Drink Market, anchored by decades of brand equity from PepsiCo's Gatorade and Coca-Cola's Powerade franchises. Canada's regulatory push toward reduced-sodium formulations is reshaping product portfolios, while Mexico's sugar-tax environment forces brands to innovate around natural sweetener alternatives [10].

Europe

Country Key Metric Key Driver
Germany USD 1.71 Billion (2025) Bundesliga sports sponsorship ecosystem
UK 5.92% CAGR Soft Drinks Industry Levy driving reformulation
France USD 1.08 Billion (2025) Rugby and cycling participation rates
Italy 4.89% CAGR Mediterranean wellness culture
Spain USD 0.62 Billion (2025) Tourism-driven seasonal demand
Nordic Countries 5.34% CAGR Outdoor fitness culture
Russia USD 0.41 Billion (2025) Domestic brand development
Rest of Europe 4.71% CAGR Eastern European gym expansion

ย 

Europe's Sports Drink Market is shaped by the EU's Farm to Fork Strategy, which pressures manufacturers to reduce sugar content below 5 g per 100 ml. The UK's levy has already triggered a 46% reduction in sugar content across the sports drink category since 2018, establishing a reformulation template now adopted by Germany and France [10].

Asia-Pacific

Country Key Metric Key Driver
China 34.2% of regional share Fitness app integration, urban gym chains
India 7.84% CAGR Cricket and kabaddi sponsorship deals
Japan USD 1.52 Billion (2025) Pocari Sweat brand dominance, aging-population hydration
South Korea 6.41% CAGR K-wellness trend, esports hydration partnerships
ASEAN USD 0.98 Billion (2025) Tropical climate baseline demand
Rest of Asia-Pacific 6.12% CAGR Infrastructure-led consumption growth

ย 

Asia-Pacific represents the fastest-growing corridor for the Sports Drink Market. China's sports industry plan targets USD 780 billion in total sports economy output by 2030, directly stimulating downstream beverage consumption [7]. India's IPL cricket league sponsorship deals with hydration brands exceeded USD 120 million in 2024, embedding sports drinks into mainstream media visibility.

South America

Country Key Metric Key Driver
Brazil 62.8% of regional share Football culture, Carnival fitness trends
Argentina 5.23% CAGR Mate-infused sports drink innovation
Rest of South America USD 0.39 Billion (2025) Modern trade retail expansion

ย 

Brazil dominates the South American Sports Drink Market, with PepsiCo's Gatorade holding a commanding retail presence. Argentina's economic volatility has constrained premium-tier penetration, though locally manufactured isotonic brands are gaining ground through aggressive value pricing and regional flavor profiles.

Middle East & Africa

Country Key Metric Key Driver
Saudi Arabia 31.4% of regional share Vision 2030 sports infrastructure investment
UAE 5.96% CAGR Expo-legacy fitness facilities, extreme-heat demand
South Africa USD 0.22 Billion (2025) Rugby and marathon participation
Egypt 6.28% CAGR Youth demographic bulge
Rest of MEA USD 0.34 Billion (2025) Urbanization-driven retail access

ย 

Saudi Arabia's Vision 2030 has allocated over USD 7.2 billion to sports infrastructure, directly expanding retail and vending touchpoints for the Sports Drink Market across the kingdom [12]. The UAE's post-Expo 2020 fitness corridor and extreme summer temperatures create year-round baseline hydration demand that sustains premium price points.

ย 

Sports drink Market By Region, 2025-2035

Competitive Benchmarking

The Sports Drink Market exhibits moderate concentration, with the top five players collectively holding an estimated 58โ€“64% revenue share. PepsiCo and Coca-Cola constitute a near-duopoly in North America, while regional champions in Asia-Pacific and Europe fragment the competitive field. The Herfindahl-Hirschman Index sits in the moderate range (~1,400โ€“1,700), reflecting meaningful but non-monopolistic consolidation.

Company Est. Revenue Share Range Key Offerings Strategic Positioning
PepsiCo Inc. ~22โ€“26% Gatorade, Gatorade Zero, Gx Mass-market leader, science-backed branding
The Coca-Cola Company ~15โ€“19% Powerade, BodyArmor Portfolio diversification, athlete endorsements
Abbott Laboratories ~4โ€“6% Pedialyte Sport Medical-grade hydration crossover
Otsuka Pharmaceutical Co., Ltd. ~4โ€“6% Pocari Sweat Asia-Pacific dominance, isotonic heritage
Monster Beverage Corporation ~3โ€“5% Monster Hydro Energy-sport hybrid positioning
Suntory Beverage & Food Limited ~3โ€“5% Lucozade Sport European sports sponsorship network
Danone S.A. ~2โ€“4% Mizone China and Southeast Asia penetration
Red Bull GmbH ~2โ€“3% Red Bull Hydration Brand extension from energy into hydration
Britvic PLC ~1โ€“3% Robinsons Refresh'd UK grocery channel strength
The Kraft Heinz Company ~1โ€“2% MiO Sport Liquid concentrate innovation

ย 

ย 

Recent News & Developments

  • PepsiCo India (In June 2024) launched its popular hydration drink Gatorade in Jammu and Kashmir, India, expanding its beverage portfolio in the region. The strategy was to provide the regionโ€™s consumers with access to a trusted and effective sports drink.

ย 

ย 

ย 

ย 

ย 

ย 

ย 

ย 

ย 

Sports drink Market Report Scope

Parameter Detail
Market Scope Global Sports Drink Market โ€” production, distribution, and consumption of sports and performance hydration beverages
Study Period 2021โ€“2035
CAGR (Forecast) 5.54% (2026โ€“2035)
Base Year Market Size USD 29.42 Billion (2025)
Forecast Endpoint USD 50.46 Billion (2035)
Fastest Growing Segment Hypertonic beverages (by type); Online retail (by channel); Asia-Pacific (by region)
Companies Profiled 10 (PepsiCo, Coca-Cola, Abbott, Otsuka, Monster Beverage, Suntory, Danone, Red Bull, Britvic, Kraft Heinz)
Valuation Currency USD Billion
CAGR Driver Disclaimer Impact percentages in Sections 4โ€“5 are directional and non-additive to the headline CAGR

ย 

ย 

FAQs

How do sports drink brands protect margins amid sugar-tax pressures?
Leading manufacturers reformulate below tax thresholds using stevia or monk-fruit blends, absorbing a 3โ€“5% ingredient cost increase while avoiding the 8โ€“12% levy surcharge. This strategy preserves retail price parity [10].
What shelf-life considerations affect sports drink procurement for institutional buyers?
PET-bottled isotonic products typically offer 9โ€“12 months of shelf life under ambient storage. Aseptic packaging extends this to 15โ€“18 months, making it preferable for military and disaster-relief procurement [6].
How are private-label sports drinks reshaping retail negotiation dynamics?
Retailers use private-label SKUs priced 30โ€“40% below national brands as negotiation leverage for shelf-space fees. Branded manufacturers counter with exclusive flavor launches and co-marketing spend commitments [14].
What role do clinical trials play in Sports Drink Market product differentiation?
Brands funding peer-reviewed efficacy studies gain regulatory latitude for on-pack health claims. Products backed by published clinical data command 15โ€“20% price premiums over unsubstantiated competitors [13].
How does altitude or extreme-climate training influence Sports Drink Market product design?
High-altitude and extreme-heat formulations require elevated sodium concentrations (800โ€“1,200 mg/L versus 400โ€“600 mg/L standard). This niche commands premium pricing among endurance athletes [13].
What intellectual property barriers exist for new entrants in the Sports Drink Market?
PepsiCo and Coca-Cola collectively hold over 1,200 active patents covering electrolyte delivery systems and flavor-masking technologies. New entrants typically license or design around these portfolios [2].
How do sports drink brands approach sponsorship ROI measurement?
Brands track sponsorship ROI through attributed sales lift, social media engagement velocity, and retail velocity during event windows. FIFA-tier partnerships typically deliver 4โ€“6ร— media-value return [19]. ย  ย 
Author
Author
Author Profile
Sakshi Gupta LinkedIn
Team Lead - Research
Currently a Team Lead in consumer goods, FMCG, and F&B, she translates rigorous research into decisive strategy. She develops GTM roadmaps, pricing architectures, and competitive benchmarks for companies across Europe, the US, and APAC. She synthesize insights, align cross-functional teams, and drive execution from brief to measurable outcomes. She leads end-to-end engagements with crisp analysis, compelling storytelling, and a strong command of Power BI, Tableau, SQL, and advanced research platforms.

Research Approach

Secondary Research

The secondary research process involved comprehensive analysis of regulatory databases, peer-reviewed nutrition journals, beverage industry publications, and authoritative health organizations. Key sources included the US Food & Drug Administration (FDA), European Food Safety Authority (EFSA), US Department of Agriculture (USDA), International Council of Beverages Associations (ICBA), Beverage Marketing Corporation, World Health Organization (WHO) Global Nutrition Monitoring Framework, Centers for Disease Control and Prevention (CDC) National Center for Health Statistics, National Institutes of Health (NIH) Office of Dietary Supplements, Euromonitor International, OECD-FAO Agricultural Outlook, national statistics offices from key markets (e.g., US Bureau of Labor Statistics, Eurostat, China National Bureau of Statistics), and trade publications from the International Sports and Energy Drinks Association (ISEDA). These sources were utilized to collect consumption statistics, formulation trends, regulatory compliance data, sugar taxation policies, sports participation demographics, and competitive landscape analysis for isotonic, hypotonic, and hypertonic formulations across electrolyte, carbohydrate, and vitamin-based segments.

ย 

Primary Research

To gather both qualitative and quantitative information, the primary research process involved interviewing players from both the supply and demand sides. CEOs, CMOs, VPs of product innovation, directors of research and development, and managers of regulatory affairs from beverage producers, co-packers, and ingredient suppliers around the world were among the supply-side sources. Sports nutritionists, head coaches, athletic trainers, purchasing agents from grocery stores and convenience stores, category managers from mass merchandisers, and directors of foodservice operations from gyms and sports complexes made up the demand side. Timeliness of product pipeline launches, flavor and electrolyte segmentation, sugar-reduction formulation tactics, pricing elasticity, distribution channel dynamics, and patterns of uptake by athletes vs. casual consumers were all confirmed through primary research.

Primary Respondent Breakdown:

By Designation: C-level Primaries (32%), Director Level (30%), Others (38%)

By Region: North America (32%), Europe (30%), Asia-Pacific (28%), Rest of World (10%)

ย 

Market Size Estimation

Global market valuation was derived through revenue mapping and consumption volume analysis. The methodology included:

Identification of 50+ key manufacturers across North America, Europe, Asia-Pacific, Latin America, and Middle East & Africa

Product mapping across isotonic, hypotonic, and hypertonic formulations, segmented by electrolyte, carbohydrate, vitamin, and natural flavor ingredient categories

Analysis of reported and modeled annual revenues specific to sports drink portfolios, including volume sales through on-premise (gyms, stadiums) and off-premise (retail, e-commerce) channels

Coverage of manufacturers representing 72-77% of global market share in 2024

Extrapolation using bottom-up (consumption volume ร— average selling price by country/region) and top-down (manufacturer revenue validation) approaches to derive segment-specific valuations for athlete, casual consumer, and lifestyle user end-market segments

Download Free Sample

Kindly complete the form below to receive a free sample of this Report

Download PDF ×

We do not share your information with anyone. However, we may send you emails based on your report interest from time to time. You may contact us at any time to opt-out.