Electronic Components Market

Key Players: Samsung Electronics, Intel Corporation, Texas Instruments, Murata Manufacturing, Infineon Technologies, STMicroelectronics, TDK Corporation, ON Semiconductor

Electronic Components Market

Electronic Components Market Size, Share and Research Report By Challenges (Supply-Chain Concentration & Geopolitical Disruption, Cyclical Inventory Corrections, Raw-Material Price Volatility) and By Regional (North America, Europe, South America, Asia Pacific, Middle East and Africa) - Industry Forecast to 2035.
ID: MRFR/SEM/40680-CR
470 Pages
Nirmit Biswas, Shubham Munde
Last Updated: June 17, 2026
 

Electronic Components Market Summary

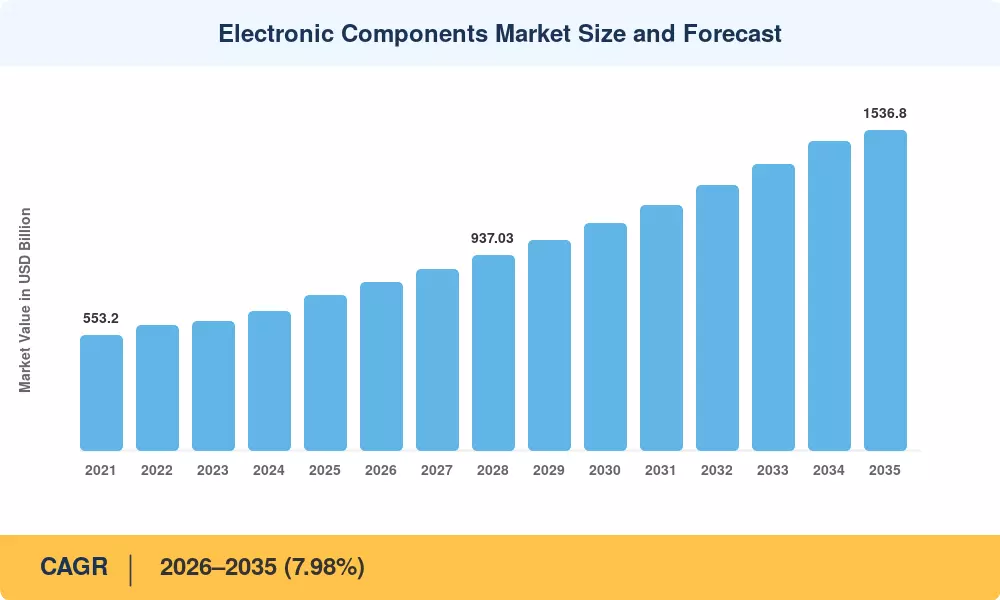
The electronic components market reached an estimated USD 745.06 billion in 2025 and is projected to climb from USD 804.53 billion in 2026 to approximately USD 1,536.80 billion by 2035, registering a CAGR of 7.98% across the forecast window. Two policy catalysts anchor this trajectory: the USD 52.7 billion U.S. CHIPS and Science Act, which has already triggered over USD 200 billion in private fab commitments on American soil, and the EUR 43 billion EU Chips Act redirecting semiconductor capacity toward European sovereignty [1][2]. Together, these programs are reshaping where discrete electronic devices and passive electronic parts are manufactured and consumed.

A sweeping technology transition is underway across the electronic components market. Legacy through-hole assemblies are yielding ground to advanced surface-mount configurations, while silicon-based power switches are being displaced by wide-bandgap gallium-nitride and silicon-carbide alternatives capable of handling higher voltages and frequencies. Global fab equipment spending on 300 mm production lines alone is forecast to exceed USD 420 billion between 2025 and 2027, underscoring the capital intensity required to keep PCB component supply aligned with surging AI-server and electric-vehicle demand [2][3].

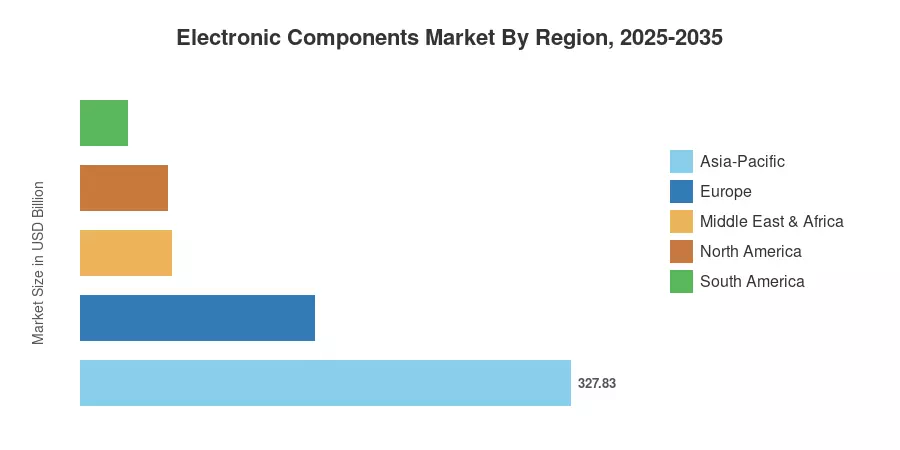
Asia-Pacific remains the dominant geography in the electronic components market, commanding roughly 44% of 2024 revenue, followed by North America at approximately 24%. The Middle East & Africa region, though comparatively small, is the fastest-growing at an 8.15% CAGR through 2035, driven by smart-city buildouts in Saudi Arabia and the UAE. As capacity diversification accelerates across India, Europe, and the Americas, the next decade will reward suppliers who balance geographic resilience with technology leadership in resistor capacitor components and compound semiconductor devices [4][5].


Key Report Takeaways

• By Component

  • Active components held the lion's share of the electronic components market in 2024, accounting for roughly 86% of total revenue — a dominance driven by semiconductor IC demand across AI accelerators and automotive ECUs
  • Passive electronic parts, including resistors, capacitor components, and ceramic dielectrics, are projected to expand at a 9.05% CAGR through 2035 as electric-vehicle power trains and 5G base stations raise content-per-board requirements

• By Mounting Technology

  • Surface-mount devices captured approximately 75% of the electronic components market revenue in 2024, reflecting their advantages in automated high-volume PCB assembly
  • Through-hole devices continue to serve niche military and industrial applications where the mechanical strength of electronic circuit elements outweighs density concerns

• By Region

  • Asia-Pacific represented the largest share of the electronic components market in 2024, anchored by China, Japan, and South Korea's combined fab output
  • The Middle East & Africa region is advancing at an 8.15% CAGR, the fastest among all geographies, fueled by government-led digital-infrastructure programs


Electronic Components Market Size and Forecast (2021–2035)

MRFR's market sizing draws on a bottom-up approach combining company revenue disclosures, fab utilization trackers from SEMI and WSTS, and end-market demand models validated against customs and trade data. Historical figures (2021–2024) rely on audited financials and association statistics; the base-year 2025 estimate is triangulated from preliminary shipment data, while the 2026–2035 forecast applies the calibrated 7.98% CAGR with adjustments for cyclical inventory corrections.

Electronic Components Market Size and Forecast
Our Impact
Enabled $4.3B Revenue Impact for Fortune 500 and Leading Multinationals
Partnering with 2000+ Global Organizations Each Year
30K+ Citations by Top-Tier Firms in the Industry
 

Driver Impact Analysis

Driver ~% Impact on CAGR Geographic Relevance Impact Timeline
AI-accelerator & data-center buildout ~1.8% North America, Asia-Pacific Short-term (≤2 yr)
Vehicle electrification & ADAS content growth ~1.5% Global Medium-term (2–4 yr)
Government semiconductor subsidies (CHIPS Act, EU Chips Act) ~1.2% North America, Europe Medium-term (2–4 yr)
5G/6G RF front-end expansion ~0.9% Asia-Pacific, Europe Long-term (≥4 yr)
Industrial IoT & factory digitalization ~0.8% Europe, Asia-Pacific Medium-term (2–4 yr)
Renewable-energy power electronics ~0.7% Global Long-term (≥4 yr)
Component miniaturization & advanced packaging ~0.5% Asia-Pacific Long-term (≥4 yr)


AI-Accelerator and Data-Center Buildout

Hyperscale cloud operators committed over USD 180 billion in capital expenditure during 2024 alone, with a significant share directed at GPU clusters and custom AI ASICs that consume thousands of discrete electronic devices per server rack [7]. Each AI training node can carry 30,000+ electronic circuit elements — from voltage regulators and multilayer ceramic capacitors to high-speed SerDes ICs — pushing the electronic components market into an unprecedented demand cycle. Microsoft, Google, and Amazon have collectively announced data-center expansions across 15 countries, intensifying PCB component supply requirements for power-delivery networks that must handle 1,500 W per accelerator card [7][3].

Vehicle Electrification and ADAS Content Growth

Around three times as many electronic components are found in battery-electric vehicles (about USD 3,500) as in traditional internal-combustion automobiles (around USD 1,200) [8]. The fastest-growing subsegments of resistor-capacitor components in the automotive tier are SiC and GaN power modules for traction inverters, as well as radar and lidar sensor integrated circuits. OEMs will be required by the European Commission's Euro 7 emission rules, which go into effect in 2025, to include even more electronic circuit components for real-time diagnostics, increasing the amount of semiconductors per car [8][5].


Government Semiconductor Subsidies

The U.S. CHIPS Act has already disbursed preliminary awards totaling USD 30 billion to Intel, TSMC, Samsung, and Micron for domestic fab construction, while the EU Chips Act has earmarked EUR 43 billion to double Europe's global chip-production share to 20% by 2030 [1][2]. India's Semiconductor Mission offers a 50% fiscal subsidy on capital expenditure, attracting Tata Electronics and CG Power into the passive electronic parts manufacturing ecosystem. These programs collectively de-risk supply-chain concentration, boosting long-term investment confidence in the electronic components market.

5G/6G RF Front-End Expansion

By mid-2025, there were more than 2.2 billion 5G subscriptions worldwide, and each 5G phone needs around double the RF filter and amplifier content of a 4G device [9]. Demand for high-frequency passive electronic components, such as BAW filters, low-noise amplifiers, and GaN-on-SiC power amplifiers, will propel incremental growth throughout the forecast period as operators upgrade to 5G-Advanced and start working on 6G standards.


Restraints Impact Analysis

As with drivers, the restraint impacts below are directional estimates. They quantify headwinds that partially offset growth but are not mechanically subtracted from the CAGR.

Restraint ~% Impact on CAGR Geographic Relevance Impact Timeline
Supply-chain concentration & geopolitical disruption –0.9% Global Short-term (≤2 yr)
Cyclical inventory corrections –0.7% Asia-Pacific, North America Short-term (≤2 yr)
Raw-material price volatility (rare earths, palladium) –0.5% Global Medium-term (2–4 yr)
Skilled-workforce shortages in fab operations –0.4% North America, Europe Long-term (≥4 yr)
Counterfeit-component risk in secondary channels –0.3% Global Medium-term (2–4 yr)


Supply-Chain Concentration and Geopolitical Disruption

Taiwan accounts for over 60% of global advanced-node wafer production, and any escalation in cross-strait tensions could instantly constrain the availability of leading-edge discrete electronic devices worldwide [13]. Export controls on chipmaking equipment to China, tightened by the U.S., Japan, and the Netherlands in 2024, have already bifurcated the electronic components market into separate technology ecosystems, complicating procurement for multinationals that serve both Chinese and Western OEMs.

Cyclical Inventory Corrections

The 2023 memory downturn erased roughly USD 45 billion from global DRAM and NAND revenue in a single year, illustrating how quickly the electronic components market can swing from shortage to oversupply [6]. Distributors reduced channel inventory by an estimated 12 weeks of stock during the correction, depressing orders for resistor capacitor components and standard-logic ICs well into early 2024. While AI-driven demand shortened this particular cycle, future corrections remain a structural risk.

Raw-Material Price Volatility

Palladium, used in multilayer ceramic capacitors, saw prices fluctuate by more than 40% between 2022 and 2024, directly impacting bill-of-material costs for passive electronic parts [14]. Nickel and rare-earth elements used in magnetics and specialty alloys face similar volatility, adding margin pressure throughout the PCB component supply chain.


Electronic Components Market Opportunities

Wide-Bandgap Semiconductor Commercialization

Gallium-nitride and silicon-carbide devices are moving from specialized uses to widespread use in data-center power supplies, industrial motor drives, and electric vehicle traction. By 2030, the SiC power-device segment alone is predicted to surpass USD 12 billion, generating additional income streams for the electronic components business that are significantly higher than previous silicon-transistor trajectories [11]


Automotive Semiconductor Localization in India

Suppliers of discrete electronic devices and resistor-capacitor components have a greenfield chance to start local manufacturing thanks to India's USD 10 billion Semiconductor Mission and a fast-growing domestic car sector that produces 5 million automobiles annually The collaboration between Tata Electronics and PSMC for a 28 nm fabrication plant in Gujarat indicates that the supply base for PCB components is broadening more quickly than many observers had anticipated.


Edge-AI and IoT Sensor Proliferation

The installed base of IoT-connected devices is forecast to reach 30 billion units by 2030, each requiring microcontrollers, MEMS sensors, and passive electronic parts that expand the addressable electronic components market beyond traditional computing end-uses Edge-AI inference chips that process data locally will amplify content-per-device, generating recurring demand for electronic circuit elements optimized for ultra-low power consumption.

Data-Monetization and Digital-Twin Platforms

Component manufacturers are layering software-as-a-service models on top of physical products — offering predictive-maintenance analytics, digital-twin simulation, and lifecycle-management dashboards to OEM customers. These platforms unlock recurring revenue streams and deepen customer lock-in across the electronic components market

Circular-Economy and Sustainable-Component Design

EU regulations on eco-design and critical raw material recovery are compelling manufacturers to rethink end-of-life strategies for electronic circuit elements. Companies investing in lead-free solder, halogen-free substrates, and precious-metal reclamation can capture ESG-conscious procurement budgets, a growing share of total PCB component supply spending


Electronic Components Market Future Outlook

AI-Hardware Supercycle and Autonomous Systems

AI training and inference workloads are expected to consume over 5% of global electricity by 2030, and every watt flows through electronic circuit elements — voltage regulators, capacitor arrays, and power-management ICs [7]. As autonomous vehicles, robotic surgery platforms, and smart-factory controllers move from pilot to production, the electronic components market will ride a multi-year hardware supercycle unlike any since the smartphone era.

Platform Economics and Component-as-a-Service

Leading distributors like Arrow Electronics and Avnet are evolving into platform businesses, offering design tools, demand-forecasting algorithms, and component-lifecycle management alongside physical PCB component supply [17]. This shift toward recurring-revenue models will reshape competitive dynamics in the electronic components market, rewarding companies that combine the distribution of discrete electronic devices with digital services.

Electrification and Decarbonization Wave

The IEA projects global EV sales will exceed 40 million units annually by 2030, each requiring thousands of resistor-capacitor components and wide-bandgap power modules [11]. Simultaneously, renewable-energy inverters, grid-scale battery systems, and smart-grid controllers are expanding the addressable electronic components market for passive electronic parts and power-semiconductor devices well beyond traditional computing and telecom.

ESG, Conflict-Mineral Compliance, and Green Manufacturing

The EU's Corporate Sustainability Reporting Directive (CSRD) and U.S. SEC climate-disclosure rules are pushing electronic components market participants to trace supply chains from mine to module [18]. Manufacturers investing in conflict-free sourcing, energy-efficient fabs, and halogen-free electronic circuit elements formulations will capture procurement-preference advantages from OEMs under mounting ESG scrutiny.


Electronic Components Market Segmentation

By Component

Segment Key Metric Primary Demand Driver
Active Components ~86% of 2024 revenue Semiconductor ICs for AI, auto, 5G
Passive Components 9.05% CAGR (2026–2035) Rising content per PCB, EV power trains


Active components — spanning microprocessors, memory ICs, power semiconductors, and optoelectronics — dominate the electronic components market by revenue because semiconductor ICs sit at the core of every digital system. AI-accelerator demand from hyperscale operators has driven average selling prices upward, particularly for HBM DRAM and GPU packages containing thousands of discrete electronic devices per unit [7][12].

Passive electronic parts, including resistors, capacitors, inductors, and ceramic dielectrics, are the fastest-growing segment within the electronic components market. Each EV power train demands roughly four times the MLCC content of a combustion drivetrain, while 5G macro base stations require high-Q inductors and low-ESR capacitors that command premium pricing [8][9].

By Mounting Technology

Segment Key Metric Primary Demand Driver
Surface-Mount Devices ~75% of 2024 revenue High-volume automated PCB assembly
Through-Hole Devices USD 186.26 Billion (2025) Military/industrial ruggedized assemblies


Surface-mount technology continues to gain share in the electronic components market as component miniaturization pushes package sizes below 0201 metric dimensions. Through-hole electronic circuit elements retain relevance in aerospace and defense applications where vibration resistance and field-repairability justify the larger footprint [12].

By Material System

Segment Key Metric Primary Demand Driver
Silicon & Silicon-Germanium ~61% of 2024 revenue Mainstream logic, memory, and analog ICs
Compound Semiconductors 8.60% CAGR (2026–2035) GaN/SiC power, RF, photonics
Ceramic Dielectrics USD 48.50 Billion (2025) MLCCs, piezoelectric sensors
Other Materials ~5% of 2024 revenue Ferrites, polymer substrates, specialty alloys


Silicon and silicon-germanium underpin the vast majority of the electronic components market, from advanced 3 nm logic to mature 180 nm analog nodes. Compound semiconductors are the standout growth category: SiC devices for EV traction inverters and GaN amplifiers for 5G infrastructure are pulling investment into new epitaxial-wafer and discrete electronic devices fab capacity worldwide [11][12].

By End-User Industry

Segment Key Metric Primary Demand Driver
Consumer Electronics & Computing ~31% of 2024 revenue Smartphones, PCs, and AI servers
Automotive 8.85% CAGR (2026–2035) EV power trains, ADAS, in-vehicle networking
Industrial & Others USD 143.30 Billion (2025) Factory automation, medical devices, and defense


Consumer electronics and computing absorb the largest volume of resistors, capacitor components, and ICs in the electronic components market, though growth is moderating as smartphone penetration matures. Automotive is the fastest-expanding end-user segment, driven by rising electronic circuit elements content per vehicle and the transition from 12 V to 48 V and 800 V architectures [8].


Regional Market Share Analysis

Region Key Metric Primary Investment Themes
Asia-Pacific ~44% of 2024 revenue Fab expansion, 5G rollout, EV battery ecosystem
North America 7.85% CAGR (2026–2035) CHIPS Act reshoring, AI data-center buildout
Europe USD 156.50 Billion (2025) EU Chips Act, automotive semiconductor sovereignty
South America ~4.2% of 2024 revenue Industrial automation, telecom modernization
Middle East & Africa 8.15% CAGR (2026–2035) Smart-city programs, defense electronics
Total USD 745.06 Billion (2025)

The electronic components market exhibits pronounced regional asymmetry, with Asia-Pacific commanding the largest share owing to decades of fab investment, while emerging regions like the Middle East & Africa and South America are accelerating from smaller bases as digital infrastructure programs mature.


North America

Country Key Metric Key Driver
US ~78% of regional revenue CHIPS Act fab investments, hyperscale data centers
Canada 6.90% CAGR Automotive EV supply chain, mining-sector IoT
Mexico USD 8.10 Billion (2025) Nearshoring, maquiladora electronics assembly


The U.S. dominates North America's electronic components market, absorbing the bulk of CHIPS Act incentives while housing the world's largest cloud-computing footprint. Intel's USD 20 billion Ohio fab complex and TSMC's Arizona campus are anchoring a discrete electronic devices manufacturing renaissance that will ripple through PCB component supply chains for the next decade [1][2].

Europe

Country Key Metric Key Driver
Germany ~26% of regional revenue Automotive semiconductor demand, Infineon/Bosch fabs
UK 7.40% CAGR Compound semiconductor R&D, defense electronics
France USD 18.20 Billion (2025) STMicroelectronics SiC expansion, aerospace
Italy ~8% of regional revenue Industrial automation, white-goods electronics
Spain 7.10% CAGR Renewable-energy power electronics
Nordic Countries USD 9.80 Billion (2025) 5G densification, Ericsson supply chain
Russia ~4% of regional revenue Import substitution, domestic fab pilots
Rest of Europe 6.80% CAGR Emerging EMS clusters in Poland and the Czech Republic


Germany's automotive OEMs — Volkswagen, BMW, Mercedes — are vertically integrating electronic circuit elements to secure resistor capacitor components supply after the 2021–2022 chip crisis. The EU Chips Act is channeling EUR 43 billion toward building 2 nm capacity and strengthening the passive electronic parts supply base across the continent [2][5].

Asia-Pacific

Country Key Metric Key Driver
China ~38% of regional revenue Government self-sufficiency push, mature-node expansion
India 9.20% CAGR Semiconductor Mission, consumer-electronics growth
Japan USD 62.40 Billion (2025) Advanced materials, equipment, auto-grade ICs
South Korea ~18% of regional revenue Memory leadership (Samsung, SK Hynix)
ASEAN 8.50% CAGR Back-end packaging, EMS nearshoring
Rest of Asia-Pacific USD 21.30 Billion (2025) Taiwan OSAT, Australia defense electronics


Asia-Pacific's dominance in the electronic components market reflects entrenched ecosystem advantages: TSMC and Samsung's foundry duopoly, Japan's monopoly on critical photoresist and electronic circuit elements materials, and China's aggressive fab buildout targeting 28 nm and above nodes. India is the region's breakout story, leveraging its Semiconductor Mission to attract discrete electronic devices manufacturing at an unprecedented pace [4][12].

South America

Country Key Metric Key Driver
Brazil ~62% of regional revenue Manaus Free Trade Zone, consumer electronics assembly
Argentina 6.50% CAGR Lithium-ion battery materials, telecom
Rest of South America USD 4.60 Billion (2025) Mining automation, agricultural IoT


Brazil's Manaus Free Trade Zone remains the primary destination for PCB component supply assembly in South America, supported by tax incentives that attract Samsung, LG, and local EMS providers. The electronic components market in the region is modest but growing as agricultural IoT and mining digitalization create new demand vectors for passive electronic parts [5].

Middle East & Africa

Country Key Metric Key Driver
Saudi Arabia ~30% of regional revenue Vision 2030 smart-city programs
UAE 8.30% CAGR Dubai Silicon Oasis, defense modernization
South Africa USD 2.90 Billion (2025) Telecom infrastructure, renewable energy
Egypt 7.80% CAGR Electronics manufacturing pilots, population-driven demand
Rest of MEA ~22% of regional revenue Africa-wide 4G/5G rollout


The Middle East & Africa is the fastest-growing region in the electronic components market, propelled by Saudi Arabia's NEOM and the UAE's Dubai Silicon Oasis, which are building out semiconductor-adjacent ecosystems for discrete electronic devices design and advanced packaging [5][4].


Electronic Components Market By Region, 2025-2035
 

Competitive Benchmarking

The electronic components market exhibits low concentration, with no single company exceeding a 10% global revenue share. The top five players collectively account for an estimated 28–34% of total sales, reflecting a fragmented landscape where scale advantages in wafer fabrication coexist with niche leadership in passive electronic parts and specialty discrete electronic devices. Strategic M&A, vertical integration into advanced packaging, and geographic diversification through CHIPS-Act-funded fabs are the dominant competitive themes.

Company Est. Revenue Share Range Key Offerings Strategic Positioning
Samsung Electronics ~6–9% Memory ICs, foundry, MLCC, display drivers Vertically integrated IDM with leading DRAM/NAND share
Intel Corporation ~5–8% Microprocessors, FPGA, and foundry services Reshoring-focused IDM; major CHIPS Act beneficiary
Texas Instruments ~4–6% Analog ICs, embedded processors High-margin analog leader with 300 mm capacity expansion
Murata Manufacturing ~3–5% MLCCs, RF modules, sensors Dominant in passive electronic parts for mobile and auto
Infineon Technologies ~3–5% Power semiconductors, MCUs, sensors Automotive and industrial power-device specialist
STMicroelectronics ~2–4% SiC power devices, MCUs, MEMS sensors European auto-grade leader, SiC capacity buildout
TDK Corporation ~2–4% Capacitors, inductors, magnetics Broad passive-component portfolio for PCB component supply
ON Semiconductor ~2–3% SiC MOSFETs, image sensors, power ICs Aggressive SiC pivot targeting EV and industrial
Vishay Intertechnology ~1–3% Resistors, capacitors, diodes, MOSFETs Full-line discrete electronic devices and passive parts
Kyocera Corporation ~1–2% Ceramic packages, capacitors, and connectors Specialty ceramic dielectric and electronic circuit elements


Recent News & Developments

  • Intel (January 2025): Received a USD 7.86 billion preliminary CHIPS Act award for its Ohio, Arizona, Oregon, and New Mexico fab projects, the largest single allocation under the program [1].
  • Samsung Electronics (November 2024): Commenced construction of a USD 17 billion advanced-packaging facility in Taylor, Texas, aiming to produce 2 nm chips by 2026 and bolster PCB component supply in North America [2].
  • TSMC (September 2024): Announced a third Arizona fab targeting 2 nm production, bringing total U.S. investment to over USD 65 billion and expanding discrete electronic devices capacity for AI and automotive customers [2].
  • Infineon Technologies (July 2024): Opened a EUR 5 billion SiC power-semiconductor fab in Kulim, Malaysia, doubling its wide-bandgap production capacity for EV traction applications [20].
  • Murata Manufacturing (March 2024): Invested JPY 120 billion in a new MLCC production line in Fukui, Japan, to meet surging demand for resistor capacitor components from automotive and AI-server OEMs [19].
  • Indian Semiconductor Mission (June 2024): Approved Tata Electronics' USD 11 billion proposal for a 28 nm fab in Dholera, Gujarat, marking India's first major wafer-fabrication commitment [4].
  • EU Chips Act (February 2024): The European Commission approved a EUR 1.4 billion public-funding package for STMicroelectronics and GlobalFoundries' joint FD-SOI fab in Crolles, France [2].


Electronic Components Market Report Scope

Parameter Details
Market Scope Global electronic components market covering active and passive electronic parts, by component, mounting technology, material system, end-user industry, and geography
Study Period 2021–2035
CAGR Window 2026–2035 (7.98%)
Base Year 2025 (USD 745.06 Billion)
Forecast Endpoint 2035 (USD 1,536.80 Billion)
Fastest Growing Segments Passive components (by component); Compound semiconductors (by material); Automotive (by end user); Middle East & Africa (by region)
Companies Profiled Samsung Electronics, Intel, Texas Instruments, Murata Manufacturing, Infineon Technologies, STMicroelectronics, TDK Corporation, ON Semiconductor, Vishay Intertechnology, Kyocera Corporation
Valuation Currency USD Billion


FAQs

How does component lead-time volatility affect procurement strategies in the electronic components market?

Lead-time swings — from 8 weeks in surplus periods to 52+ weeks during shortages — force buyers to blend just-in-time ordering with strategic buffer stock. Multi-sourcing across at least two qualified suppliers per part number is now standard practice among Tier-1 automotive and industrial OEMs [6].

What role do authorized distributors play versus the open market for resistor capacitor components?

Authorized distributors guarantee traceability and warranty coverage, reducing counterfeit risk that costs the industry an estimated USD 7.5 billion annually. Open-market sourcing remains a last resort for end-of-life parts where authorized channels have exhausted allocation [16].

How are wide-bandgap devices reshaping power-electronics design choices?

SiC and GaN switches operate at higher frequencies and temperatures than silicon IGBTs, enabling 30–50% smaller passive electronic parts in filter stages. Designers increasingly specify wide-bandgap solutions for EV inverters and server power supplies where efficiency gains justify the cost premium [11].

What quality-certification frameworks matter most for automotive-grade electronic circuit elements?

AEC-Q100 (ICs), AEC-Q101 (discrete devices), and AEC-Q200 (passive parts) are the baseline qualifications. IATF 16949 process certification is additionally required for Tier-1 supply, and failure to maintain it can disqualify a supplier from major OEM programs [8].

How does the shift to chiplet-based architectures affect the electronic components market?

Chiplet disaggregation multiplies the number of discrete electronic devices per package — a single chiplet-based processor may integrate 4–8 separately fabricated dies connected by advanced interposers. This trend increases demand for high-density substrates and specialty capacitors in the surrounding PCB component supply [12].

What financing models are emerging for fab construction in the electronic components market?

Public-private co-investment structures dominate, with governments covering 25–40% of capital costs through grants and tax credits while manufacturers fund the remainder. TSMC's Arizona project, for instance, blends USD 6.6 billion in CHIPS Act grants with company equity and debt financing [1].

How do tariff and trade-policy shifts influence passive electronic parts sourcing?

U.S. Section 301 tariffs on Chinese-origin components range from 7.5% to 25%, prompting buyers to shift MLCC and resistor procurement toward Japanese, Korean, and Southeast Asian suppliers. Dual-sourcing across tariff jurisdictions adds roughly 3–5% to total landed cost but mitigates regulatory exposure [13].


Author
Author
Author Profile
Nirmit Biswas LinkedIn
Senior Research Analyst
With 5+ years of expertise in Market Intelligence and Strategic Research, Nirmit Biswas specializes in ICT, Semiconductors, and BFSI. Backed by an MBA in Financial Services and a Computer Science foundation, Nirmit blends technical depth with business acumen. He has successfully led 100+ projects for global enterprises and startups, including Amazon, Cisco, L&T and Huawei, delivering market estimations, competitive benchmarking, and GTM strategies. His focus lies in transforming complex data into clear, actionable insights that drive growth, innovation, and investment decisions. Recognized for bridging engineering innovation with executive strategy, Nirmit helps businesses navigate dynamic markets with confidence.
Co-Author
Co-Author Profile
Shubham Munde LinkedIn
Team Lead - Research
Shubham brings over 7 years of expertise in Market Intelligence and Strategic Consulting, with a strong focus on the Automotive, Aerospace, and Defense sectors. Backed by a solid foundation in semiconductors, electronics, and software, he has successfully delivered high-impact syndicated and custom research on a global scale. His core strengths include market sizing, forecasting, competitive intelligence, consumer insights, and supply chain mapping. Widely recognized for developing scalable growth strategies, Shubham empowers clients to navigate complex markets and achieve a lasting competitive edge. Trusted by start-ups and Fortune 500 companies alike, he consistently converts challenges into strategic opportunities that drive sustainable growth.

Research Approach


Secondary Research

The secondary research process involved comprehensive analysis of regulatory databases, industry standards publications, technical journals, and authoritative electronics industry organizations. Key sources included the US Department of Commerce (Bureau of Industry and Security), European Commission (Directorate-General for Internal Market, Industry, Entrepreneurship and SMEs), International Trade Administration (ITA), Semiconductor Industry Association (SIA), Electronic Components Industry Association (ECIA), IPC (Association Connecting Electronics Industries), IEEE Xplore Digital Library, US International Trade Commission (USITC), Eurostat Manufacturing Statistics, World Semiconductor Trade Statistics (WSTS), Japan Electronics and Information Technology Industries Association (JEITA), China Semiconductor Industry Association (CSIA), Korea Semiconductor Industry Association (KSIA), Taiwan Semiconductor Industry Association (TSIA), United Nations Comtrade Database, OECD STAN Database for Structural Analysis, and national statistical offices from key semiconductor manufacturing countries. These sources were used to collect production statistics, trade flow data, regulatory compliance requirements, technology roadmaps, and market landscape analysis for active electronic components (semiconductors, integrated circuits, transistors, diodes, display devices) and passive electronic components (resistors, capacitors, inductors, electromechanical components).


Primary Research

In order to gather both qualitative and quantitative insights, supply-side and demand-side stakeholders were interviewed during the primary research process. CEOs, VPs of Product Development, chief technology officers, and supply chain directors from semiconductor foundries, electronic component makers, and EMS providers were examples of supply-side sources. Procurement heads from consumer electronics OEMs, automotive electronics engineers, aerospace and defense systems integrators, industrial automation experts, and R&D heads from telecom and medical device manufacturers were examples of demand-side sources. Market segmentation, technology migration schedules, supply chain resilience tactics, price dynamics, and inventory management trends were all confirmed by primary research.

Primary Respondent Breakdown:

By Designation: C-level Primaries (28%), Director Level (35%), Others (37%)

By Region: North America (32%), Europe (30%), Asia-Pacific (33%), Rest of World (5%)


Market Size Estimation

Global market valuation was derived through revenue mapping and production volume analysis. The methodology included:

Identification of 50+ key manufacturers across North America, Europe, Asia-Pacific, and Latin America

Product mapping across active components (semiconductors, ICs, transistors, diodes, LEDs, displays) and passive components (resistors, capacitors, inductors, electromechanical devices)

Analysis of reported and modeled annual revenues specific to electronic component portfolios

Coverage of manufacturers representing 75-80% of global market share in 2024

Extrapolation using bottom-up (shipment volume × ASP by component category and region) and top-down (manufacturer revenue validation) approaches to derive segment-specific valuations for consumer electronics, automotive, aerospace & defense, industrial, medical, telecommunications, utilities, and robotics end-use verticals

Download Free Sample

Kindly complete the form below to receive a free sample of this Report

Download PDF ×

We do not share your information with anyone. However, we may send you emails based on your report interest from time to time. You may contact us at any time to opt-out.