Power Electronics Market (2025 - 2035)

Power Electronics Market Size, Share and Research Report: By Application (Consumer Electronics, Automotive, Industrial, Renewable Energy, Telecommunication), By Type (Power Discrete Devices, Power Modules, Power ICs), By Component (Diodes, Transistors, Thyristors, Integrated Circuits, Capacitors), By End Use (Residential, Commercial, Industrial) and By Regional (North America, Europe, South America, Asia Pacific, Middle East and Africa) - Industry Forecast Till 2035
ID: MRFR/SEM/0563-CR
174 Pages
Nirmit Biswas, Aarti Dhapte
Last Updated: June 26, 2026
Power Electronics Market
Market Size
Forecast Period2025-2035
CAGR (2025-2035)6.65%
2025 Market SizeUSD 30.80 Billion
2035 Market SizeUSD 58.64 Billion
Key Players
Infineon Technologies
ON Semiconductor
STMicroelectronics
Texas Instruments
Mitsubishi Electric
Toshiba Electronic Devices
Opportunities
  • 800 V and Higher EV Architecture Migration
  • GaN-on-Silicon for Consumer and Telecom Fast Charging
  • Emerging-Market Grid Electrification

Power Electronics Market Summary

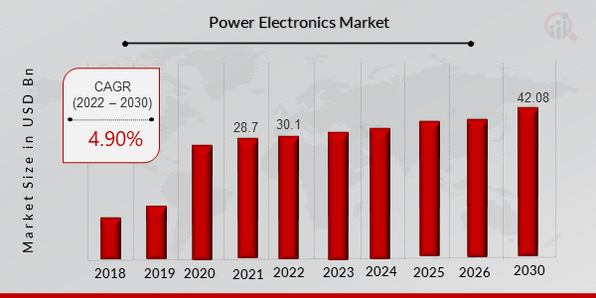
The Power Electronics Market reached an estimated USD 30.80 Billion in 2025 and is projected to expand from USD 32.86 Billion in 2026 to USD 58.64 Billion by 2035, registering a CAGR of 6.65% across the forecast period. Two forces are converging to propel this trajectory: national electrification mandates — the U.S. Inflation Reduction Act alone directs over USD 30 Billion toward clean-energy manufacturing [1] — and the automotive industry's irreversible pivot to battery-electric platforms, where every vehicle relies on sophisticated power semiconductor architectures for traction inverters, onboard chargers, and thermal management systems [2].

A generational technology transition is reshaping the Power Electronics Market from the material level upward. Legacy silicon-based designs that dominated for decades are giving way to wide-bandgap semiconductors — silicon carbide and gallium nitride — that deliver higher switching frequencies, lower conduction losses, and superior thermal performance at smaller die sizes. The U.S. Department of Energy's PowerAmerica initiative has invested over USD 140 Million in domestic wide-bandgap manufacturing capacity since its inception, accelerating the commercialization pipeline for 1,200 V and 1,700 V device platforms [3].

Asia-Pacific commands approximately 45.3% of global Power Electronics Market revenue, anchored by China's semiconductor self-sufficiency drive and Japan's subsidized silicon-carbide expansion programs. North America represents the second-largest region with roughly 24.8% share, fueled by electric-vehicle production scaling and data-center power infrastructure upgrades. Europe follows at 21.5%, where the EU Chips Act has earmarked over EUR 43 Billion to strengthen the continent's semiconductor supply chain through 2030 [4]. The decade ahead will reward companies that can bridge the gap between module-level integration and system-level intelligence.


Key Report Takeaways

• By Component

  • Discrete devices accounted for 49.2% of Power Electronics Market revenue in 2025, reflecting continued demand from consumer electronics and industrial motor drives.
  • The modules segment is forecast to register the fastest component-level growth through 2035, driven by factory-tested power module packages embedding integrated sensing and gate-driver circuitry.

• By Device Type

  • MOSFETs commanded the largest device-type share within the Power Electronics Market during 2025, underpinned by high-frequency switching applications in telecom power supplies and server infrastructure.
  • The automotive-grade IGBT segment is expanding as traction inverter platforms demand ruggedized, high-reliability packaging.

• By Material

  • Silicon retained a commanding share of the Power Electronics Market material revenue in 2025, though incremental gains are flattening as design limits tighten.
  • Silicon carbide is projected to grow at a CAGR of 9.37% through 2035 as 800 V EV architectures and renewable-energy inverters adopt wide-bandgap devices.

• By End-User Industry

  • Consumer electronics held 25.6% of the Power Electronics Market in 2025.
  • The automotive segment is projected to post the highest end-user CAGR of 9.85% through 2035.

• By Region

  • Asia-Pacific captured 45.3% of the Power Electronics Market in 2025, leading both volume shipments and design-win activity.
  • North America and Europe collectively accounted for over 46% of global revenue, supported by reshoring incentives and data-center build-outs.


Market Size and Forecast (2021–2035)

Market Research Future employs a triangulated estimation framework combining bottom-up component shipment data, top-down macroeconomic indicators, and proprietary demand models validated against quarterly earnings disclosures from leading semiconductor manufacturers. Historical figures (2021–2024) reflect audited financial results and trade statistics; the base year (2025) is estimated from trailing-twelve-month shipment volumes; forecast values (2026–2035) incorporate policy scenario modeling and technology adoption curves.

Power Electronics Market Size and Forecast
Our Impact
Enabled $4.3B Revenue Impact for Fortune 500 and Leading Multinationals
Partnering with 2000+ Global Organizations Each Year
30K+ Citations by Top-Tier Firms in the Industry

Driver Impact Analysis

Driver ~% Impact on CAGR Geographic Relevance Impact Timeline
Electric vehicle powertrain electrification ~28% Global Short-term (≤2 yr)
Renewable energy inverter deployment ~22% Asia-Pacific, Europe Medium-term (2–4 yr)
Data-center power density escalation ~18% North America, Asia-Pacific Short-term (≤2 yr)
Wide-bandgap semiconductor commercialization ~14% Global Medium-term (2–4 yr)
Industrial automation and motor drive upgrades ~8% Europe, Asia-Pacific Long-term (≥4 yr)
EV charging infrastructure buildout ~6% North America, Europe Medium-term (2–4 yr)
5G/telecom base station densification ~4% Asia-Pacific Long-term (≥4 yr)


Electric Vehicle Powertrain Electrification

Global EV sales exceeded 17 million units in 2024, and by 2030, BloombergNEF predicts the fleet will reach 40 million cars annually [2]. Traction inverters, DC-DC converters, and onboard chargers are among the power semiconductors worth between USD 350 and USD 800 found in each battery-electric car, making the automobile industry the single largest incremental demand vector for the power electronics market. The EU's 2035 phase-out of combustion engines and China's NEV mandate, which calls for a 50% penetration of new energy vehicles by 2030, are legislative backstops that make this demand fundamentally stable rather than cyclical [14].


Renewable Energy Inverter Deployment

Global solar PV capacity is expected to triple to over 5,000 GW by 2030 under the International Energy Agency's Net Zero Emissions scenario, with each megawatt requiring advanced string or central inverter systems [9]. As designers move to three-level topologies and use silicon-carbide output stages to increase conversion efficiencies above 99%, power semiconductor content per inverter has increased by 15–20%. The energy vertical's addressable power electronics market is immediately growing as a result.


Data-Center Power Density Escalation

AI training clusters now consume 40–80 kW per rack — four to eight times the density of conventional enterprise servers — and hyperscale operators plan to deploy over 100 GW of total data-center capacity globally by 2030 [10]. Every rack requires multi-phase voltage regulator modules, server power supplies rated at 3 kW+, and UPS systems — all heavily reliant on advanced power MOSFETs and GaN-based converters. This represents a fast-moving demand channel for the Power Electronics Market.

Wide-Bandgap Semiconductor Commercialization

Wolfspeed's USD 5 Billion silicon-carbide fab in Siler City, North Carolina, and STMicroelectronics' EUR 730 Million SiC expansion in Catania, Italy, signal that the industry is investing at scale to bring wide-bandgap devices from premium niches into mainstream cost parity [3]. As 150 mm SiC wafer yields improve and the 200 mm transition begins, device costs are projected to decline 30–40% by 2030, unlocking new design wins across the Power Electronics Market.


Restraints Impact Analysis

The restraint impact percentages below reflect Market Research Future's directional assessment of headwinds constraining market growth. These factors moderate — but do not negate — the positive CAGR drivers outlined in Section 4.

Restraint ~% Negative Impact on CAGR Geographic Relevance Impact Timeline
SiC/GaN substrate cost premiums ~–1.8% Global Short-term (≤2 yr)
Export control and supply-chain fragmentation ~–1.2% US–China corridor Medium-term (2–4 yr)
Thermal management complexity at higher power ~–0.8% Global Long-term (≥4 yr)
Skilled workforce shortages in fab operations ~–0.6% North America, Europe Medium-term (2–4 yr)
Lengthy automotive qualification cycles ~–0.5% Global Long-term (≥4 yr)


Substrate Cost Premiums

Gallium-nitride epitaxial layers provide an additional premium at the foundry level, while silicon-carbide wafers continue to cost five to eight times more than similar silicon substrates [15]. Pricing resistance is created during the transition phase, even while cost curves are decreasing, especially in cost-sensitive consumer electronics categories where bill-of-materials pressure is high. For applications below 600 V, where silicon is still technically sufficient, this cost difference hinders adoption rates in the Power Electronics Market.


Export Controls and Supply-Chain Fragmentation

Global supply chains are being split apart by Beijing's retaliatory actions and U.S. semiconductor export restrictions that target advanced chip-making equipment to China [16]. Longer lead times, redundant inventory buffers, and growing compliance costs are challenges faced by power semiconductor firms with cross-border fabrication networks. Although the CHIPS and Science Act provides offsetting incentives for domestic manufacture, the Power Electronics Market will ultimately face higher structural costs over the medium term.


Thermal Management Complexity

As power densities climb — particularly in EV traction inverters pushing above 200 kW and AI server racks exceeding 50 kW — thermal dissipation becomes a binding constraint [17]. Advanced cooling solutions such as double-sided cooled modules and direct liquid cooling add cost and design complexity, moderating the pace at which OEMs can scale next-generation platforms within the Power Electronics Market.


Power Electronics Market Opportunities

800 V and Higher EV Architecture Migration

Pioneered by Porsche's Taycan and Hyundai's E-GMP, the switch from 400 V to 800 V battery platforms is generating a completely new device tier that calls for high-speed gate drivers and 1,200 V-rated SiC MOSFETs. As key OEMs like GM, BMW, and BYD commit to 800 V architectures by 2028, suppliers who can qualify automotive-grade 1,200 V modules stand to gain a disproportionate share.


GaN-on-Silicon for Consumer and Telecom Fast Charging

Gallium nitride power integrated circuits (ICs) are replacing silicon adapters in laptop and smartphone chargers, resulting in threefold increases in power density. The addressable market for GaN devices in consumer electronics alone may surpass USD 2.5 billion by 2030 if USB-PD 3.1 is extended to 240 W. Upgrades to telecom rectifiers provide a parallel runway.


Emerging-Market Grid Electrification

India's Revamped Distribution Sector Scheme commits INR 3.03 trillion (approximately USD 36 Billion) to grid modernization, while Sub-Saharan Africa requires over 200 GW of new generation capacity by 2040 according to the IEA [9]. These programs demand massive volumes of power semiconductors for transformerless inverters, FACTS devices, and HVDC converter stations — opening a significant growth corridor for the Power Electronics Market in regions currently underserved.

Digital-Twin and Predictive-Maintenance Platforms

Power module manufacturers are embedding temperature, current, and vibration sensors directly into packages, enabling cloud-connected digital-twin services that predict remaining useful life. This creates a recurring-revenue business model layered on top of hardware sales — a data-monetization pathway that could generate 8–12% of incremental revenue for vertically integrated suppliers by 2030.

Onshore Semiconductor Reshoring Incentives

The U.S. CHIPS Act, the EU Chips Act, Japan's semiconductor subsidy program, and South Korea's K-Chips Act collectively represent over USD 150 Billion in government incentives aimed at building domestic fab capacity [4]. These programs disproportionately benefit the Power Electronics Market because power devices require mature-node fabs (28 nm and above) that can be built faster and at lower capital intensity than leading-edge logic fabs.


Power Electronics Market Future Outlook

AI-Driven Power System Intelligence

Artificial intelligence is migrating from the cloud into power electronic converters themselves. Edge-AI gate drivers that optimize switching patterns in real time can reduce losses by 5–10% in motor-drive applications, while predictive algorithms extend module lifetimes by dynamically derating devices before thermal limits are breached [21]. The Power Electronics Market will increasingly compete on embedded software differentiation alongside hardware performance.

Electrification Supercycle

The convergence of transportation electrification, building decarbonization, and industrial process heating is creating a multi-decade electrification supercycle. The IEA projects global electricity demand will grow 75% by 2050, with every incremental kilowatt-hour requiring power conversion at generation, transmission, distribution, and end-use [9]. This structural tailwind underpins long-duration demand visibility for the Power Electronics Market.

Platform Consolidation and Modular Architectures

Automotive and industrial OEMs are consolidating around standardized power module platforms — such as the automotive half-bridge module — to reduce qualification costs and improve supply-chain resilience. This platformization rewards suppliers who can offer scalable portfolios spanning 75 A to 800 A ratings on common footprints, reshaping competitive dynamics within the Power Electronics Market.

ESG Reporting and Efficiency Mandates

The EU's Corporate Sustainability Reporting Directive (CSRD) and the SEC's climate disclosure rules are making energy efficiency a boardroom priority [22]. Power electronics manufacturers that can document lifecycle carbon reductions — through higher conversion efficiencies, lower standby losses, and recyclable packaging — will win specification advantages in procurement processes where ESG scores influence supplier selection.


Power Electronics Market Segmentation

By Component

Segment Key Metric Primary Demand Driver
Discrete 49.2% share (2025) High-volume consumer and industrial applications
Module CAGR 7.72% (2026–2035) Factory-tested integration for EV and renewable systems
Integrated Power IC USD 4.82 Billion (2025) Smartphone chargers, IoT power management


Discrete power devices continue to anchor the Power Electronics Market by volume, serving price-sensitive applications in consumer adapters, LED drivers, and low-power motor controls where design simplicity outweighs integration benefits. The segment's dominance reflects decades of optimized silicon manufacturing at scale.

Power modules are gaining share as automotive and industrial customers demand pre-validated, thermally optimized packages that compress development timelines. Third-generation modules with integrated current sensors and temperature monitoring ICs are shortening time-to-market for tier-1 automotive suppliers developing 800 V traction inverter platforms.

By Device Type

Segment Key Metric Primary Demand Driver
MOSFET CAGR 8.85% (2026–2035) High-frequency switching in server power and EV chargers
IGBT USD 6.25 Billion (2025) Traction inverters, wind turbine converters
Thyristor 8.2% share (2025) HVDC transmission, industrial heating
Diode CAGR 5.3% (2026–2035) Rectification, freewheeling protection


MOSFETs represent the broadest device category in the Power Electronics Market, spanning voltage ratings from 20 V laptop VRMs to 1,700 V SiC devices for solar inverters. The device type benefits from rapid wide-bandgap material adoption, with SiC MOSFETs now accounting for a growing share of new traction-inverter design starts.

IGBTs remain the workhorse for high-power applications above 1 kV, particularly in renewable-energy converters and railway drives. Infineon and Mitsubishi Electric dominate this segment through proprietary trench-gate and carrier-stored architectures that balance switching speed with conduction loss performance.

By Material

Segment Key Metric Primary Demand Driver
Silicon 84.6% share (2025) Mature manufacturing, cost optimization
Silicon Carbide CAGR 9.37% (2026–2035) EV traction, solar, high-temp industrial
Gallium Nitride USD 1.15 Billion (2025) Fast chargers, RF telecom, lidar


Silicon's entrenched position within the Power Electronics Market reflects over six decades of process refinement, yielding devices at a fraction of wide-bandgap costs. The material will remain dominant through 2035 even as its share gradually compresses.

Silicon carbide is the fastest-growing material segment, driven by automotive OEMs committing to 800 V and 1,200 V platforms. Capacity expansions by Wolfspeed, STMicroelectronics, onsemi, and ROHM are expected to quadruple global SiC wafer output by 2030, bringing cost-per-ampere closer to silicon parity in automotive applications [3].

By End-User Industry

Segment Key Metric Primary Demand Driver
Consumer Electronics 25.6% share (2025) Smartphone and laptop power delivery
Automotive CAGR 9.85% (2026–2035) EV powertrain electrification
ICT and Telecommunication USD 5.12 Billion (2025) 5G base stations, data-center power
Industrial 18.9% share (2025) Motor drives, welding, process automation
Energy and Power CAGR 7.4% (2026–2035) Solar/wind inverters, grid infrastructure


Consumer electronics anchors steady baseline demand for the Power Electronics Market, with USB-PD fast-charging and GaN adapter adoption driving value-per-unit increases. The automotive segment is the definitive growth engine: every BEV requires USD 350–800 in power semiconductor content across traction, charging, and auxiliary systems. Automaker commitments to 100% electric lineups by 2035 make this demand trajectory structurally non-cyclical.


Regional Market Share Analysis

Region Key Metric Primary Investment Themes
Asia-Pacific 45.3% share (2025) EV manufacturing, SiC fab expansion, renewable installations
North America USD 7.64 Billion (2025) CHIPS Act reshoring, data-center power, EV charging
Europe 21.5% share (2025) EU Chips Act, automotive OEM electrification, offshore wind
South America CAGR 5.9% (2026–2035) Grid modernization, industrial motor upgrades
Middle East & Africa 4.2% share (2025) Solar-plus-storage, desalination, transmission upgrades
Total USD 30.80 Billion (2025)

The Power Electronics Market exhibits a concentrated regional structure, with Asia-Pacific dominating both production and consumption. Regional dynamics are shaped by the intersection of manufacturing ecosystem maturity, policy incentives, and end-market demand composition.


North America

Country Key Metric Key Driver
US 78.5% of regional share CHIPS Act incentives, hyperscale data centers
Canada CAGR 6.1% EV battery gigafactory investments
Mexico USD 0.52 Billion (2025) Nearshoring electronics manufacturing


The U.S. dominates North America's Power Electronics Market, with Wolfspeed, onsemi, and Texas Instruments expanding domestic SiC and GaN capacity under CHIPS Act grants. Canada's EV battery corridor — stretching from Quebec to Ontario — is drawing power semiconductor design centers, while Mexico's manufacturing cost advantages are attracting tier-2 module assembly operations.

Europe

Country Key Metric Key Driver
Germany 32.4% of regional share Automotive OEM electrification
UK CAGR 6.4% Compound semiconductor cluster (South Wales)
France USD 0.89 Billion (2025) Nuclear and renewable inverter programs
Italy 9.8% of regional share STMicroelectronics SiC expansion
Spain CAGR 5.8% Solar PV inverter demand
Nordic Countries USD 0.48 Billion (2025) Offshore wind converter stations
Russia 3.1% of regional share Import substitution for industrial drives
Rest of Europe CAGR 5.5% Grid interconnection upgrades


Germany's Power Electronics Market leadership reflects its automotive industry's aggressive EV transition, with Infineon, Bosch, and Continental driving vertical integration from wafer to module. The EU Chips Act's semiconductor sovereignty agenda is channeling billions into fab expansions across Germany, Italy, and France [4].

Asia-Pacific

Country Key Metric Key Driver
China 52.8% of regional share NEV mandates, domestic SiC capacity
India CAGR 8.9% Grid modernization, solar manufacturing
Japan USD 2.62 Billion (2025) SiC substrate leadership, industrial robotics
South Korea 10.3% of regional share EV battery ecosystem, display power management
ASEAN CAGR 7.2% Electronics assembly, EV adoption
Rest of Asia-Pacific 4.6% of regional share Emerging demand channels


China's Power Electronics Market is propelled by state-directed investment exceeding USD 50 billion in third-generation semiconductors, alongside the world's largest EV production base shipping over 9 million NEVs in 2024 [20]. Japan maintains technology leadership in SiC substrate production through Resonac and Coherent, while India's production-linked incentive scheme for semiconductor fabs is positioning it as the next major growth frontier.

South America

Country Key Metric Key Driver
Brazil 62.5% of regional share Renewable energy installations
Argentina CAGR 5.4% Lithium mining electrification
Rest of South America USD 0.32 Billion (2025) Infrastructure upgrades


Brazil's Power Electronics Market benefits from one of the world's most renewable-heavy generation mixes, with solar and wind installations requiring increasing volumes of grid-tied inverters and power conditioning equipment. Argentina's emerging lithium-extraction industry is a niche but growing demand source for ruggedized industrial power systems.

Middle East & Africa

Country Key Metric Key Driver
Saudi Arabia 28.7% of regional share NEOM, Vision 2030 infrastructure
UAE CAGR 6.8% Smart-city and solar deployments
South Africa USD 0.22 Billion (2025) Grid stabilization, mining drives
Egypt 11.4% of regional share Suez economic zone industrialization
Rest of MEA CAGR 5.1% Rural electrification programs


Saudi Arabia's Vision 2030 mega-projects — including NEOM's industrial city — are generating substantial demand for the Power Electronics Market in HVDC transmission, district cooling, and renewable integration. South Africa's grid instability is accelerating UPS and power-conditioning system adoption.


Power Electronics Market By Region, 2025-2035

Competitive Benchmarking

The Power Electronics Market exhibits medium concentration, with the top five suppliers collectively holding an estimated 42–48% of global revenue. The Herfindahl-Hirschman Index sits in the 700–900 range, indicating a moderately competitive structure where scale advantages in wafer fabrication coexist with design-win-driven market entry by fabless and fab-lite specialists. Competitive intensity is rising as integrated device manufacturers defend silicon positions while newer entrants capture share through wide-bandgap performance differentiation.

Company Est. Revenue Share Range Key Offerings for the Power Electronics Market Strategic Positioning
Infineon Technologies ~12–15% IGBT modules, SiC MOSFETs, GaN HEMTs, automotive power ICs Vertically integrated; dominant in automotive and industrial
ON Semiconductor (onsemi) ~8–11% SiC MOSFETs, IGBTs, power management ICs Aggressive SiC capacity expansion; strong EV traction pipeline
STMicroelectronics ~7–10% SiC diodes and MOSFETs, IGBTs, GaN devices European SiC leader; long-term Tesla supply agreement
Texas Instruments ~6–9% GaN power stages, analog power management, gate drivers Broad catalog; 300 mm fab advantage for cost leadership
Mitsubishi Electric ~5–8% IGBT modules, SiC hybrid modules, IPMs Railway and industrial stronghold; J-series IGBT leadership
Toshiba Electronic Devices ~4–6% MOSFETs, IGBTs, SiC Schottky diodes Cost-competitive discrete portfolio; strong Japan/Asia distribution
Renesas Electronics ~3–5% Power MOSFETs, IGBT gate drivers, and power management ICs System-level integration; acquired Dialog for analog synergies
Vishay Intertechnology ~3–5% MOSFETs, diodes, thyristors, and resistive power components Broadest discrete portfolio; industrial and military qualification
ROHM Semiconductor ~2–4% SiC MOSFETs, SiC diodes, automotive power modules Early SiC mover; vertically integrated from substrate to module
Fuji Electric ~2–4% IGBT modules, SiC hybrid modules, and power conditioning Renewable energy inverter specialist; strong in Japan/Asia
Wolfspeed ~1–3% SiC substrates, SiC MOSFETs, SiC power modules Pure-play SiC; building world's largest SiC fab


Recent News & Developments

  • Infineon Technologies (October 2024): Opened a EUR 5 Billion 300 mm power semiconductor fab in Dresden, Germany — Europe's largest — targeting automotive and industrial IGBT and SiC production at full capacity by 2027 [4].
  • Wolfspeed (September 2024): Secured USD 750 Million in CHIPS Act funding for its 200 mm silicon-carbide mega-fab in Siler City, North Carolina, expected to produce over 100 million SiC devices annually by 2030 [3].
  • STMicroelectronics (June 2024): Announced a joint venture with Sanan Optoelectronics to build a USD 3.2 Billion SiC device manufacturing facility in Chongqing, China, targeting the domestic EV market [20].
  • onsemi (March 2024): Expanded its SiC substrate production facility in Hudson, New Hampshire, investing USD 2 Billion to vertically integrate from boule growth through finished modules [23].
  • Renesas Electronics (January 2024): Completed its USD 5.9 Billion acquisition of Wolfspeed's radio-frequency GaN business, strengthening its position in 5G infrastructure power solutions [24].
  • Texas Instruments (August 2023): Broke ground on a new USD 11 Billion 300 mm analog and power semiconductor fab in Sherman, Texas, supported by CHIPS Act incentives [25].
  • European Commission (April 2023): Published implementing guidelines for the EU Chips Act, designating power semiconductors as a strategic priority and allocating EUR 3.3 Billion for pilot-line development [4].
  • In February 2026, Infineon Technologies started manufacturing at its enlarged SiC factory in Villach, Austria, adding 200 mm of capacity, or 50,000 automobile modules annually. The investment of EUR 2 billion (USD 2.2 billion) secured long-term supply agreements with BMW and Volkswagen.
  • January 2026: In order to jointly develop 1,000-V SiC modules for Geely's next electric vehicle platform, STMicroelectronics and Geely Automobile established exclusivity through 2030.


Power Electronics Market Report Scope

Parameter Detail
Market Scope Global Power Electronics Market covering discrete devices, modules, and integrated power ICs across automotive, consumer electronics, industrial, ICT, and energy end-user industries
Study Period 2021–2035
CAGR (2026–2035) 6.65%
Market Size (2025) USD 30.80 Billion
Market Size (2035) USD 58.64 Billion
Fastest Growing Segments Silicon carbide (by material); Automotive (by end-user); Asia-Pacific (by region)
Companies Profiled Infineon Technologies, onsemi, STMicroelectronics, Texas Instruments, Mitsubishi Electric, Toshiba, Renesas Electronics, Vishay Intertechnology, ROHM Semiconductor, Fuji Electric, Wolfspeed
Valuation Currency USD Billion


FAQs

How do automotive OEMs typically qualify power semiconductor suppliers for traction inverters?
OEMs require AEC-Q101 qualification plus 1,000–2,000 hours of high-temperature reverse-bias and power-cycling endurance testing. Full qualification from sample submission to production release typically spans 18–24 months [19].
What is the cost premium of silicon-carbide devices over silicon equivalents in 2025?
SiC MOSFETs carry a 3–5× cost premium per ampere compared to silicon IGBTs at equivalent voltage ratings. This gap is expected to narrow to 1.5–2× by 2030 as 200 mm wafer production scales [15].
Which power semiconductor packaging trend poses the greatest reliability risk?
Double-sided sintered interconnects eliminate wire bonds but introduce new failure modes at the sinter-layer interface under thermal cycling. Manufacturers are developing copper-sintering pastes to improve fatigue life beyond 15,000 power cycles [17].
How are tariffs affecting Power Electronics Market supply-chain decisions?
U.S. Section 301 tariffs on Chinese semiconductor imports have prompted module assemblers to shift final packaging steps to Malaysia and Vietnam. Landed costs have risen 8–12% for tariff-exposed product lines [16].
What role does gallium nitride play in the Power Electronics Market beyond consumer chargers?
GaN devices are penetrating 5G envelope-tracking amplifiers, lidar driver circuits, and satellite power buses where high switching frequency and low parasitic capacitance deliver system-level size and weight reductions [13].
How do integrated device manufacturers protect margin against fabless competitors?
Vertically integrated players leverage captive substrate supply, proprietary epitaxial processes, and module-level system integration to create switching-cost barriers. Design-win stickiness increases when customers adopt vendor-specific gate-driver ecosystems [8].
What procurement criteria should buyers prioritize when selecting Power Electronics Market suppliers?
Buyers should evaluate substrate sourcing security, multi-site manufacturing redundancy, and application-engineering support depth. Long-term supply agreements with guaranteed capacity allocation have become critical since the 2021–2023 chip shortage [7].    
Author
Author
Author Profile
Nirmit Biswas LinkedIn
Senior Research Analyst
With 5+ years of expertise in Market Intelligence and Strategic Research, Nirmit Biswas specializes in ICT, Semiconductors, and BFSI. Backed by an MBA in Financial Services and a Computer Science foundation, Nirmit blends technical depth with business acumen. He has successfully led 100+ projects for global enterprises and startups, including Amazon, Cisco, L&T and Huawei, delivering market estimations, competitive benchmarking, and GTM strategies. His focus lies in transforming complex data into clear, actionable insights that drive growth, innovation, and investment decisions. Recognized for bridging engineering innovation with executive strategy, Nirmit helps businesses navigate dynamic markets with confidence.
Co-Author
Co-Author Profile
Aarti Dhapte LinkedIn
AVP - Research
A consulting professional focused on helping businesses navigate complex markets through structured research and strategic insights. I partner with clients to solve high-impact business problems across market entry strategy, competitive intelligence, and opportunity assessment. Over the course of my experience, I have led and contributed to 100+ market research and consulting engagements, delivering insights across multiple industries and geographies, and supporting strategic decisions linked to $500M+ market opportunities. My core expertise lies in building robust market sizing, forecasting, and commercial models (top-down and bottom-up), alongside deep-dive competitive and industry analysis. I have played a key role in shaping go-to-market strategies, investment cases, and growth roadmaps, enabling clients to make confident, data-backed decisions in dynamic markets.

Research Approach


Secondary Research

The secondary research process involved comprehensive analysis of regulatory databases, peer-reviewed engineering journals, technical publications, and authoritative industry organizations. Key sources included the US Department of Energy (DOE) Office of Energy Efficiency & Renewable Energy, European Commission Directorate-General for Energy, International Energy Agency (IEA), Power Sources Manufacturers Association (PSMA), Institute of Electrical and Electronics Engineers (IEEE), International Electrotechnical Commission (IEC) standards database, US Environmental Protection Agency (EPA) Energy Star Program, US Department of Transportation National Highway Traffic Safety Administration (NHTSA), European Semiconductor Industry Association (ESIA), Japan Electronics and Information Technology Industries Association (JEITA), China Semiconductor Industry Association (CSIA), SEMI (Semiconductor Equipment and Materials International), World Semiconductor Trade Statistics (WSTS), US International Trade Commission (USITC) HS Code 8541 trade databases, European Union Trade Statistics (Eurostat), International Trade Centre (ITC) Trade Map, US Patent and Trademark Office (USPTO) patent database, European Patent Office (EPO), National Renewable Energy Laboratory (NREL) technical reports, Oak Ridge National Laboratory (ORNL) power electronics research, International Rectifier Technical Library, and regulatory filings from national energy ministries of key markets (Germany BMWi, Japan METI, China NEA, India MNRE).

Regulatory compliance data (RoHS, REACH, automotive AEC-Q standards), technology roadmap analysis, patent landscape assessment, trade flow analysis for semiconductor devices, efficiency standard mandates, and market landscape analysis for power discrete devices (MOSFETs, IGBTs, Diodes, Thyristors), power modules (Intelligent Power Modules, Standard Power Modules), power integrated circuits, and wide bandgap materials (Silicon Carbide, Gallium Nitride).


Primary Research

In order to gather both qualitative and quantitative insights, supply-side and demand-side stakeholders were interviewed during the primary research process. CEOs, VPs of Product Development, heads of fab operations, and strategic marketing directors from foundries, OEMs, and power semiconductor IDMs (Integrated Device Manufacturers) were examples of supply-side sources. Chief engineers, the vice president of powertrain engineering, procurement heads from Tier-1 automakers, manufacturers of industrial automation, data center operators, producers of renewable energy inverters, and ODMs of consumer electronics were among the demand-side sources. Primary research verified SiC/GaN capacity expansion schedules, validated market segmentation across device categories, and obtained information on supply chain localization dynamics, pricing strategies for 650V–1700V devices, and adoption trends of thermal management.

Primary Respondent Breakdown:

By Designation C-level Primaries (28%), Director Level (42%), Others (30%)

By Region North America (32%), Europe (25%), Asia-Pacific (35%), Rest of World (8%)


Market Size Estimation

Unit shipment analysis and revenue mapping were used to get the global market valuation. The methodology comprised:

Finding more than fifty-five major manufacturers in North America, Europe, Asia-Pacific, and Latin America, including foundry service providers (X-FAB, Vanguard International, Tower Semiconductor), IDMs (Infineon, STMicroelectronics, ON Semiconductor, Texas Instruments, Mitsubishi Electric, Fuji Electric, Toshiba, Renesas), and up-and-coming pure-play SiC/GaN experts (Wolfspeed, Navitas, Efficient Power Conversion, Transphorm).

Product mapping between:

Power Discrete: BJTs, GaN HEMTs, MOSFETs (Si & SiC), IGBTs, Diodes/Rectifiers (Si & SiC), and Thyristors

IGBT, MOSFET, Intelligent Power Modules (IPMs), Standard Power Modules, and Power Integrated Modules are examples of power modules.

PMICs, motor control ICs, and gate driver ICs are examples of power ICs.

Materials: Gallium nitride (GaN), silicon (Si), and silicon carbide (SiC)

Analysis of power electronics portfolio-specific reported and projected yearly revenues, encompassing discrete, module, and IC product lines

Coverage of producers accounting for 75–80% of the world market in 2024

Extrapolating segment-specific valuations across automotive and transportation utilizing top-down (manufacturer revenue validation, wafer capacity utilization analysis) and bottom-up (unit shipments × ASP by voltage class and application),

industrial control, consumer electronics, ICT/data centers, renewable energy (PV/wind/storage), aerospace & defense, and rail transit verticals

Download Free Sample

Kindly complete the form below to receive a free sample of this Report

Download PDF ×

We do not share your information with anyone. However, we may send you emails based on your report interest from time to time. You may contact us at any time to opt-out.