Hero Background

Energy Bar Market

ID: MRFR/FnB/12462-HCR
200 Pages
Snehal Singh
Last Updated: May 29, 2026
Energy Bar Market Size, Share, Industry Trend & Analysis Research Report By Product Type (Conventional, Organic), By Protein Source (Plant-Based, Animal-Based), By Function/Application (Sports & Endurance Nutrition, Weight Management & Lifestyle, Meal Replacement), By Packaging Type (Single-Pack Bars, Multi-Pack Boxes), By Distribution Channel (Supermarkets/Hypermarkets, Online Retail, Convenience Stores, Specialty Stores), By Geography (North America, Europe, Asia-Pacific, South America, Middle East & Africa) - Forecast to 2035
Download PDF ×

We do not share your information with anyone. However, we may send you emails based on your report interest from time to time. You may contact us at any time to opt-out.


Energy Bar Market Summary

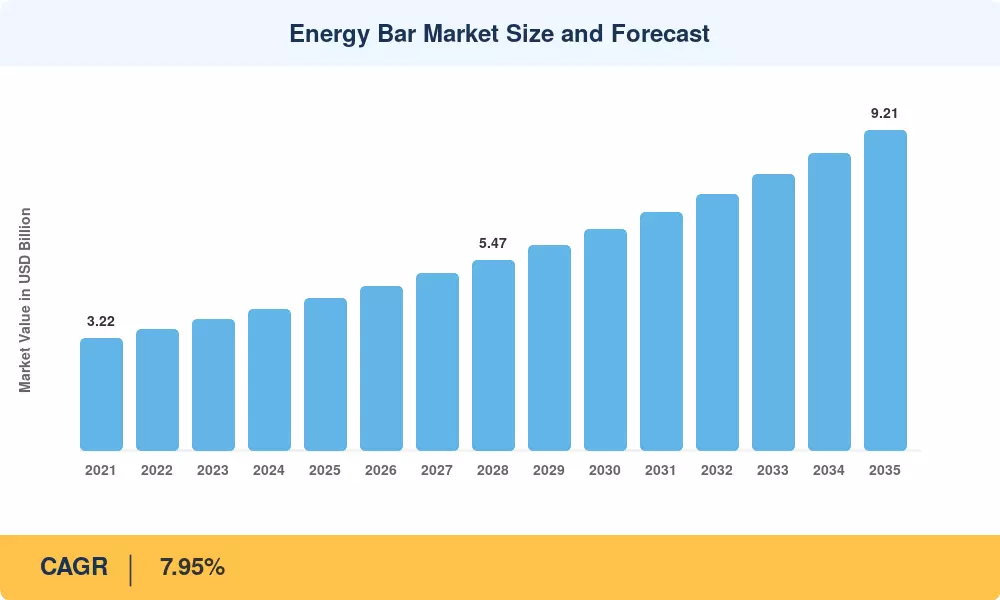
The Energy Bar Market was valued at USD 4.38 Billion in 2025, with the forecast opening at USD 4.73 Billion in 2026 and rising to USD 9.21 Billion by 2035 at a CAGR of 7.95% over the 2026–2035 window. Two catalysts anchor this trajectory: the U.S. FDA's 2025 updated definition of "healthy" food labeling, which has pushed reformulation across the protein energy snack bar category, and an estimated USD 1.8 billion in venture and strategic capital deployed into functional nutrition brands between 2023 and 2025 [1]. Demand has shifted from indulgent confectionery formats toward clean-label, macro-balanced products consumed across athletic, occupational, and meal-replacement occasions.

Reformulation is the dominant transformation underway in the Energy Bar Market. Legacy high-sugar, gelatin-bound bars are being displaced by natural whole-food energy bar formats using dates, nut butters, and pea or rice protein isolates. The International Food Information Council reports that 74% of U.S. consumers actively read protein content claims, and brands have responded with extrusion-free cold-pressed manufacturing lines — capital deployments for these lines exceeded USD 420 million globally in 2024 [2][7].

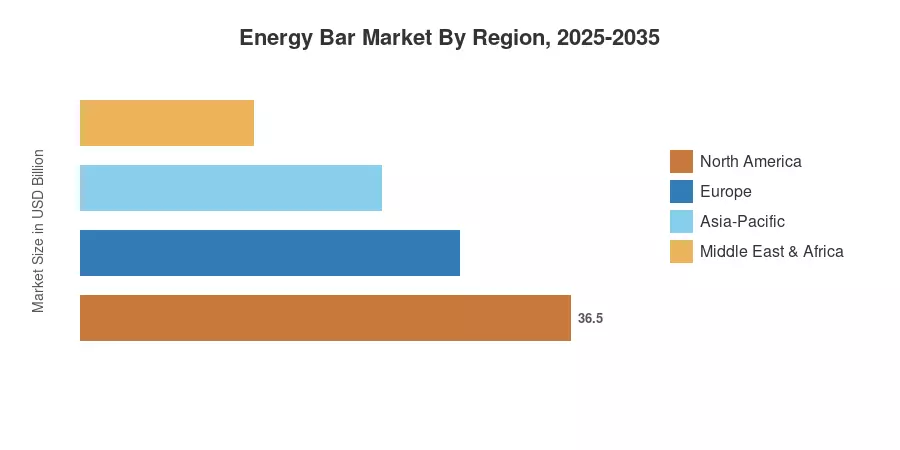
Regionally, North America leads the Energy Bar Market with a 38.6% share in 2025, supported by mature retail penetration and a deep base of sports performance energy bar SKUs. Asia-Pacific is the fastest-growing region at a 9.42% CAGR through 2035, propelled by gym memberships in India and China, while Europe holds the second-largest position at roughly 28.4% share, driven by clean-label regulation and organic certification depth. Convergence between functional nutrition and everyday snacking will define the Energy Bar Market through the next decade.

Key Report Takeaways

• By Product Type

  • Conventional bars commanded approximately 74.2% of Energy Bar Market revenue in 2025, reflecting entrenched retail shelf dominance
  • Organic bars are projected to expand at an 8.10% CAGR through 2035 on clean-label demand

• By Protein Source

  • Plant-based formats generated an estimated USD 2.41 Billion in 2025 within the Energy Bar Market, anchored by pea and rice protein systems
  • Animal-based bars, including whey and collagen formulations, are forecast to grow at an 8.32% CAGR

• By Function / Application

  • Sports and endurance nutrition held 73.9% share of 2025 demand
  • Weight-management and lifestyle-energy formats are tracking an 8.68% CAGR through 2035

• By Packaging

  • Single-pack units captured roughly 50.5% of 2025 volume in the Energy Bar Market
  • Multi-pack boxes are forecast to grow at an 8.35% CAGR, boosted by subscription channels

• By Distribution

  • Supermarkets and hypermarkets accounted for approximately USD 1.76 Billion of 2025 revenue
  • Online retail is the fastest-growing channel at a 9.05% CAGR

• By Region

  • North America leads the Energy Bar Market with 38.6% share in 2025
  • Asia-Pacific is the fastest-growing region at a 9.42% CAGR
  • Europe contributes roughly USD 1.24 Billion of 2025 revenue

Market Size and Forecast (2021–2035)

Forecast values combine top-down sizing from retail scanner data (Circana, NielsenIQ), bottom-up shipment estimates from leading manufacturers, and triangulation against trade flow data from UN Comtrade. Volumes are reported in units; values in USD Billion.

Energy Bar Market Size and Forecast
Our Impact
Enabled $4.3B Revenue Impact for Fortune 500 and Leading Multinationals
Partnering with 2000+ Global Organizations Each Year
30K+ Citations by Top-Tier Firms in the Industry
 

Driver Impact Analysis

Driver ~% Impact on CAGR Geographic Relevance Impact Timeline
Clean-label and "healthy" labeling reform ~22% NA, EU Short-term (≤2 yr)
Plant-based protein adoption ~19% Global Medium-term (2–4 yr)
E-commerce and subscription growth ~16% NA, EU, APAC Medium-term
Personalized nutrition platforms ~14% NA, EU Long-term (≥4 yr)
Rising gym memberships in APAC ~12% APAC, LATAM Medium-term
GLP-1 driven high-protein snacking ~10% NA Short-term
Novel protein regulatory approvals ~7% EU, NA Long-term


Clean-Label Reformulation Accelerates Premium Mix

The FDA's December 2024 final rule redefining "healthy" food labeling, effective from February 2025, removed roughly 27% of legacy energy bar SKUs from eligibility for the claim, triggering a 14-month reformulation sprint across the U.S. industry [1]. Brands have substituted dates, monk fruit, and allulose for added sugars, and the average added-sugar content in top-100 SKUs fell from 11g to 7.4g between 2023 and 2025 [2]. This reformulation supports premium pricing of USD 2.49–3.29 per bar versus USD 1.49–1.99 for legacy formats.

Plant-Based Protein Adoption Reshapes Formulation Economics

Between 2022 and 2025, the price of pea protein isolate fell 18% with new capacity from Roquette and Cosucra coming online, reducing the cost differential with whey for plant-based nutrition bar formulas [7]. The Good Food Institute estimates that plant-based snack bars took $1.34 billion globally in 2024, with energy bars the largest sub-segment [2]. Reformulation to pea, rice, and pumpkin seed protein blends improves amino-acid profiles, while meeting vegan and lactose-free claims that attract price premiums in Whole Foods and Sprouts.


E-Commerce Subscriptions Drive Multi-Pack Demand

Subscribe & Save, Amazon’s program, processed an estimated USD 680 million in energy bar volume in 2024, and direct-to-consumer brands such as RXBAR and Built Bar report subscription contribution of more than 35% of digital revenue [9]. The mult-pack channel is the fastest growing, and subscribers commit to 12-24 bar boxes per shipment, which supports both AOV and retention KPIs.


Personalized Nutrition Platforms Open Adjacent Demand

DSM-Firmenich and Bayer have launched DNA-guided nutrition pilots that route consumers toward category-specific recommendations, and energy bars sit in the high-frequency snack tier for 62% of profiled users [6]. Annual spending per enrolled user on functional bars averages USD 184, well above the category mean.


Restraints Impact Analysis

Restraint impact percentages reflect MRFR's directional weighting of negative pressure on Energy Bar Market CAGR; they are illustrative, not subtractive from headline growth.

Restraint ~% Impact on CAGR Geographic Relevance Impact Timeline
Commodity volatility (cocoa, almonds, whey) ~24% Global Short-term
GLP-1 induced caloric demand reduction ~18% NA, EU Medium-term
Private-label competitive intensity ~16% NA, EU Medium-term
Front-of-pack labeling restrictions ~13% EU, LATAM Long-term
Saturated developed-market shelf space ~11% NA, EU Long-term


Commodity Volatility Compresses Gross Margins

Cocoa futures rose 162% between January 2023 and April 2024, peaking above USD 11,000/tonne, while almond prices climbed 38% on California drought conditions [8]. Energy bar makers carry 18–24% commodity exposure in COGS, and hedging programs cover only 40–60% of forward needs, leaving gross margins down 220–310 basis points across leading branded portfolios in 2024.

GLP-1 Adoption Reshapes Snack Consumption

By the middle of 2025, around 12 million US adults were using GLP-1 receptor agonists, and data from household scanners revealed a 9.4% decrease in the frequency of salty and sweet snack purchases in this group [5]. The low sugar meal replacement bar segment has partially offset this drag with a repositioning toward fullness and protein density, but the net effect on category volume in North America is mildly negative.


Private-Label Intensifies Price Pressure

Costco's Kirkland Signature protein bars and Aldi's Millville line have been up around 22% YoY in dollar sales in 2024, while undercutting branded SKUs by 35-45% on a per-bar basis. Branded incumbents are experiencing margin pressure and higher trade promotion spends, especially in the conventional bar segment.


Energy Bar Market Opportunities

Emerging-Market Premiumization

India's organized fitness participation crossed 25 million users by 2025, and Brazil's online supplements channel grew 31% in 2024 Local manufacturing partnerships with Marico and Hexagon Nutrition can deliver protein energy snack bar SKUs at INR 80–120 per bar price points, opening a sub-USD 1 premium tier addressable to roughly 180 million urban consumers across BRICS markets.

Functional Ingredient Stacking

Adaptogens, nootropics, and electrolytes are converging into single-format bars priced at USD 3.49–4.99 Examples include ashwagandha-fortified sports performance energy bar SKUs from Bulletproof and electrolyte-loaded endurance bars from Maurten, opening a USD 420 million addressable opportunity by 2030.

Sustainability-Linked Packaging

EU PPWR rules, effective 2026, require 65% recycled or recyclable packaging by 2030. Futamura and Notpla’s compostable cellulose wrappers create a defensible cost-and-claim moat for premium organic plant-based nutrition bar brands


Data-Driven Subscription Models

Subscription telemetry on consumption cadence and macro preference allows for dynamic SKU rotation. Brands that harness first-party data to monetize personalized box configurations can boost LTV by 28–34% over static subscription baselines


Hospital and Clinical Nutrition Crossover

Therapeutic energy bars for diabetes management and post-operative recovery cleared 14 new clinical evaluations in 2024, opening a regulated adjacent channel worth an estimated USD 280 million by 2030


Energy Bar Market Future Outlook

AI-Driven Personalization Reshapes SKU Architecture

By 2030, an estimated 18% of energy bar revenue in developed markets will flow through personalized subscription configurations, where AI engines route consumers toward macro-aligned SKUs based on wearable and genetic data [6]. DSM-Firmenich, IFF, and Kerry Group are building B2B platforms that let brands inject personalized formulations into existing manufacturing lines without full reformulation cycles, lowering the cost of personalization from USD 0.42 to USD 0.11 per bar.

Platform Economics Reward Vertically Integrated Brands

RXBAR (Kellanova), Built Bar, and Barebells (Vitamin Well) increasingly operate as branded media platforms with proprietary subscription stacks. Vertical brands capture 18–22% EBITDA margins versus 9–12% for retail-dependent peers [9]. The next decade will see consolidation around platforms that own consumer data, manufacturing, and at least one direct channel.

Protein Transition Supercycle

Pea, fava, hemp, and precision-fermented dairy proteins together are expected to displace roughly 28% of legacy whey volume in the Energy Bar Market by 2032 [2][7]. The EU's novel food regulatory approvals for mycoprotein and microbial protein, alongside U.S. GRAS clearances for next-generation sweeteners, will compress the formulation cycle from 18 months to 9–12 months by 2030 [13]. This supports the plant-based nutrition bar category economics.

Sustainability Reporting Becomes Procurement Filter

EFRAG's CSRD reporting mandates and the U.S. SEC's climate disclosure rules push retailers toward Scope 3 transparency. Retailers, including Tesco, Walmart, and Carrefour, have integrated Scope 3 supplier data into category reviews, and brands with disclosed lifecycle assessments win 11–14% more new shelf placements [12]. The natural whole-food energy bar category is uniquely positioned to benefit, given its lower processing footprints.


Energy Bar Market Segmentation

By Product Type

The Energy Bar Market splits into two product structures: conventional and organic.

Sub-Segment Metric Primary Demand Driver
Conventional 74.2% share (2025) Mass retail distribution; private-label scale
Organic 8.10% CAGR (2026–2035) Clean-label premiumization


Conventional bars dominate because they monetize entrenched distribution and benefit from established consumer awareness across PepsiCo, Quaker, and Kellanova portfolios. Organic bars grow fastest as Whole Foods, Sprouts, and European specialty retailers expand certified shelf space, and the price gap with conventional has narrowed to 28% from 47% in 2021.

By Protein Source

The Energy Bar Market's protein architecture is shifting from animal-dominant toward plant-led blends.

Sub-Segment Metric Primary Demand Driver
Plant-Based USD 2.41 Billion (2025) Sustainability; lactose-free positioning
Animal-Based 8.32% CAGR (2026–2035) Whey and collagen functional claims


Plant-based protein leads in revenue due to pea-and-rice blend cost competitiveness and wide vegan claim eligibility. Animal-based formats grow faster on the back of collagen's beauty-from-within positioning and whey's superior leucine profile for sports performance energy bar consumers.

By Function / Application

Sub-Segment Metric Primary Demand Driver
Sports & Endurance 73.9% share (2025) Established athlete and gym demand
Weight Management & Lifestyle 8.68% CAGR GLP-1 adjacent low-sugar meal replacement bar growth
Meal Replacement USD 0.41 Billion (2025) Time-pressed professional demand


Sports and endurance nutrition retains the Energy Bar Market's largest share, sustained by gym retail, race-day distribution, and creator-led DTC brands. Lifestyle and weight-management bars accelerate fastest on the back of low-sugar meal replacement bar reformulation and GLP-1-adjacent positioning.

By Packaging

Sub-Segment Metric Primary Demand Driver
Single-Pack 50.5% share (2025) Convenience store and impulse purchase
Multi-Pack Boxes 8.35% CAGR Subscription and warehouse club volume


By Distribution Channel

Sub-Segment Metric Primary Demand Driver
Supermarkets/Hypermarkets USD 1.76 Billion (2025) Mass distribution depth
Online Retail 9.05% CAGR Subscription and marketplace expansion
Convenience Stores 17.4% share (2025) Impulse and grab-and-go occasion
Specialty Stores USD 0.39 Billion (2025) Premium and clean-label demand


Regional Market Share Analysis

Region Metric Primary Investment Themes
North America 38.6% share (2025) Clean-label reformulation; subscription DTC
Europe USD 1.24 Billion (2025) Organic certification; sustainable packaging
Asia-Pacific 9.42% CAGR (2026–2035) Gym economy; modern trade expansion
South America 6.4% share (2025) E-commerce supplements; sports nutrition
Middle East & Africa USD 0.21 Billion (2025) Halal-certified protein; tourism retail
Total USD 4.38 Billion (2025)


North America

Country Metric Key Driver
United States 84.2% share of region FDA "healthy" labeling reform [1]
Canada USD 0.17 Billion (2025) Health Canada front-of-pack rule [13]
Mexico 7.6% CAGR Modern trade format growth


North America remains the anchor of the Energy Bar Market, supported by the largest installed base of sports performance energy bar SKUs and the deepest retail distribution. The 2025 FDA "healthy" rule and parallel state-level sodium warnings have prompted reformulation across the top 20 brands, with PepsiCo's Quaker, Kellanova, and Mars all announcing portfolio reformulations through 2026 [1]. Canada's mandatory front-of-pack symbol rule, effective January 2026, accelerates similar shifts in the protein energy snack bar segment.

Europe

Country Metric Key Driver
Germany 23.8% share of region Organic retail depth (Alnatura, dm) [10]
United Kingdom USD 0.31 Billion (2025) HFSS regulation reformulation [13]
France 14.1% share of region Pharmacy and parapharmacy channel
Italy 6.5% CAGR Mediterranean ingredient innovation
Spain USD 0.09 Billion (2025) Modern trade premiumization
Nordic Countries 7.2% CAGR Plant-based nutrition bar leadership
Russia 5.1% share of region Domestic protein production
Rest of Europe USD 0.08 Billion (2025) Regional convenience expansion


The UK's HFSS (High Fat, Salt, Sugar) advertising restrictions and Germany's organic retail density create distinct reformulation pathways. Alnatura and dm-drogerie together stock more than 140 natural whole-food energy bar SKUs, and Nestlé's 2024 acquisition of a stake in Health & Happiness deepens European exposure to clean-label formats [10].

Asia-Pacific

Country Metric Key Driver
China 32.4% share of region Tmall and JD.com supplement penetration
India 11.8% CAGR Gym economy; OptimumNutrition local production
Japan USD 0.12 Billion (2025) Convenience store functional aisle
South Korea 8.9% CAGR K-pop fitness lifestyle premium
ASEAN 9.4% share of region Halal-certified plant-based nutrition bar SKUs
Rest of Asia-Pacific USD 0.05 Billion (2025) Modern trade rollout


Asia-Pacific drives the fastest growth in the Energy Bar Market on a structural fitness participation surge. India alone added 4,200 new gyms between 2023 and 2025, and online supplement penetration in China crossed 38% of category sales. Local manufacturing by Yili, Mengniu, and Marico's Saffola Fittify is reducing import dependence and supporting sub-USD 1 unit price points.

South America

Country Metric Key Driver
Brazil 64.5% share of region E-commerce supplements; Growth Supplements [9]
Argentina USD 0.04 Billion (2025) Inflation-driven private label
Rest of South America 6.8% CAGR Chile and Colombia retail modernization


Brazil anchors the regional Energy Bar Market on the back of an aggressive online supplement ecosystem. Growth Supplements and Integralmédica command leading positions in branded protein energy snack bar SKUs, supported by deep social-commerce penetration on Instagram and TikTok [9].

Middle East & Africa

Country Metric Key Driver
Saudi Arabia 28.2% share of region Vision 2030 wellness mandates
UAE USD 0.06 Billion (2025) Tourism, premium retail (Carrefour, Spinneys)
South Africa 7.5% CAGR Pick'n Pay and Dis-Chem channel growth
Egypt 12.4% share of region Local production scale-up
Rest of MEA USD 0.03 Billion (2025) Halal-certified product launches


Saudi Arabia's Vision 2030 wellness initiatives, including the National Sports Strategy, are reshaping the Energy Bar Market across the Gulf. UAE tourism retail and South Africa's pharmacy channel through Clicks and Dis-Chem provide differentiated demand pockets for premium imported brands.

Energy Bar Market By Region, 2025-2035
 

Competitive Benchmarking

The Energy Bar Market is medium-concentrated. The top-five branded players collectively command an estimated 41–46% of global revenue, with a long tail of regional and DTC challengers driving an HHI in the 850–1,050 range. Reformulation pace, ingredient sourcing, and direct-channel ownership are the principal sources of competitive differentiation.

Company Est. Revenue Share Range Key Offerings for Energy Bar Market Strategic Positioning
General Mills (Nature Valley, Larabar) ~10–13% Whole-grain and date-based natural whole-food energy bar lines Retail breadth; clean-label flagship Larabar
Mondelez International (CLIF Bar) ~9–12% CLIF, CLIF Builders, Luna; organic and sports performance energy bar SKUs Organic certification leadership; B-Corp positioning
Kellanova (RXBAR) ~7–10% Egg-white-based RXBAR; whole-food formulations Premium DTC; subscription depth
PepsiCo (Quaker, Gatorade) ~6–9% Quaker bars, Gatorade Recover protein bars Distribution muscle; sports endorsement portfolio
Mars Inc. (KIND) ~6–9% KIND nut-based, KIND Protein, KIND Kids Nut-forward whole-food positioning
Glanbia (Optimum Nutrition) ~4–7% Whey-based sports performance energy bar formats Sports nutrition heritage
Post Holdings (Premier Protein) ~3–6% Premier Protein bars: high-protein meal replacement Mass-channel high-protein leadership
Vitamin Well (Barebells) ~3–5% Barebells protein bars; low-sugar meal replacement bar SKUs European DTC scale
Hormel Foods (Justin's) ~2–4% Nut-butter-based plant-based nutrition bar formats Natural channel anchor
Simply Good Foods (Quest, Atkins) ~3–5% Quest high-protein bars; Atkins low-carb formats Lifestyle and weight-management focus


Recent News & Developments

  • Kellanova (March 2025): Completed roll-out of reformulated RXBAR line with reduced added sugar to comply with the FDA's 2025 "healthy" labeling rule, supporting premium shelf positioning [1].
  • Mondelez International / CLIF Bar (September 2024): Announced USD 145 million investment in Idaho organic bakery, expanding organic protein energy snack bar capacity by 38% [2].
  • General Mills (June 2024): Acquired stake in Whole Foods Market's private-label energy bar supplier, deepening natural-channel exposure [10].
  • Mars Inc. / KIND (January 2025): Launched KIND Protein 18g line with collagen-and-whey blend, targeting the GLP-1 adjacent low-sugar meal replacement bar segment [5].
  • PepsiCo / Gatorade (November 2024): Re-launched Gatorade Recover protein bars with a reformulated electrolyte stack for the sports performance energy bar consumer.
  • Vitamin Well / Barebells (April 2025): Expanded U.S. distribution into 12,400 additional retail doors after Walmart and Kroger national listings [9].
  • Simply Good Foods (October 2024): Closed acquisition of Only What You Need (OWYN) for USD 280 million, adding plant-based nutrition bar capability [2].
  • EU Commission (February 2025): Approved precision-fermented whey as a novel food ingredient, enabling new animal-equivalent vegan formats by Q4 2025 [13].
 

Energy Bar Market Report Scope

Parameter Detail
Market Scope Global Energy Bar Market across product type, protein source, function, packaging, distribution, geography
Study Period 2021–2035
Base Year 2025
Forecast Period 2026–2035
CAGR (2026–2035) 7.95%
Market Size (2025) USD 4.38 Billion
Market Size (2031 checkpoint) USD 6.94 Billion
Market Size (2035) USD 9.21 Billion
Fastest Growing Segment Organic bars; Online retail; Asia-Pacific region
Companies Profiled General Mills, Mondelez, Kellanova, PepsiCo, Mars, Glanbia, Post Holdings, Vitamin Well, Hormel, Simply Good Foods
Valuation Currency USD Billion


FAQs

How should procurement teams structure ingredient hedging exposure when sourcing for the Energy Bar Market?

Best practice covers 55–70% of forward 12-month needs through futures or fixed-price supplier contracts for cocoa, almonds, and whey, leaving 30% spot exposure for cost optimization. Layered hedging windows reduce single-point timing risk [8].

What investment multiples are private functional nutrition brands commanding in current M&A activity?

Branded energy bar acquisitions in 2024–2025 closed at EV/EBITDA multiples of 14–18x, with premium DTC brands reaching 22x. Multiples reflect subscription contribution and clean-label IP.

Which co-manufacturing partners support rapid SKU launches into the Energy Bar Market?

Hearthside Food Solutions, TreeHouse Foods, and SK Food Group operate validated cold-pressed and extrusion lines accepting 50,000-unit minimum runs. Lead times average 9–14 weeks for new SKUs.

How does the EU PPWR packaging directive change supplier selection in the Energy Bar Market?

PPWR requires 65% recyclable packaging by 2030 and bans certain multi-material laminates. Brands should qualify cellulose-based wrappers from Futamura or Notpla within 18 months to maintain EU shelf access [12].

What due diligence flags matter when evaluating a DTC energy bar acquisition target?

Examine subscription churn under 6%, repeat purchase rate above 38%, and first-party data ownership. CAC payback under 11 months and Amazon dependency below 35% signal sustainable economics [9].

How are private-label dynamics shifting in the Energy Bar Market across club channels?

Costco, Sam's Club, and BJ's have grown private-label protein bar sales 22% YoY in 2024 at 35–45% lower per-bar pricing. Branded incumbents must defend through innovation cadence and exclusive functional ingredient claims.

What regulatory pathway applies to novel proteins entering the Energy Bar Market?

In the EU, novel proteins require EFSA novel food approval, averaging 18–24 months; the U.S. uses GRAS self-affirmation with FDA notification. Mycoprotein and precision-fermented whey have cleared approval since 2024 [13].

  • --
Author
Author
Author Profile
Snehal Singh LinkedIn
Manager - Research
High acumen in analyzing complex macro & micro markets with more than 6 years of work experience in the field of market research. By implementing her analytical skills in forecasting and estimation into market research reports, she has expertise in Packaging, Construction, and Equipment domains. She handles a team size of 20-25 resources and ensures smooth running of the projects, associated marketing activities, and client servicing.
Download Free Sample

Kindly complete the form below to receive a free sample of this Report