×
Hero Background
English
Chinese
French
Japanese
Korean
German
Spanish

Enhanced Flight Vision Systems Market Trends

ID: MRFR/AD/4406-HCR
100 Pages
Sejal Akre
October 2025

Enhanced Flight Vision Systems ( EFVS) Market Research Report Information by Technology (Infrared and Synthetic Vision), By Component (Display, Camera, and Sensor), By Platform (Fixed-Wing and Rotary-Wing), And By Region (North America, Europe, Asia-Pacific, And Rest Of The World) –Market Forecast Till 2032

Share:
Download PDF ×

We do not share your information with anyone. However, we may send you emails based on your report interest from time to time. You may contact us at any time to opt-out.

Enhanced Flight Vision Systems Market Infographic
Purchase Options

Market Trends

Key Emerging Trends in the Enhanced Flight Vision Systems Market

The Enhanced Flight Vision Systems (EFVS) market is witnessing transformative trends that are reshaping the aviation industry's approach to flight vision technologies. One prominent trend is the increasing adoption of synthetic vision systems (SVS) and augmented reality displays in EFVS. These advanced technologies provide pilots with a comprehensive and intuitive view of the external environment, combining real-time data with computer-generated imagery. SVS enhances situational awareness in low-visibility conditions, allowing pilots to navigate confidently through challenging weather, terrain, and airport environments. Augmented reality displays overlay critical flight information directly onto the pilot's view, offering a seamless integration of virtual and real-world elements for improved decision-making.

The integration of infrared and thermal imaging sensors is a key trend in the EFVS market. These sensors enable pilots to see beyond the range of human vision, detecting heat signatures and providing enhanced vision in darkness, adverse weather, or other low-visibility scenarios. Infrared and thermal imaging technologies contribute to safer flight operations by detecting obstacles, wildlife, and potential hazards, especially during critical phases such as takeoff and landing. This trend underscores the industry's commitment to enhancing safety and operational capabilities through advanced sensor technologies in EFVS.

Collaboration and integration with other avionics systems are driving trends in the EFVS market. EFVS technologies are increasingly integrated with other on-board systems, such as navigation, autopilot, and terrain awareness warning systems. Collaborative efforts between EFVS providers and avionics manufacturers result in comprehensive solutions that improve overall aircraft functionality and safety. This trend reflects a holistic approach to flight vision, where EFVS is seamlessly integrated into the broader avionics architecture to provide a unified and efficient cockpit experience.

Regulatory advancements and global standardization efforts are significant trends influencing the EFVS market. Aviation authorities worldwide are recognizing the safety benefits of EFVS and are promulgating regulations to encourage its use. Regulatory bodies, such as the Federal Aviation Administration (FAA) and the European Union Aviation Safety Agency (EASA), are establishing standards and guidelines for EFVS implementation. These regulations are driving the adoption of EFVS across different aircraft categories, fostering a consistent and standardized approach to enhanced flight vision systems in the industry.

Cost-effective solutions and the scalability of EFVS technologies are emerging trends in response to the varying needs of different aircraft types and operators. EFVS providers are developing solutions that cater to a broad spectrum of aircraft, from general aviation to commercial and military applications. This trend allows operators to choose EFVS solutions that align with their specific requirements and budgets, fostering a more accessible and diverse market for enhanced flight vision systems.

Technological innovations in lightweight and compact EFVS hardware are shaping the market's trends. Advancements in materials and manufacturing processes are resulting in smaller, lighter, and more energy-efficient EFVS components. These innovations contribute to easier integration into different aircraft models, reduce installation complexity, and address concerns related to weight and power consumption. The trend towards lightweight and compact EFVS solutions supports a broader range of aircraft applications and facilitates retrofitting on existing fleets.

Author
Sejal Akre
Senior Research Analyst

She has over 5 years of rich experience, in market research and consulting providing valuable market insights to client. Hands on expertise in management consulting, and extensive knowledge in domain including ICT, Automotive & Transportation and Aerospace & Defense. She is skilled in Go-to market strategy, industry analysis, market sizing, in depth company profiling, competitive intelligence & benchmarking and value chain amongst others.

Leave a Comment

FAQs

What is the projected market valuation of the Enhanced Flight Vision Systems Market by 2035?

The Enhanced Flight Vision Systems Market is projected to reach a valuation of 0.4504 USD Billion by 2035.

What was the market valuation of the Enhanced Flight Vision Systems Market in 2024?

In 2024, the market valuation of the Enhanced Flight Vision Systems Market was 0.214 USD Billion.

What is the expected CAGR for the Enhanced Flight Vision Systems Market during the forecast period 2025 - 2035?

The expected CAGR for the Enhanced Flight Vision Systems Market during the forecast period 2025 - 2035 is 7.0%.

Which companies are considered key players in the Enhanced Flight Vision Systems Market?

Key players in the Enhanced Flight Vision Systems Market include Honeywell, Thales, Rockwell Collins, L3Harris Technologies, Elbit Systems, Northrop Grumman, General Electric, BAE Systems, and Garmin.

What are the main technology segments within the Enhanced Flight Vision Systems Market?

The main technology segments within the Enhanced Flight Vision Systems Market are Infrared and Synthetic Vision, each projected to grow from 0.107 USD Billion to 0.2252 USD Billion.

What components are included in the Enhanced Flight Vision Systems Market?

The components of the Enhanced Flight Vision Systems Market include Display, Camera, and Sensor, with valuations expected to rise from 0.0857 USD Billion, 0.0712 USD Billion, and 0.0571 USD Billion respectively.

Market Summary

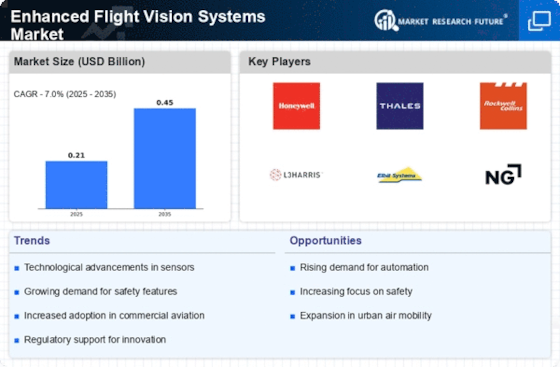
As per MRFR analysis, the Enhanced Flight Vision Systems Market was estimated at 0.214 USD Billion in 2024. The Enhanced Flight Vision Systems industry is projected to grow from 0.229 in 2025 to 0.4504 by 2035, exhibiting a compound annual growth rate (CAGR) of 7.0 during the forecast period 2025 - 2035.

Key Market Trends & Highlights

The Enhanced Flight Vision Systems Market is poised for substantial growth driven by technological advancements and regulatory support.

  • North America remains the largest market for Enhanced Flight Vision Systems Market, driven by high demand for advanced aviation technologies.
  • The Asia-Pacific region is emerging as the fastest-growing market, reflecting increasing investments in aviation infrastructure and modernization.
  • Infrared systems dominate the market, while synthetic vision systems are rapidly gaining traction due to their innovative capabilities.
  • Key market drivers include technological advancements and regulatory support, which are fostering a focus on safety and automation in aviation.

Market Size & Forecast

2024 Market Size 0.214 (USD Billion)
2035 Market Size 0.4504 (USD Billion)
CAGR (2025 - 2035) 7.0%
Largest Regional Market Share in 2024 North America

Major Players

<p>Honeywell (US), Thales (FR), Rockwell Collins (US), L3Harris Technologies (US), Elbit Systems (IL), Northrop Grumman (US), General Electric (US), BAE Systems (GB), Garmin (US)</p>

Market Trends

The Enhanced Flight Vision Systems Market is currently experiencing a notable transformation, driven by advancements in technology and increasing demand for safety in aviation. Enhanced Flight Vision Systems Market, which utilize advanced sensors and imaging technologies, are becoming integral to modern aircraft. These systems enhance pilots' situational awareness, particularly in low-visibility conditions, thereby improving overall flight safety. As regulatory bodies emphasize the importance of safety measures, the adoption of these systems is likely to rise, reflecting a broader trend towards automation and enhanced operational efficiency in aviation. Moreover, the market appears to be influenced by the growing emphasis on reducing operational costs and improving fuel efficiency. Airlines and operators are increasingly recognizing the potential of Enhanced Flight Vision Systems Market to optimize flight paths and reduce delays. This trend suggests a shift towards more sustainable aviation practices, as these systems can contribute to lower fuel consumption and emissions. As the aviation industry continues to evolve, the Enhanced Flight Vision Systems Market is poised for growth, driven by technological innovation and a commitment to safety and efficiency in air travel.

Technological Advancements

The Enhanced Flight Vision Systems Market is witnessing rapid technological advancements, particularly in sensor and imaging technologies. Innovations in infrared and multi-spectral imaging are enhancing the capabilities of these systems, allowing for improved visibility in challenging weather conditions. This trend indicates a shift towards more sophisticated systems that can provide real-time data to pilots, thereby enhancing decision-making processes.

Regulatory Support

Regulatory bodies are increasingly supporting the integration of Enhanced Flight Vision Systems Market into commercial aviation. This support is manifested through updated guidelines and standards that encourage the adoption of these systems. Such regulatory backing suggests a growing recognition of the importance of safety and situational awareness in aviation, potentially leading to wider acceptance and implementation across the industry.

Focus on Sustainability

There is a notable focus on sustainability within the Enhanced Flight Vision Systems Market, as operators seek to reduce their environmental impact. Enhanced Flight Vision Systems Market can contribute to more efficient flight operations, which may lead to lower fuel consumption and reduced emissions. This trend reflects a broader commitment within the aviation sector to adopt practices that align with environmental sustainability goals.

Enhanced Flight Vision Systems Market Market Drivers

Focus on Safety

The focus on safety within the aviation sector is a primary driver for the Enhanced Flight Vision Systems Market. As air travel continues to grow, the demand for systems that enhance safety and reduce the risk of accidents is paramount. Enhanced flight vision systems provide critical information to pilots, enabling them to make informed decisions during challenging flight conditions. Recent statistics indicate that the implementation of these systems has contributed to a reduction in accident rates, thereby reinforcing their value in the industry. Airlines and operators are increasingly investing in these technologies to ensure compliance with safety standards and to enhance passenger confidence. This heightened focus on safety is likely to propel the Enhanced Flight Vision Systems Market forward, as stakeholders prioritize investments in systems that can demonstrably improve operational safety.

Regulatory Support

Regulatory support plays a crucial role in the growth of the Enhanced Flight Vision Systems Market. Various aviation authorities are increasingly recognizing the importance of enhanced flight vision systems in improving safety and operational efficiency. For instance, regulations that mandate the use of advanced vision systems in commercial aircraft are becoming more prevalent. This regulatory push is expected to drive market growth, as manufacturers and operators seek to comply with these new standards. Furthermore, the Federal Aviation Administration (FAA) and the European Union Aviation Safety Agency (EASA) have been actively promoting the adoption of these systems, which could lead to a significant increase in market penetration. The Enhanced Flight Vision Systems Market is thus positioned to benefit from this supportive regulatory environment, which may facilitate the introduction of innovative products and technologies.

Technological Advancements

The Enhanced Flight Vision Systems Market is experiencing a surge in technological advancements that are reshaping aviation safety and efficiency. Innovations such as improved sensor technologies, advanced image processing algorithms, and integration with artificial intelligence are enhancing the capabilities of flight vision systems. These advancements allow pilots to have better situational awareness, particularly in low-visibility conditions. According to recent data, the market for enhanced flight vision systems is projected to grow at a compound annual growth rate of approximately 10% over the next five years. This growth is driven by the increasing demand for safer and more efficient flight operations, as well as the need for compliance with stringent aviation regulations. As technology continues to evolve, the Enhanced Flight Vision Systems Market is likely to see further enhancements that could redefine operational standards.

Market Demand for Automation

The growing demand for automation in aviation is significantly influencing the Enhanced Flight Vision Systems Market. As airlines and operators seek to streamline operations and reduce human error, the integration of automated systems is becoming increasingly prevalent. Enhanced flight vision systems are at the forefront of this trend, providing pilots with automated visual information that aids in navigation and decision-making. The market is projected to expand as more operators recognize the benefits of these systems in enhancing operational efficiency and safety. Furthermore, advancements in automation technologies are likely to lead to the development of more sophisticated flight vision systems, which could further stimulate market growth. The Enhanced Flight Vision Systems Market is thus poised to capitalize on this trend, as the aviation sector increasingly embraces automation as a means to improve performance.

Investment in Research and Development

Investment in research and development is a key driver for the Enhanced Flight Vision Systems Market. As competition intensifies among manufacturers, there is a growing emphasis on innovation and the development of next-generation flight vision systems. Companies are allocating substantial resources to R&D initiatives aimed at enhancing the functionality and reliability of these systems. This focus on innovation is expected to yield advanced technologies that can address emerging challenges in aviation, such as increased air traffic and the need for improved situational awareness. Moreover, partnerships between industry stakeholders and research institutions are fostering the development of cutting-edge solutions. The Enhanced Flight Vision Systems Market stands to benefit from these investments, as new technologies are likely to enhance product offerings and meet the evolving needs of the aviation sector.

Market Segment Insights

Enhanced Flight Vision Systems Market Technology Insights

<p>The enhanced flight vision market segmentation based on technology includes infrared and synthetic vision. The infrared segment dominated the market, and Safety in almost all flight phases is improved, particularly during approach and landing in poor visibility. A pilot can identify the runway environment (lights, runway markings, etc.) while making a stabilized approach (before the touchdown) has enhanced the Enhanced Flight Vision Systems Market (EFVS) market CAGR ly in recent years.</p>

Enhanced Flight Vision Systems Market Component Insights

<p>Based on components, the enhanced flight vision market segmentation includes display, camera, and sensor. The display segment held the majority share in 2022 concerning the Enhanced Flight Vision Systems Market revenue. A crucial component of the improved vision systems is a display unit, which offers a screen for a graphical representation of data gathered from various sensors onboard an aircraft. This is one of the main factors boosting this market's expansion.</p>

<p>Figure 1 Enhanced Flight Vision Systems Market by Component, 2022 &amp; 2030 (USD billion)</p>

<p>Source Secondary Research, Primary Research, Market Research Future Database and Analyst Review</p>

Enhanced Flight Vision Systems Market Platform Insights

<p>Enhanced Flight Vision Systems Market Platform Insights</p>

<p>Based on the platform, the EFVS market data includes fixed-wing and rotary-wing. The fixed-wing category generated the most income. The brightest and highest resolution HUD for commercial aircraft is included and has a broad field of view.</p>

<p>For best control, the user can switch between the two areas of the split screen display's pilot-friendly background imagery. Take advantage of low visibility situations and extreme weather conditions, both day and night, with the Clear Vision system implants for Enhanced Flight Vision Systems Market, positively impacting the market growth.</p>

Get more detailed insights about Enhanced Flight Vision Systems Market Research Report – Forecast to 2035

Regional Insights

North America : Aerospace Innovation Leader

North America is the largest market for Enhanced Flight Vision Systems Market, holding approximately 45% of the global share. The region benefits from robust demand driven by advancements in aviation technology, increasing air traffic, and stringent safety regulations. Regulatory bodies like the FAA are pivotal in promoting the adoption of these systems, ensuring compliance with safety standards and enhancing operational efficiency. The United States leads the market, with key players such as Honeywell, Rockwell Collins, and L3Harris Technologies driving innovation. The competitive landscape is characterized by significant investments in R&D and strategic partnerships. Canada also plays a vital role, contributing to the market with its growing aerospace sector and regulatory support for advanced flight technologies.

Europe : Regulatory Framework and Growth

Europe is the second-largest market for Enhanced Flight Vision Systems Market, accounting for around 30% of the global market share. The region's growth is fueled by increasing safety regulations from the European Union Aviation Safety Agency (EASA) and a rising focus on enhancing passenger safety. The demand for advanced flight technologies is also driven by the growing number of commercial flights and the need for improved situational awareness in adverse weather conditions. Leading countries in this region include France, Germany, and the UK, with major players like Thales and BAE Systems contributing to market growth. The competitive landscape is marked by collaborations between manufacturers and airlines to integrate advanced systems into new aircraft. The presence of established aerospace companies ensures a steady supply of innovative solutions to meet regulatory requirements and market demands.

Asia-Pacific : Rapidly Growing Aviation Sector

Asia-Pacific is witnessing rapid growth in the Enhanced Flight Vision Systems Market, holding approximately 20% of the global share. The region's expansion is driven by increasing air travel demand, rising investments in aviation infrastructure, and supportive government policies aimed at enhancing aviation safety. Countries like China and India are leading this growth, with significant increases in their commercial aviation sectors and regulatory frameworks promoting advanced flight technologies. China is the largest market in the region, with a burgeoning aerospace industry and a focus on modernizing its fleet. Key players such as Garmin and Elbit Systems are actively participating in this market, providing innovative solutions tailored to regional needs. The competitive landscape is evolving, with local manufacturers emerging alongside established global players, fostering a dynamic environment for technological advancements.

Middle East and Africa : Strategic Growth in Aviation

The Middle East and Africa region is emerging as a significant market for Enhanced Flight Vision Systems Market, accounting for about 5% of the global share. The growth is primarily driven by increasing investments in aviation infrastructure, particularly in the Gulf Cooperation Council (GCC) countries, and a rising focus on enhancing safety standards in aviation. The region's strategic location as a global aviation hub further supports the demand for advanced flight technologies. Countries like the UAE and South Africa are at the forefront of this growth, with major airlines investing in modernizing their fleets. The competitive landscape includes both international and local players, with companies like Northrop Grumman and local manufacturers collaborating to meet the growing demand. The region's commitment to improving aviation safety and efficiency is evident in its regulatory initiatives and partnerships with global aviation authorities.

Key Players and Competitive Insights

Leading market players are investing heavily in research and development to expand their product lines, which will help the Enhanced Flight Vision Systems Market grow even more. Market participants are also undertaking various strategic activities to expand their footprint, with important market developments including new product launches, contractual agreements, mergers and acquisitions, higher investments, and collaboration with other organizations. To expand and survive in a more competitive and rising market climate, the Enhanced Flight Vision Systems industry must offer cost-effective items.

Manufacturing locally to minimize operational costs is one of the key business tactics manufacturers use in the Enhanced Flight Vision Systems industry to benefit clients and increase the market sector. The Enhanced Flight Vision Systems industry has recently offered some of the most significant medical advantages. Major players in the Enhanced Flight Vision Systems Market, including Honeywell International, Inc. (U.S.), United Technologies Corporation (U.S.), L-3 Communications Holdings, Inc. (U.S.), Thales Group (France), and Elbit Systems Ltd. (Israel). and others, are attempting to increase market demand by investing in research and development operations.

United Technologies Corporation (U.S.) is an American multinational corporation with its main office in Farmington, Connecticut. It researched, developed, and produced goods in various industries, including industrial goods, HVAC, elevators, and escalators, and products for aircraft engines, aerospace systems, and other uses. With the U.S. contributing about 10% of its revenue, UTC was also a sizable military contractor. S. government. Gregg J. Hayes served as both CEO and chairman.

L-3 Communications Holdings specializes in government services, aircraft maintenance and modernization, and C3ISR (command, control, communications, intelligence, surveillance, and reconnaissance) systems. The company also sells electronic systems for use on commercial and military platforms. The DoD, DHS, DoS, DoJ, and other organizations are some of L-3's clients.

Key Companies in the Enhanced Flight Vision Systems Market market include

Industry Developments

For instance, August 2021 Opgal, a pioneer in thermal imaging technology, announced today that it has entered into a new agreement with Elbit Systems of America, LLC, for the design and construction of numerous sophisticated EVS (Enhanced Vision System) units. The next-generation EVS from Elbit Systems of America will incorporate Opgal's cutting-edge thermal imaging and optics technology into the newly improved designed systems.

For instance, September 2022The new Enhanced Flight Vision System (EFVS) for Boeing 737 aircraft will be installed by Collins Aerospace in July 2021. Texel Air, which operates from Bahrain International Airport, will be one of the first users of the new system incorporating Collins' EVS-3600 multi-spectral imaging sensor.

For instance, January 2021 Two letters that Honeywell NASDAQ has signed will help the company's relationships with stakeholders in Malaysia and the surrounding area and its presence there. Since Honeywell has separate MOUs with Airod Techno Power (ATP) and Galaxy Aerospace, the collaboration aims to take advantage of Honeywell's expertise in the MRO of aircraft in various dimensions.

Future Outlook

Enhanced Flight Vision Systems Market Future Outlook

<p>The Enhanced Flight Vision Systems Market is projected to grow at a 7.0% CAGR from 2024 to 2035, driven by technological advancements, regulatory support, and increasing demand for safety features.</p>

New opportunities lie in:

  • <p>Development of AI-driven predictive maintenance solutions</p>
  • <p>Integration of augmented reality for pilot training</p>
  • <p>Expansion into emerging markets with tailored solutions</p>

<p>By 2035, the market is expected to achieve substantial growth, solidifying its role in aviation safety and efficiency.</p>

Market Segmentation

Enhanced Flight Vision Systems Market Platform Outlook

  • Fixed-Wing
  • Rotary-Wing

Enhanced Flight Vision Systems Market Component Outlook

  • Display
  • Camera
  • Sensor

Enhanced Flight Vision Systems Market Technology Outlook

  • Infrared
  • Synthetic Vision

Report Scope

MARKET SIZE 20240.214(USD Billion)
MARKET SIZE 20250.229(USD Billion)
MARKET SIZE 20350.4504(USD Billion)
COMPOUND ANNUAL GROWTH RATE (CAGR)7.0% (2024 - 2035)
REPORT COVERAGERevenue Forecast, Competitive Landscape, Growth Factors, and Trends
BASE YEAR2024
Market Forecast Period2025 - 2035
Historical Data2019 - 2024
Market Forecast UnitsUSD Billion
Key Companies ProfiledMarket analysis in progress
Segments CoveredMarket segmentation analysis in progress
Key Market OpportunitiesIntegration of artificial intelligence enhances situational awareness in the Enhanced Flight Vision Systems Market.
Key Market DynamicsTechnological advancements and regulatory changes drive demand for Enhanced Flight Vision Systems in aviation safety and efficiency.
Countries CoveredNorth America, Europe, APAC, South America, MEA

FAQs

What is the projected market valuation of the Enhanced Flight Vision Systems Market by 2035?

The Enhanced Flight Vision Systems Market is projected to reach a valuation of 0.4504 USD Billion by 2035.

What was the market valuation of the Enhanced Flight Vision Systems Market in 2024?

In 2024, the market valuation of the Enhanced Flight Vision Systems Market was 0.214 USD Billion.

What is the expected CAGR for the Enhanced Flight Vision Systems Market during the forecast period 2025 - 2035?

The expected CAGR for the Enhanced Flight Vision Systems Market during the forecast period 2025 - 2035 is 7.0%.

Which companies are considered key players in the Enhanced Flight Vision Systems Market?

Key players in the Enhanced Flight Vision Systems Market include Honeywell, Thales, Rockwell Collins, L3Harris Technologies, Elbit Systems, Northrop Grumman, General Electric, BAE Systems, and Garmin.

What are the main technology segments within the Enhanced Flight Vision Systems Market?

The main technology segments within the Enhanced Flight Vision Systems Market are Infrared and Synthetic Vision, each projected to grow from 0.107 USD Billion to 0.2252 USD Billion.

What components are included in the Enhanced Flight Vision Systems Market?

The components of the Enhanced Flight Vision Systems Market include Display, Camera, and Sensor, with valuations expected to rise from 0.0857 USD Billion, 0.0712 USD Billion, and 0.0571 USD Billion respectively.

  1. SECTION I: EXECUTIVE SUMMARY AND KEY HIGHLIGHTS
    1. EXECUTIVE SUMMARY
      1. Market Overview
      2. Key Findings
      3. Market Segmentation
      4. Competitive Landscape
      5. Challenges and Opportunities
      6. Future Outlook
  2. SECTION II: SCOPING, METHODOLOGY AND MARKET STRUCTURE
    1. MARKET INTRODUCTION
      1. Definition
      2. Scope of the study
    2. RESEARCH METHODOLOGY
      1. Overview
      2. Data Mining
      3. Secondary Research
      4. Primary Research
      5. Forecasting Model
      6. Market Size Estimation
      7. Data Triangulation
      8. Validation
  3. SECTION III: QUALITATIVE ANALYSIS
    1. MARKET DYNAMICS
      1. Overview
      2. Drivers
      3. Restraints
      4. Opportunities
    2. MARKET FACTOR ANALYSIS
      1. Value chain Analysis
      2. Porter's Five Forces Analysis
      3. COVID-19 Impact Analysis
  4. SECTION IV: QUANTITATIVE ANALYSIS
    1. Aerospace & Defense, BY Technology (USD Billion)
      1. Infrared
      2. Synthetic Vision
    2. Aerospace & Defense, BY Component (USD Billion)
      1. Display
      2. Camera
      3. Sensor
    3. Aerospace & Defense, BY Platform (USD Billion)
      1. Fixed-Wing
      2. Rotary-Wing
    4. Aerospace & Defense, BY Region (USD Billion)
      1. North America
      2. Europe
      3. APAC
      4. South America
      5. MEA
  5. SECTION V: COMPETITIVE ANALYSIS
    1. Competitive Landscape
      1. Overview
      2. Competitive Analysis
      3. Market share Analysis
      4. Major Growth Strategy in the Aerospace & Defense
      5. Competitive Benchmarking
      6. Leading Players in Terms of Number of Developments in the Aerospace & Defense
      7. Key developments and growth strategies
      8. Major Players Financial Matrix
    2. Company Profiles
      1. Honeywell (US)
      2. Thales (FR)
      3. Rockwell Collins (US)
      4. L3Harris Technologies (US)
      5. Elbit Systems (IL)
      6. Northrop Grumman (US)
      7. General Electric (US)
      8. BAE Systems (GB)
      9. Garmin (US)
    3. Appendix
      1. References
      2. Related Reports
  6. LIST OF FIGURES
    1. MARKET SYNOPSIS
    2. NORTH AMERICA MARKET ANALYSIS
    3. US MARKET ANALYSIS BY TECHNOLOGY
    4. US MARKET ANALYSIS BY COMPONENT
    5. US MARKET ANALYSIS BY PLATFORM
    6. CANADA MARKET ANALYSIS BY TECHNOLOGY
    7. CANADA MARKET ANALYSIS BY COMPONENT
    8. CANADA MARKET ANALYSIS BY PLATFORM
    9. EUROPE MARKET ANALYSIS
    10. GERMANY MARKET ANALYSIS BY TECHNOLOGY
    11. GERMANY MARKET ANALYSIS BY COMPONENT
    12. GERMANY MARKET ANALYSIS BY PLATFORM
    13. UK MARKET ANALYSIS BY TECHNOLOGY
    14. UK MARKET ANALYSIS BY COMPONENT
    15. UK MARKET ANALYSIS BY PLATFORM
    16. FRANCE MARKET ANALYSIS BY TECHNOLOGY
    17. FRANCE MARKET ANALYSIS BY COMPONENT
    18. FRANCE MARKET ANALYSIS BY PLATFORM
    19. RUSSIA MARKET ANALYSIS BY TECHNOLOGY
    20. RUSSIA MARKET ANALYSIS BY COMPONENT
    21. RUSSIA MARKET ANALYSIS BY PLATFORM
    22. ITALY MARKET ANALYSIS BY TECHNOLOGY
    23. ITALY MARKET ANALYSIS BY COMPONENT
    24. ITALY MARKET ANALYSIS BY PLATFORM
    25. SPAIN MARKET ANALYSIS BY TECHNOLOGY
    26. SPAIN MARKET ANALYSIS BY COMPONENT
    27. SPAIN MARKET ANALYSIS BY PLATFORM
    28. REST OF EUROPE MARKET ANALYSIS BY TECHNOLOGY
    29. REST OF EUROPE MARKET ANALYSIS BY COMPONENT
    30. REST OF EUROPE MARKET ANALYSIS BY PLATFORM
    31. APAC MARKET ANALYSIS
    32. CHINA MARKET ANALYSIS BY TECHNOLOGY
    33. CHINA MARKET ANALYSIS BY COMPONENT
    34. CHINA MARKET ANALYSIS BY PLATFORM
    35. INDIA MARKET ANALYSIS BY TECHNOLOGY
    36. INDIA MARKET ANALYSIS BY COMPONENT
    37. INDIA MARKET ANALYSIS BY PLATFORM
    38. JAPAN MARKET ANALYSIS BY TECHNOLOGY
    39. JAPAN MARKET ANALYSIS BY COMPONENT
    40. JAPAN MARKET ANALYSIS BY PLATFORM
    41. SOUTH KOREA MARKET ANALYSIS BY TECHNOLOGY
    42. SOUTH KOREA MARKET ANALYSIS BY COMPONENT
    43. SOUTH KOREA MARKET ANALYSIS BY PLATFORM
    44. MALAYSIA MARKET ANALYSIS BY TECHNOLOGY
    45. MALAYSIA MARKET ANALYSIS BY COMPONENT
    46. MALAYSIA MARKET ANALYSIS BY PLATFORM
    47. THAILAND MARKET ANALYSIS BY TECHNOLOGY
    48. THAILAND MARKET ANALYSIS BY COMPONENT
    49. THAILAND MARKET ANALYSIS BY PLATFORM
    50. INDONESIA MARKET ANALYSIS BY TECHNOLOGY
    51. INDONESIA MARKET ANALYSIS BY COMPONENT
    52. INDONESIA MARKET ANALYSIS BY PLATFORM
    53. REST OF APAC MARKET ANALYSIS BY TECHNOLOGY
    54. REST OF APAC MARKET ANALYSIS BY COMPONENT
    55. REST OF APAC MARKET ANALYSIS BY PLATFORM
    56. SOUTH AMERICA MARKET ANALYSIS
    57. BRAZIL MARKET ANALYSIS BY TECHNOLOGY
    58. BRAZIL MARKET ANALYSIS BY COMPONENT
    59. BRAZIL MARKET ANALYSIS BY PLATFORM
    60. MEXICO MARKET ANALYSIS BY TECHNOLOGY
    61. MEXICO MARKET ANALYSIS BY COMPONENT
    62. MEXICO MARKET ANALYSIS BY PLATFORM
    63. ARGENTINA MARKET ANALYSIS BY TECHNOLOGY
    64. ARGENTINA MARKET ANALYSIS BY COMPONENT
    65. ARGENTINA MARKET ANALYSIS BY PLATFORM
    66. REST OF SOUTH AMERICA MARKET ANALYSIS BY TECHNOLOGY
    67. REST OF SOUTH AMERICA MARKET ANALYSIS BY COMPONENT
    68. REST OF SOUTH AMERICA MARKET ANALYSIS BY PLATFORM
    69. MEA MARKET ANALYSIS
    70. GCC COUNTRIES MARKET ANALYSIS BY TECHNOLOGY
    71. GCC COUNTRIES MARKET ANALYSIS BY COMPONENT
    72. GCC COUNTRIES MARKET ANALYSIS BY PLATFORM
    73. SOUTH AFRICA MARKET ANALYSIS BY TECHNOLOGY
    74. SOUTH AFRICA MARKET ANALYSIS BY COMPONENT
    75. SOUTH AFRICA MARKET ANALYSIS BY PLATFORM
    76. REST OF MEA MARKET ANALYSIS BY TECHNOLOGY
    77. REST OF MEA MARKET ANALYSIS BY COMPONENT
    78. REST OF MEA MARKET ANALYSIS BY PLATFORM
    79. KEY BUYING CRITERIA OF AEROSPACE & DEFENSE
    80. RESEARCH PROCESS OF MRFR
    81. DRO ANALYSIS OF AEROSPACE & DEFENSE
    82. DRIVERS IMPACT ANALYSIS: AEROSPACE & DEFENSE
    83. RESTRAINTS IMPACT ANALYSIS: AEROSPACE & DEFENSE
    84. SUPPLY / VALUE CHAIN: AEROSPACE & DEFENSE
    85. AEROSPACE & DEFENSE, BY TECHNOLOGY, 2024 (% SHARE)
    86. AEROSPACE & DEFENSE, BY TECHNOLOGY, 2024 TO 2035 (USD Billion)
    87. AEROSPACE & DEFENSE, BY COMPONENT, 2024 (% SHARE)
    88. AEROSPACE & DEFENSE, BY COMPONENT, 2024 TO 2035 (USD Billion)
    89. AEROSPACE & DEFENSE, BY PLATFORM, 2024 (% SHARE)
    90. AEROSPACE & DEFENSE, BY PLATFORM, 2024 TO 2035 (USD Billion)
    91. BENCHMARKING OF MAJOR COMPETITORS
  7. LIST OF TABLES
    1. LIST OF ASSUMPTIONS
    2. North America MARKET SIZE ESTIMATES; FORECAST
      1. BY TECHNOLOGY, 2025-2035 (USD Billion)
      2. BY COMPONENT, 2025-2035 (USD Billion)
      3. BY PLATFORM, 2025-2035 (USD Billion)
    3. US MARKET SIZE ESTIMATES; FORECAST
      1. BY TECHNOLOGY, 2025-2035 (USD Billion)
      2. BY COMPONENT, 2025-2035 (USD Billion)
      3. BY PLATFORM, 2025-2035 (USD Billion)
    4. Canada MARKET SIZE ESTIMATES; FORECAST
      1. BY TECHNOLOGY, 2025-2035 (USD Billion)
      2. BY COMPONENT, 2025-2035 (USD Billion)
      3. BY PLATFORM, 2025-2035 (USD Billion)
    5. Europe MARKET SIZE ESTIMATES; FORECAST
      1. BY TECHNOLOGY, 2025-2035 (USD Billion)
      2. BY COMPONENT, 2025-2035 (USD Billion)
      3. BY PLATFORM, 2025-2035 (USD Billion)
    6. Germany MARKET SIZE ESTIMATES; FORECAST
      1. BY TECHNOLOGY, 2025-2035 (USD Billion)
      2. BY COMPONENT, 2025-2035 (USD Billion)
      3. BY PLATFORM, 2025-2035 (USD Billion)
    7. UK MARKET SIZE ESTIMATES; FORECAST
      1. BY TECHNOLOGY, 2025-2035 (USD Billion)
      2. BY COMPONENT, 2025-2035 (USD Billion)
      3. BY PLATFORM, 2025-2035 (USD Billion)
    8. France MARKET SIZE ESTIMATES; FORECAST
      1. BY TECHNOLOGY, 2025-2035 (USD Billion)
      2. BY COMPONENT, 2025-2035 (USD Billion)
      3. BY PLATFORM, 2025-2035 (USD Billion)
    9. Russia MARKET SIZE ESTIMATES; FORECAST
      1. BY TECHNOLOGY, 2025-2035 (USD Billion)
      2. BY COMPONENT, 2025-2035 (USD Billion)
      3. BY PLATFORM, 2025-2035 (USD Billion)
    10. Italy MARKET SIZE ESTIMATES; FORECAST
      1. BY TECHNOLOGY, 2025-2035 (USD Billion)
      2. BY COMPONENT, 2025-2035 (USD Billion)
      3. BY PLATFORM, 2025-2035 (USD Billion)
    11. Spain MARKET SIZE ESTIMATES; FORECAST
      1. BY TECHNOLOGY, 2025-2035 (USD Billion)
      2. BY COMPONENT, 2025-2035 (USD Billion)
      3. BY PLATFORM, 2025-2035 (USD Billion)
    12. Rest of Europe MARKET SIZE ESTIMATES; FORECAST
      1. BY TECHNOLOGY, 2025-2035 (USD Billion)
      2. BY COMPONENT, 2025-2035 (USD Billion)
      3. BY PLATFORM, 2025-2035 (USD Billion)
    13. APAC MARKET SIZE ESTIMATES; FORECAST
      1. BY TECHNOLOGY, 2025-2035 (USD Billion)
      2. BY COMPONENT, 2025-2035 (USD Billion)
      3. BY PLATFORM, 2025-2035 (USD Billion)
    14. China MARKET SIZE ESTIMATES; FORECAST
      1. BY TECHNOLOGY, 2025-2035 (USD Billion)
      2. BY COMPONENT, 2025-2035 (USD Billion)
      3. BY PLATFORM, 2025-2035 (USD Billion)
    15. India MARKET SIZE ESTIMATES; FORECAST
      1. BY TECHNOLOGY, 2025-2035 (USD Billion)
      2. BY COMPONENT, 2025-2035 (USD Billion)
      3. BY PLATFORM, 2025-2035 (USD Billion)
    16. Japan MARKET SIZE ESTIMATES; FORECAST
      1. BY TECHNOLOGY, 2025-2035 (USD Billion)
      2. BY COMPONENT, 2025-2035 (USD Billion)
      3. BY PLATFORM, 2025-2035 (USD Billion)
    17. South Korea MARKET SIZE ESTIMATES; FORECAST
      1. BY TECHNOLOGY, 2025-2035 (USD Billion)
      2. BY COMPONENT, 2025-2035 (USD Billion)
      3. BY PLATFORM, 2025-2035 (USD Billion)
    18. Malaysia MARKET SIZE ESTIMATES; FORECAST
      1. BY TECHNOLOGY, 2025-2035 (USD Billion)
      2. BY COMPONENT, 2025-2035 (USD Billion)
      3. BY PLATFORM, 2025-2035 (USD Billion)
    19. Thailand MARKET SIZE ESTIMATES; FORECAST
      1. BY TECHNOLOGY, 2025-2035 (USD Billion)
      2. BY COMPONENT, 2025-2035 (USD Billion)
      3. BY PLATFORM, 2025-2035 (USD Billion)
    20. Indonesia MARKET SIZE ESTIMATES; FORECAST
      1. BY TECHNOLOGY, 2025-2035 (USD Billion)
      2. BY COMPONENT, 2025-2035 (USD Billion)
      3. BY PLATFORM, 2025-2035 (USD Billion)
    21. Rest of APAC MARKET SIZE ESTIMATES; FORECAST
      1. BY TECHNOLOGY, 2025-2035 (USD Billion)
      2. BY COMPONENT, 2025-2035 (USD Billion)
      3. BY PLATFORM, 2025-2035 (USD Billion)
    22. South America MARKET SIZE ESTIMATES; FORECAST
      1. BY TECHNOLOGY, 2025-2035 (USD Billion)
      2. BY COMPONENT, 2025-2035 (USD Billion)
      3. BY PLATFORM, 2025-2035 (USD Billion)
    23. Brazil MARKET SIZE ESTIMATES; FORECAST
      1. BY TECHNOLOGY, 2025-2035 (USD Billion)
      2. BY COMPONENT, 2025-2035 (USD Billion)
      3. BY PLATFORM, 2025-2035 (USD Billion)
    24. Mexico MARKET SIZE ESTIMATES; FORECAST
      1. BY TECHNOLOGY, 2025-2035 (USD Billion)
      2. BY COMPONENT, 2025-2035 (USD Billion)
      3. BY PLATFORM, 2025-2035 (USD Billion)
    25. Argentina MARKET SIZE ESTIMATES; FORECAST
      1. BY TECHNOLOGY, 2025-2035 (USD Billion)
      2. BY COMPONENT, 2025-2035 (USD Billion)
      3. BY PLATFORM, 2025-2035 (USD Billion)
    26. Rest of South America MARKET SIZE ESTIMATES; FORECAST
      1. BY TECHNOLOGY, 2025-2035 (USD Billion)
      2. BY COMPONENT, 2025-2035 (USD Billion)
      3. BY PLATFORM, 2025-2035 (USD Billion)
    27. MEA MARKET SIZE ESTIMATES; FORECAST
      1. BY TECHNOLOGY, 2025-2035 (USD Billion)
      2. BY COMPONENT, 2025-2035 (USD Billion)
      3. BY PLATFORM, 2025-2035 (USD Billion)
    28. GCC Countries MARKET SIZE ESTIMATES; FORECAST
      1. BY TECHNOLOGY, 2025-2035 (USD Billion)
      2. BY COMPONENT, 2025-2035 (USD Billion)
      3. BY PLATFORM, 2025-2035 (USD Billion)
    29. South Africa MARKET SIZE ESTIMATES; FORECAST
      1. BY TECHNOLOGY, 2025-2035 (USD Billion)
      2. BY COMPONENT, 2025-2035 (USD Billion)
      3. BY PLATFORM, 2025-2035 (USD Billion)
    30. Rest of MEA MARKET SIZE ESTIMATES; FORECAST
      1. BY TECHNOLOGY, 2025-2035 (USD Billion)
      2. BY COMPONENT, 2025-2035 (USD Billion)
      3. BY PLATFORM, 2025-2035 (USD Billion)
    31. PRODUCT LAUNCH/PRODUCT DEVELOPMENT/APPROVAL
    32. ACQUISITION/PARTNERSHIP

Enhanced Flight Vision Systems Market Segmentation

Enhanced Flight Vision Systems Technology Outlook (USD Billion, 2019-2030)

  • Infrared
  • Synthetic Vision

Enhanced Flight Vision Systems Component Outlook (USD Billion, 2019-2030)

  • Display
  • Camera
  • Sensor

Enhanced Flight Vision Systems Platform Outlook (USD Billion, 2019-2030)

  • Fixed-Wing
  • Rotary-Wing

Enhanced Flight Vision Systems Regional Outlook (USD Billion, 2019-2030)

  • North America Outlook (USD Billion, 2019-2030)
    • North America Enhanced Flight Vision Systems by Technology
      • Infrared
      • Synthetic Vision
    • North America Enhanced Flight Vision Systems by Component
      • Display
      • Camera
      • Sensor
    • North America Enhanced Flight Vision Systems by Platform
      • Fixed-Wing
      • Rotary-Wing
    • US Outlook (USD Billion, 2019-2030)
    • US Enhanced Flight Vision Systems by Technology
      • Infrared
      • Synthetic Vision
    • US Enhanced Flight Vision Systems by Component
      • Display
      • Camera
      • Sensor
    • US Enhanced Flight Vision Systems by Platform
      • Fixed-Wing
      • Rotary-Wing
    • CANADA Outlook (USD Billion, 2019-2030)
    • CANADA Enhanced Flight Vision Systems by Technology
      • Infrared
      • Synthetic Vision
    • CANADA Enhanced Flight Vision Systems by Component
      • Display
      • Camera
      • Sensor
    • CANADA Enhanced Flight Vision Systems by Platform
      • Fixed-Wing
      • Rotary-Wing
    • Europe Outlook (USD Billion, 2019-2030)
      • Europe Enhanced Flight Vision Systems by Technology
        • Infrared
        • Synthetic Vision
      • Europe Enhanced Flight Vision Systems by Component
        • Display
        • Camera
        • Sensor
      • Europe Enhanced Flight Vision Systems by Platform
        • Fixed-Wing
        • Rotary-Wing
      • Germany Outlook (USD Billion, 2019-2030)
      • Germany Enhanced Flight Vision Systems by Technology
        • Infrared
        • Synthetic Vision
      • Germany Enhanced Flight Vision Systems by Component
        • Display
        • Camera
        • Sensor
      • Germany Enhanced Flight Vision Systems by Platform
        • Fixed-Wing
        • Rotary-Wing
      • France Outlook (USD Billion, 2019-2030)
      • France Enhanced Flight Vision Systems by Technology
        • Infrared
        • Synthetic Vision
      • France Enhanced Flight Vision Systems by Component
        • Display
        • Camera
        • Sensor
      • France Enhanced Flight Vision Systems by Platform
        • Fixed-Wing
        • Rotary-Wing
      • UK Outlook (USD Billion, 2019-2030)
      • UK Enhanced Flight Vision Systems by Technology
        • Infrared
        • Synthetic Vision
      • UK Enhanced Flight Vision Systems by Component
        • Display
        • Camera
        • Sensor
      • UK Enhanced Flight Vision Systems by Platform
        • Fixed-Wing
        • Rotary-Wing
      • ITALY Outlook (USD Billion, 2019-2030)
      • ITALY Enhanced Flight Vision Systems by Technology
        • Infrared
        • Synthetic Vision
      • ITALY Enhanced Flight Vision Systems by Component
        • Display
        • Camera
        • Sensor
      • ITALY Enhanced Flight Vision Systems by Platform
        • Fixed-Wing
        • Rotary-Wing
      • SPAIN Outlook (USD Billion, 2019-2030)
      • Spain Enhanced Flight Vision Systems by Technology
        • Infrared
        • Synthetic Vision
      • Spain Enhanced Flight Vision Systems by Component
        • Display
        • Camera
        • Sensor
      • Spain Enhanced Flight Vision Systems by Platform
        • Fixed-Wing
        • Rotary-Wing
      • Rest of Europe Outlook (USD Billion, 2019-2030)
      • Rest Of Europe Enhanced Flight Vision Systems by Technology
        • Infrared
        • Synthetic Vision
      • REST OF EUROPE Enhanced Flight Vision Systems by Component
        • Display
        • Camera
        • Sensor
      • REST OF EUROPE Enhanced Flight Vision Systems by Platform
        • Fixed-Wing
        • Rotary-Wing
      • Asia-Pacific Outlook (USD Billion, 2019-2030)
        • Asia-Pacific Enhanced Flight Vision Systems by Technology
          • Infrared
          • Synthetic Vision
        • Asia-Pacific Enhanced Flight Vision Systems by Component
          • Display
          • Camera
          • Sensor
        • Asia-Pacific Enhanced Flight Vision Systems by Platform
          • Fixed-Wing
          • Rotary-Wing
        • China Outlook (USD Billion, 2019-2030)
        • China Enhanced Flight Vision Systems by Technology
          • Infrared
          • Synthetic Vision
        • China Enhanced Flight Vision Systems by Component
          • Display
          • Camera
          • Sensor
        • China Enhanced Flight Vision Systems by Platform
          • Fixed-Wing
          • Rotary-Wing
        • Japan Outlook (USD Billion, 2019-2030)
        • Japan Enhanced Flight Vision Systems by Technology
          • Infrared
          • Synthetic Vision
        • Japan Enhanced Flight Vision Systems by Component
          • Display
          • Camera
          • Sensor
        • Japan Enhanced Flight Vision Systems by Platform
          • Fixed-Wing
          • Rotary-Wing
        • India Outlook (USD Billion, 2019-2030)
        • India Enhanced Flight Vision Systems by Technology
          • Infrared
          • Synthetic Vision
        • India Enhanced Flight Vision Systems by Component
          • Display
          • Camera
          • Sensor
        • India Enhanced Flight Vision Systems by Platform
          • Fixed-Wing
          • Rotary-Wing
        • Australia Outlook (USD Billion, 2019-2030)
        • Australia Enhanced Flight Vision Systems by Technology
          • Infrared
          • Synthetic Vision
        • Australia Enhanced Flight Vision Systems by Component
          • Display
          • Camera
          • Sensor
        • Australia Enhanced Flight Vision Systems by Platform
          • Fixed-Wing
          • Rotary-Wing
        • Rest of Asia-Pacific Outlook (USD Billion, 2019-2030)
        • Rest of Asia-Pacific Enhanced Flight Vision Systems by Technology
          • Infrared
          • Synthetic Vision
        • Rest of Asia-Pacific Enhanced Flight Vision Systems by Component
          • Display
          • Camera
          • Sensor
        • Rest of Asia-Pacific Enhanced Flight Vision Systems by Platform
          • Fixed-Wing
          • Rotary-Wing
        • Rest of the World Outlook (USD Billion, 2019-2030)
          • Rest of the World Enhanced Flight Vision Systems by Technology
            • Infrared
            • Synthetic Vision
          • Rest of the World Enhanced Flight Vision Systems by Component
            • Display
            • Camera
            • Sensor
          • Rest of the World Enhanced Flight Vision Systems by Platform
            • Fixed-Wing
            • Rotary-Wing
          • Middle East Outlook (USD Billion, 2019-2030)
          • Middle East Enhanced Flight Vision Systems by Technology
            • Infrared
            • Synthetic Vision
          • Middle East Enhanced Flight Vision Systems by Component
            • Display
            • Camera
            • Sensor
          • Middle East Enhanced Flight Vision Systems by Platform
            • Fixed-Wing
            • Rotary-Wing
          • Africa Outlook (USD Billion, 2019-2030)
          • Africa Enhanced Flight Vision Systems by Technology
            • Infrared
            • Synthetic Vision
          • Africa Enhanced Flight Vision Systems by Component
            • Display
            • Camera
            • Sensor
          • Africa Enhanced Flight Vision Systems by Platform
            • Fixed-Wing
            • Rotary-Wing
          • Latin America Outlook (USD Billion, 2019-2030)
          • Latin America Enhanced Flight Vision Systems by Technology
            • Infrared
            • Synthetic Vision
          • Latin America Enhanced Flight Vision Systems by Component
            • Display
            • Camera
            • Sensor
          • Latin America Enhanced Flight Vision Systems by Platform
            • Fixed-Wing
            • Rotary-Wing
Infographic

Free Sample Request

Kindly complete the form below to receive a free sample of this Report

Get Free Sample

Customer Strories

“I am very pleased with how market segments have been defined in a relevant way for my purposes (such as "Portable Freezers & refrigerators" and "last-mile"). In general the report is well structured. Thanks very much for your efforts.”

Victoria Milne

Founder

Compare Licence

×
Features License Type
Single User Multiuser License Enterprise User
Price $4,950 $5,950 $7,250
Maximum User Access Limit 1 User Upto 10 Users Unrestricted Access Throughout the Organization
Free Customization
Direct Access to Analyst
Deliverable Format
Platform Access
Discount on Next Purchase 10% 15% 15%
Printable Versions