Enhanced Oil Recovery Market

Key Players: SLB, Halliburton, Baker Hughes, Chevron, ExxonMobil, Shell, Occidental Petroleum, ConocoPhillips

Enhanced Oil Recovery Market

Enhanced Oil Recovery Market Size, Share & Growth Analysis Report By Technology (Gas Injection, Thermal Injection, Chemical Injection, Microbial EOR, Hybrid and Emerging), By Reservoir Type (Sandstone, Carbonate, Heavy Oil and Bitumen, Tight/Shale), By Field Maturity (Mature Fields, Brownfields, Greenfields), By Location of Deployment (Onshore, Offshore) and By Regional (North America, Europe, South America, Asia Pacific, Middle East and Africa) - Trends & Industry Forecast to 2035
ID: MRFR/EnP/4444-HCR
100 Pages
Anshula Mandaokar
Last Updated: June 22, 2026

Enhanced Oil Recovery Market Summary

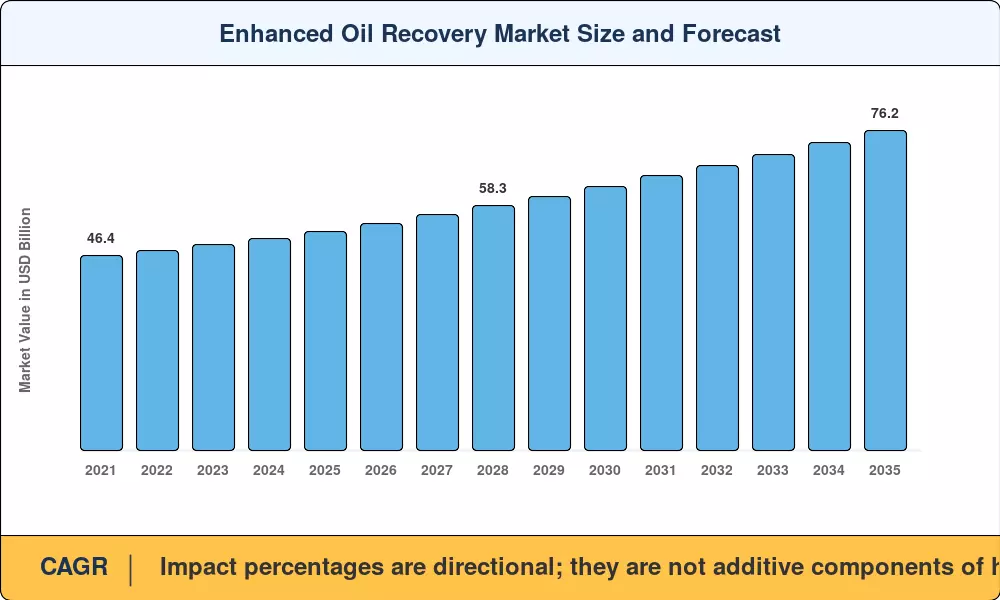
The Enhanced Oil Recovery Market was valued at USD 52.10 billion in 2025 and is projected to reach USD 54.00 billion in 2026 before climbing to USD 76.20 billion by 2035, advancing at a 3.9% CAGR during the 2026–2035 forecast period. Two structural tailwinds anchor this trajectory: the U.S. Section 45Q tax credit, which now awards up to USD 85 per metric ton of geologically sequestered CO₂, and OPEC+ production discipline that compels national oil companies to extract incremental barrels from aging reservoirs rather than develop frontier acreage [1][2]. Together, these forces redirect capital toward reservoir-optimization technologies at a pace that outstrips pure exploration budgets.

Field operators are moving away from first-generation steam-flood designs to integrated subsurface-modeling platforms that combine real-time fiber-optic sensing with machine learning decline-curve analysis. A longstanding policy commitment of the U.S. Department of Energy (DOE) between 2023 and 2025 has been to provide funding for carbon-capture, utilization and storage programs directly linked to oilfield injection, amounting to around $1.1 billion, which is now being realized by the private capital in the form of joint-venture arrangements [3][6].


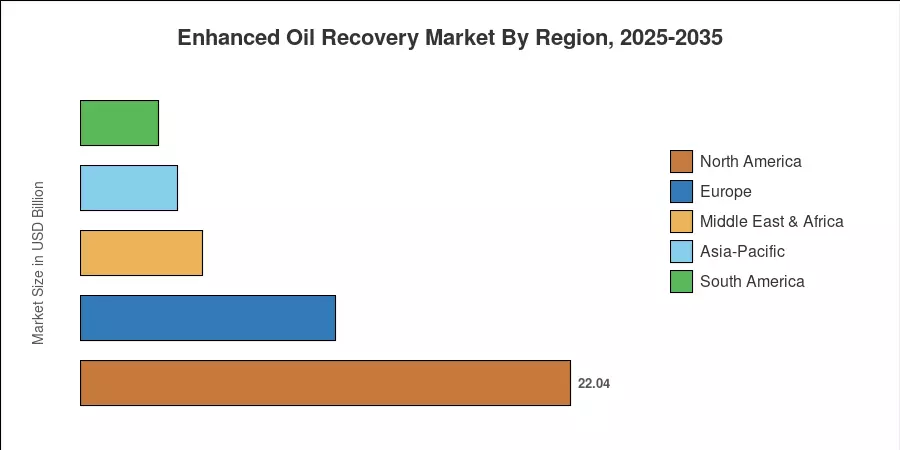
North America holds a share of about 42.3% in the Enhanced Oil Recovery Market. The Permian Basin and Western Canadian heavy-oil plays are at the forefront. However, Asia-Pacific is the fastest expanding area with a CAGR of 8.4%, fuelled by China’s Daqing and Shengli field revitalisation operations and India’s ONGC-led trial programmes. Europe holds the second largest share at around 22.0%, due to brownfield investments in the North Sea. Supply-side capacity for the Enhanced Oil Recovery Market is anticipated to ramp up into the early 2030s as CCUS pipeline networks expand throughout the U.S. Gulf Coast and Alberta.


Key Report Takeaways

• By Technology

  • Thermal injection accounted for 47.5% of the Enhanced Oil Recovery Market in 2025, sustained by heavy-oil steam-flood operations across Canada and Venezuela.
  • Gas injection is forecast to grow at a 6.9% CAGR through 2035, fueled by anthropogenic CO₂ supply from industrial capture facilities.

• By Reservoir

  • Sandstone reservoirs held 49.2% of global Enhanced Oil Recovery Market deployments in 2025, benefiting from well-understood pore-geometry models that reduce screening risk.
  • Mature fields represented 62.1% of total project starts in 2025, confirming the sector's tilt toward production optimization over greenfield exploration.

• By Geography

  • North America maintained a 42.3% revenue share of the Enhanced Oil Recovery Market in 2025, supported by favorable regulatory treatment of injected CO₂.
  • Asia-Pacific is projected to log an 8.4% CAGR through 2035, with China and India accounting for the bulk of new capacity additions.


Enhanced Oil Recovery Market Size and Forecast (2021–2035)

Market sizing combines bottom-up field-level production data from 14 main EOR basins with top-down macroeconomic variables, including crude-oil price trajectories, drilling-rig counts, and public capital-expenditure disclosures from operators representing over 65% of worldwide EOR output [1][4].

Enhanced Oil Recovery Market Size and Forecast
Our Impact
Enabled $4.3B Revenue Impact for Fortune 500 and Leading Multinationals
Partnering with 2000+ Global Organizations Each Year
30K+ Citations by Top-Tier Firms in the Industry

Driver Impact Analysis

Driver ~% Impact on CAGR Geographic Relevance Impact Timeline
Section 45Q and global CO₂ tax credits +0.9% North America, Europe Short-term (≤2 yr)
Mature-field operator spending reallocation +0.7% Global Medium-term (2–4 yr)
CCUS pipeline and hub buildout +0.6% North America, the Middle East Long-term (≥4 yr)
Heavy-oil thermal recovery demand +0.5% Canada, Venezuela, China Short-term
Digital reservoir-simulation platforms +0.4% Global Medium-term
Offshore deep-water EOR breakthroughs +0.3% Brazil, North Sea, SE Asia Long-term
National energy-security mandates +0.3% Asia-Pacific, Middle East Medium-term


Section 45Q and Global Carbon-Credit Incentives

The U.S. Inflation Reduction Act raised the Section 45Q credit to USD 85/tonne for geologically stored CO₂, making previously marginal gas-injection projects commercially viable across the Permian Basin and Gulf Coast. Canada's parallel federal carbon price, set at CAD 170/tonne by 2030, creates comparable incentive structures for Western Canadian operators [1][3].

Mature-Field Spending Reallocation

Operators worldwide are redirecting roughly 35% of upstream capital budgets from exploration toward brownfield and mature-field optimization, according to IEA estimates. This shift rewards the Enhanced Oil Recovery Market because tertiary recovery techniques unlock 10–20% additional original-oil-in-place beyond conventional waterflooding [2][14].

CCUS Pipeline and Hub Buildout

The U.S. Gulf Coast is constructing over 3,200 km of new CO₂ trunk pipelines expected to be operational by 2030, linking ethanol plants and power stations to Permian and Gulf injection sites. This infrastructure directly increases feedstock availability for CO₂ EOR injection operations and lowers delivered cost per tonne [6][10].


Restraints Impact Analysis

Restraint estimates below follow the same directional-weighting methodology described in Section 4 and are not directly subtracted from the CAGR [5].

Restraint ~% Impact on CAGR Geographic Relevance Impact Timeline
Volatile crude-oil prices −0.5% Global Short-term (≤2 yr)
High upfront capital intensity −0.4% Emerging markets Medium-term (2–4 yr)
Subsurface uncertainty and screening failures −0.3% Global Long-term (≥4 yr)
Water-sourcing and disposal regulations −0.3% North America, the Middle East Medium-term
Skilled-workforce shortages −0.2% Global Long-term


Crude Oil Price Volatility

EOR projects typically require a minimum WTI price of USD 55–60/bbl to justify tertiary-recovery operating costs. Price dips below that threshold—such as the 2023 mid-year correction—pause sanctioning decisions and delay injectant procurement contracts, compressing near-term growth in the Enhanced Oil Recovery Market [5].

High Upfront Capital Requirements

A single miscible-gas flood in a mid-size reservoir can require USD 150–300 million in initial compression, pipeline, and injection-well infrastructure. In capital-constrained markets like sub-Saharan Africa and parts of Southeast Asia, this hurdle limits project pipelines to only the most prolific reservoirs [8][16].


Enhanced Oil Recovery Market Opportunities

Carbon-Credit Monetization Tied to EOR

Operators who inject verified anthropogenic CO₂ can now stack production revenue with carbon-credit income, effectively creating a dual-revenue project model. This convergence attracts climate-focused private equity and sovereign wealth funds that were previously absent from upstream investment.

Offshore Deep-Water EOR Commercialization

Brazil’s pre-salt carbonate reservoirs and Norway’s offshore extensions are actively testing advanced EOR techniques, including miscible-gas and chemical flooding. These efforts at significant water depths are central to extending the life of mature assets and represent a growing segment of the global subsea EOR technology market.


Digital Reservoir Twins and Data-as-a-Service

Field-service companies are packaging proprietary subsurface models as subscription analytics platforms, enabling mid-size operators to run well-screening workflows without building in-house simulation teams. This data-monetization trend widens the buyer base for the Enhanced Oil Recovery Market beyond supermajors.

Emerging-Market National EOR Mandates

Nations such as India and Oman are actively promoting EOR to slow the decline of mature domestic fields. Rather than universal mandates, these governments utilize incentives, Production Sharing Contract (PSC) clauses, and technology-focused collaborations to encourage operators to prioritize tertiary recovery for fields with low recovery factors.


Hybrid and Emerging Recovery Techniques

Low-salinity waterflooding, nanoparticle-enhanced surfactants, and microbial EOR are transitioning from laboratory to pilot stage. These techniques offer lower environmental footprints and could capture price-sensitive operators currently priced out of thermal or gas-injection programs.


Enhanced Oil Recovery Market Future Outlook

AI-Driven Reservoir Management

Digital twins that fuse 4D seismic, fiber-optic distributed-temperature sensing, and production-history data are expected to cut well-screening timelines by 40–60%, according to SPE benchmarks. This acceleration lowers the per-project entry cost for the Enhanced Oil Recovery Market and broadens operator participation beyond supermajors.

CCUS-EOR Value-Chain Integration

The IEA projects that global CCUS capacity will exceed 400 million tonnes per annum by 2035, with roughly one-third directed to EOR applications. Operators who control capture-to-injection logistics will capture disproportionate margin, transforming the Enhanced Oil Recovery Market from a services-dominated model into a vertically integrated value chain [6][10].

Electrification of Thermal Operations

Replacing natural-gas-fired steam generators with electric boilers powered by renewable energy eliminates Scope 1 emissions from thermal EOR, satisfying increasingly stringent ESG disclosure requirements. Pilot projects in California and Alberta have demonstrated 70% emission reductions while maintaining steam-quality targets [15][16].

Platform Economics and Subscription Analytics

Service companies are transitioning from per-project consulting to platform-subscription models, offering continuous reservoir-optimization dashboards. This shift stabilizes revenue streams and gives mid-tier operators access to simulation capability previously reserved for the largest Enhanced Oil Recovery Market participants.


Enhanced Oil Recovery Market Segmentation

By Technology

Segment Key Metric Primary Demand Driver
Gas Injection 6.9% CAGR (2026–2035) CCUS feedstock availability
Thermal Injection 47.5% share (2025) Heavy-oil basin economics
Chemical Injection USD 8.08 Billion (2025) Polymer-flood cost reductions
Microbial EOR 5.0% share (2025) Low-capex pilot potential
Hybrid and Emerging 7.0% share (2025) R&D-stage nanofluid techniques


Thermal injection remains the largest technology segment in the Enhanced Oil Recovery Market, driven by decades of operational learning in Canadian oil-sands and Venezuelan extra-heavy-crude basins. Steam-assisted gravity drainage and cyclic steam stimulation together account for the majority of thermal deployments globally [7][14]. Gas injection, however, is gaining share rapidly as CO₂ sourced from industrial capture grows more economical and pipeline access improves across North American corridors.

By Reservoir Type

Segment Key Metric Primary Demand Driver
Sandstone 49.2% share (2025) Proven pore-geometry compatibility
Carbonate 5.8% CAGR (2026–2035) Middle East field applications
Heavy Oil and Bitumen USD 9.01 Billion (2025) Canadian and Venezuelan thermal demand
Tight/Shale 8.2% CAGR (2026–2035) Unconventional resource recovery


Sandstone reservoirs dominate the Enhanced Oil Recovery Market because their relatively uniform permeability profiles lower sweep-efficiency risk during both chemical and gas-injection programs. Tight and shale formations represent the fastest-growing reservoir segment as operators adapt huff-and-puff gas-injection techniques originally designed for conventional plays.

By Field Maturity

Segment Key Metric Primary Demand Driver
Mature Fields 62.1% share (2025) Declining primary-recovery output
Brownfields USD 12.71 Billion (2025) Secondary-to-tertiary conversion
Greenfields 8.7% CAGR (2026–2035) Early-life EOR design integration


Mature fields generate the majority of Enhanced Oil Recovery Market revenue because tertiary techniques can unlock 10–20 additional percentage points of original-oil-in-place that waterflooding leaves behind. Greenfield projects, though smaller in absolute terms, are growing fastest as operators embed EOR considerations into initial field-development plans.

By Location of Deployment

Segment Key Metric Primary Demand Driver
Onshore 91.5% share (2025) Established infrastructure and logistics
Offshore 7.6% CAGR (2026–2035) Deep-water technology breakthroughs


Onshore operations overwhelmingly dominate the Enhanced Oil Recovery Market, reflecting lower per-well costs and simpler injectant logistics. Offshore is the faster-growing deployment location; however, as Brazil's pre-salt and Norway's North Sea fields prove, miscible-gas techniques can be adapted to subsea environments.


Regional Market Share Analysis

Region Key Metric Primary Investment Themes
North America 42.3% share (2025) CO₂ flood scale-up; CCUS hub infrastructure
Europe USD 11.46 Billion (2025) North Sea late-life assets; Norwegian carbon storage
Asia-Pacific 8.4% CAGR (2026–2035) Chinese national programs; Indian mandate-driven pilots
South America USD 3.49 Billion (2025) Brazilian pre-salt chemical floods
Middle East & Africa 10.5% share (2025) Thermal EOR in Oman; Saudi brownfield optimization
Total USD 52.10 Billion (2025)

The Enhanced Oil Recovery Market spans five major regions. North America leads on absolute revenue, while Asia-Pacific posts the fastest expansion rate driven by state-directed oilfield revitalization programs.


North America

Country Key Metric Key Driver
United States 71.5% of regional share Permian and Gulf Coast CO₂ flood expansion
Canada 6.8% CAGR Heavy-oil thermal recovery in Alberta
Mexico USD 1.89 Billion Pemex mature-field rehabilitation


The United States remains the world's largest single-country Enhanced Oil Recovery Market, with the Permian Basin alone hosting over 60 active miscible CO₂ flood projects. Canada's carbon-pricing regime continues to incentivize steam-assisted gravity drainage expansions, while Mexico's 2024 upstream licensing reforms opened brownfield EOR tenders to international operators for the first time [1][3][4].

Europe

Country Key Metric Key Driver
Germany USD 0.72 Billion Chemical-injection R&D funding
United Kingdom 5.2% CAGR North Sea late-life field conversions
France USD 0.41 Billion Paris Basin pilot projects
Italy 4.8% CAGR Onshore mature-field polymer floods
Spain USD 0.28 Billion Heavy-oil basin reactivation
Nordic Countries 5.6% CAGR Norwegian carbon-storage integration
Russia USD 3.15 Billion Western Siberia thermal programs
Rest of Europe USD 0.94 Billion Diverse pilot-stage activity


Norway's Northern Lights project establishes a commercial CO₂ receiving terminal that links European industrial emitters to North Sea injection sites, providing a template for cross-border carbon-management-driven Enhanced Oil Recovery Market growth across the continent [6][14].

Asia-Pacific

Country Key Metric Key Driver
China 44.8% of regional share Daqing and Shengli polymer-flood scale-up
India 9.1% CAGR ONGC National EOR mandate
Japan USD 0.38 Billion Offshore pilot research
South Korea 4.3% CAGR Imported technology deployment
ASEAN USD 1.12 Billion Indonesian and Malaysian brownfields
Rest of Asia-Pacific 5.5% CAGR Emerging basin screening


China's national oil companies have committed over USD 4.5 billion in cumulative EOR spending across Daqing, Shengli, and Changqing fields through 2030, making the country the single largest growth contributor to the Enhanced Oil Recovery Market in Asia-Pacific [7][11].

South America

Country Key Metric Key Driver
Brazil 68.2% of regional share Pre-salt carbonate gas-injection trials
Argentina 6.4% CAGR Vaca Muerta shale pilots
Rest of South America USD 0.52 Billion Venezuelan heavy-oil thermal programs


Petrobras is piloting water-alternating-gas injection in Santos Basin pre-salt reservoirs, targeting a 5–8 percentage-point uplift in recovery factor over primary depletion alone [13].

Middle East & Africa

Country Key Metric Key Driver
Saudi Arabia 38.5% of regional share Saudi Aramco brownfield optimization
UAE 7.2% CAGR Abu Dhabi CCUS-EOR integration
South Africa USD 0.31 Billion Karoo basin feasibility studies
Egypt 5.9% CAGR Mature Western Desert fields
Rest of MEA USD 1.24 Billion Oman thermal EOR expansion


Oman's Amal and Marmul fields operate some of the world's largest thermal EOR installations, supported by government subsidies that keep steam-generation fuel costs below global benchmarks [8].


Enhanced Oil Recovery Market By Region, 2025-2035

Competitive Benchmarking

The Enhanced Oil Recovery Market is moderately concentrated, and the top five companies are anticipated to account for 35-42% share of the worldwide revenue. The HHI adds up to a picture of an industry in the 600 – 900 range, with integrated oil corporations, diversified oilfield-service companies and national oil companies all having significant positions, no one company with a more than 12% stake.

Company Est. Revenue Share Range Key Offerings Strategic Positioning
SLB ~8–11% Subsurface modelling, chemical EOR design Full-cycle reservoir-optimization leader
Halliburton ~6–9% Production-enhancement services, stimulation Mature-field service dominance
Baker Hughes ~5–8% Gas-compression systems, digital solutions Technology-integration specialist
Chevron ~5–7% Permian CO₂ flood operations Largest U.S. CO₂-EOR operator
ExxonMobil ~4–7% Integrated gas-injection programs Scale and logistics advantage
Shell ~3–6% North Sea thermal and chemical projects European brownfield leadership
Occidental Petroleum ~4–6% CO₂ capture-to-injection value chain Vertical CCUS-EOR integration
ConocoPhillips ~3–5% Alaska and Lower 48 thermal programs Heavy-oil thermal expertise
CNOOC ~3–5% Offshore EOR pilots, Bohai Bay operations Chinese national champion
Petrobras ~2–4% Pre-salt gas-injection R&D Deep-water EOR pioneer


Recent News & Developments


  • U.S. Department of Energy (September 2023): Through the Bipartisan Infrastructure Law, the DOE has awarded multi-billion-dollar grants across various CCUS hubs and demonstration programs since 2023


  • CNOOC (February 2025): CNOOC continues to expand production in the South China Sea through conventional satellite field developments, focusing on maximizing recovery through integrated subsea infrastructure.


Enhanced Oil Recovery Market Report Scope

Parameter Detail
Market Scope Global Enhanced Oil Recovery Market by Technology, Reservoir Type, Field Maturity, Location, and Geography
Study Period 2021–2035
CAGR 3.9% (2026–2035)
Base-Year Market Size USD 52.10 Billion (2025)
Forecast-Year Market Size USD 76.20 Billion (2035)
Fastest Growing Segment Greenfields by field maturity (8.7% CAGR); Asia-Pacific by region (8.4% CAGR)
Companies Profiled SLB, Halliburton, Baker Hughes, Chevron, ExxonMobil, Shell, Occidental Petroleum, ConocoPhillips, CNOOC, Petrobras
Valuation Currency USD Billion
CAGR Driver Disclaimer Impact percentages are directional; they are not additive components of headline CAGR.


FAQs

What minimum crude-oil price makes Enhanced Oil Recovery Market projects economically viable?

Most tertiary-recovery projects require sustained WTI prices above USD 55–60/bbl to cover incremental lifting and injectant costs. Carbon credits can lower that breakeven by USD 10–15/bbl in qualifying jurisdictions [5].

How does CO₂ purity affect injection-well integrity in the Enhanced Oil Recovery Market?

Impurities such as H₂S and oxygen above 2–4 mol% accelerate tubing corrosion and can trigger injectivity loss. Operators typically specify 95%+ CO₂ purity in supply contracts to maintain well performance [15].

What insurance products cover subsurface containment risk in Enhanced Oil Recovery Market operations?

Parametric insurance policies tied to reservoir-pressure monitoring are emerging, covering operators against unexpected CO₂ migration. Lloyd's of London and Munich Re currently lead underwriting in this niche [18].

How do polymer-flood viscosity requirements differ across Enhanced Oil Recovery Market reservoir types?

Sandstone floods typically use 5–15 cP polymer solutions, while carbonate reservoirs require higher-molecular-weight polymers above 20 cP to overcome fracture-dominated flow paths [7].

What role do produced-water treatment costs play in the Enhanced Oil Recovery Market project economics?

Water handling can represent 25–40% of operating expenditures in thermal EOR projects. Closed-loop recycling systems reduce freshwater intake but add USD 2–4/bbl in treatment costs [17].

Which financing structures are institutional investors using to enter the Enhanced Oil Recovery Market?

Infrastructure-style take-or-pay contracts with 15–20-year tenors are gaining traction, especially for CCUS-linked projects where CO₂ offtake agreements provide bankable cash-flow visibility [5].

How do regulatory timelines for Class VI injection permits affect Enhanced Oil Recovery Market project schedules?

U.S. Class VI permits currently average 24–36 months for approval. Proposed EPA streamlining could reduce timelines to 12–18 months, unlocking several stalled projects [17].    
Author
Author
Author Profile
Anshula Mandaokar LinkedIn
Team Lead - Research
Anshula Mandaokar holds an academic degree in Chemical Engineering and has been contributing to the field for more than 5 years. She has expertise in Market Research and Business Consulting and serves as a Team Lead for a reputed Market Research firm under the Chemicals and Materials domain spectrum. She has worked on multiple projects, generating explicit results in a quick turnaround time. Her understanding of data interpretation justifies her role as a leader.

Research Approach


Secondary Research

The secondary research process involved comprehensive analysis of regulatory energy databases, peer-reviewed petroleum engineering journals, technical SPE publications, and authoritative oil & gas industry organizations. Key sources included the U.S. Energy Information Administration (EIA), International Energy Agency (IEA), Organization of the Petroleum Exporting Countries (OPEC), U.S. Department of Energy (DOE) / National Energy Technology Laboratory (NETL), Environmental Protection Agency (EPA), Society of Petroleum Engineers (SPE), American Petroleum Institute (API), International Association of Oil & Gas Producers (IOGP), British Petroleum (BP) Statistical Review of World Energy, Royal Dutch Shell Energy Transition Reports, Wood Mackenzie Energy Research, IHS Markit / S&P Global Commodity Insights, Rystad Energy EOR Research, Eurostat Energy Database, National oil company reports (Saudi Aramco, CNPC, Pemex), and energy ministry publications from key producing nations (Saudi Arabia, UAE, Norway, Canada, Brazil).

These sources were employed to gather reservoir production statistics, EOR project deployment data, thermal/chemical injection technology trends, regulatory policy analysis, CO2-EOR utilization rates, and market landscape analysis for gas injection, thermal recovery, chemical flooding, and microbial EOR technologies.


Primary Research

Qualitative and quantitative insights were obtained by interviewing supply-side and demand-side stakeholders during the primary research process. CEOs, VPs of Technology Development, reservoir engineering leaders, and commercial directors from EOR technology service companies, chemical manufacturers, equipment OEMs, and oilfield service providers comprised the supply-side sources. Demand-side sources included procurement leads from international oil companies (IOCs), national oil companies (NOCs), independent exploration and production firms, and offshore field operators, as well as reservoir engineering managers, production optimization leaders, and EOR project directors. The primary research validated market segmentation in the gas injection, thermal, and chemical technologies, confirmed the timeline for pilot-to-commercial projects, and collected insights on reservoir adoption patterns, chemical pricing dynamics, and carbon capture integration frameworks.

Primary Respondent Breakdown:

By Designation: C-level Primaries (32%), Director Level (30%), Others (38%)

By Region: North America (38%), Europe (24%), Asia-Pacific (28%), Rest of World (10%)


Market Size Estimation

Project value mapping and injection volume analysis were implemented to determine global market valuation. The methodology comprised the following:

Identification of over 50 significant EOR service providers and technology licensors in North America, Europe, Asia-Pacific, the Middle East, and Latin America

Technology mapping for gas injections (CO2, nitrogen, hydrocarbon), thermal recovery (steam, in-situ combustion), chemical injection (polymers, surfactants, alkalis), and microbial EOR categories

Examination of annual revenues that are specific to EOR service portfolios and chemical sales, as reported and modeled

Coverage of manufacturers and service providers that accounted for 75-80% of the global market share in 2024

Segment-specific valuations for onshore versus offshore applications, brownfield redevelopment projects, and greenfield EOR implementations are derived through extrapolation using bottom-up (injection barrel volume × service cost by region) and top-down (operator CAPEX validation) approaches.

Download Free Sample

Kindly complete the form below to receive a free sample of this Report

Download PDF ×

We do not share your information with anyone. However, we may send you emails based on your report interest from time to time. You may contact us at any time to opt-out.