Ethernet Switch Market (2026 - 2035)

Ethernet Switch Market Size, Share and Research Report By Switch Type (Fixed Configuration Switches, Modular Switches), By Port Speed (1 GbE and Below, 2.5/5 GbE, 10 GbE and Above), By End User (Enterprise (Commercial Offices & Campuses), Cloud and Data Center Providers, Service Providers, Industrial and Manufacturing), By Management Type (Fully Managed Switches, Smart / Web-Managed Switches, Unmanaged Switches) and By Region (North America, Europe, Asia-Pacific, South America, Middle East & Africa) – Industry Forecast to 2035.
ID: MRFR/SEM/3157-HCR
200 Pages
Ankit Gupta, Shubham Munde
Last Updated: July 13, 2026
Ethernet Switch Market
Market Size
Forecast Period2026-2035
CAGR (2026-2035)9.40%
2025 Market SizeUSD 36.48 Billion
2035 Market SizeUSD 89.62 Billion
Key Players
Cisco Systems
Arista Networks
Huawei Technologies
HPE / Aruba
Juniper Networks
Dell Technologies
Opportunities
  • AI-Optimized Ethernet Fabrics for GPU Clusters
  • Cloud-Managed and Network-as-a-Service Platforms
  • Edge Data Center and Micro-Facility Deployments

Ethernet Switch Market Summary

The Ethernet Switch Market reached an estimated USD 36.48 Billion in 2025 and is projected to climb from USD 39.93 billion in 2026 to USD 89.62 Billion by 2035, registering a compound annual growth rate of 9.40% across the forecast window. Two catalysts sit behind this trajectory: the global buildout of artificial intelligence training clusters — where hyperscale operators are committing tens of billions of dollars annually to GPU-dense racks that require non-blocking, low-latency fabrics — and enterprise network refresh programs driven by WiFi 7 access points that demand multi-gigabit uplinks [1][2]. These parallel investment waves are pulling Ethernet Switch Market revenues upward at a pace not seen since the 10 GbE transition cycle of the early 2010s.

The tech world is changing fast. The legacy three-tier architectures that were anchored on chassis-based core switches are now being replaced by spine-leaf topologies built on merchant-silicon platforms and disaggregated operating systems. Switches from a variety of vendors are now using Broadcom’s Memory Tomahawk 5 and Jericho3-AI ASICs, driving down price premiums and expediting the move to 400-gigabit and 800-gigabit line rates [3]. At the same time, organizations are collapsing branch and campus infrastructure into cloud-managed solutions that combine switching, wireless and security under a single subscription, disrupting vendor economics in the Ethernet Switch Market.

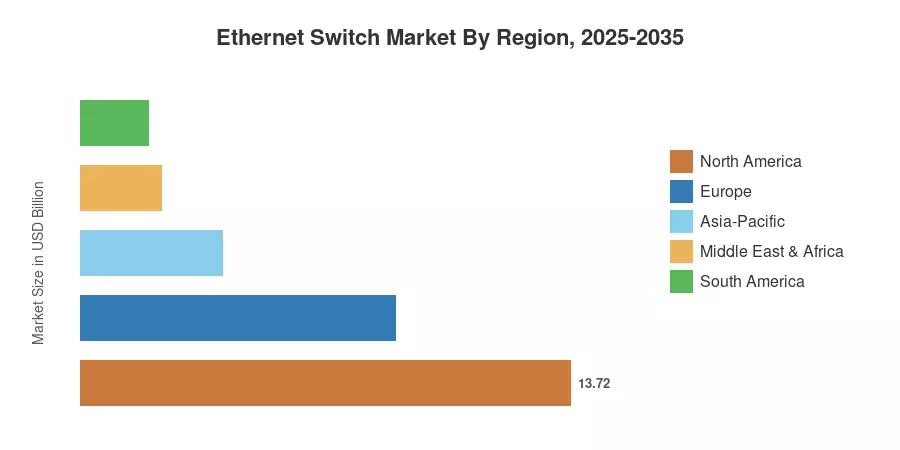
North America captured roughly 37.6% of the Ethernet Switch Market in 2025, due to the US hyperscaler capex and government network modernization initiatives. The fastest expanding region is Asia-Pacific, which is expected to experience a CAGR of 10.90% through 2035. Sovereign AI programs in India, Japan and Southeast Asia are driving greenfield data center construction. Europe is the second-largest region with a 24.2% share, driven by the EU Digital Decade ambitions and industrial IoT rollouts in automotive and manufacturing verticals. The next decade will test vendors’ ability to scale silicon performance while keeping power budgets that are now eating up an increasing share of data center operational costs [4].


Key Report Takeaways

• By Switch Type

  • Fixed configuration switches commanded a dominant share of the Ethernet Switch Market in 2025, accounting for approximately 81.5% of total revenue.
  • Modular switches are expected to expand at a CAGR of 10.90% through 2035, driven by hyperscale spine deployments requiring high-radix chassis.

• By Port Speed

  • The 1 GbE and below segment captured roughly 28.9% of revenue in 2025, reflecting the installed base across campus and branch networks.
  • 400 GbE and above is projected to grow at a 14.60% CAGR over 2026–2035, the fastest speed tier in the Ethernet Switch Market.

• By End User

  • Enterprise users represented approximately 38.2% of the Ethernet Switch Market revenue in 2025.
  • Cloud and data center providers are forecast to register the highest end-user CAGR at 12.50% through 2035.

• By Management Type

  • Fully managed switches accounted for roughly 54.8% of the Ethernet Switch Market in 2025.
  • Unmanaged switches are advancing at a 9.80% CAGR, fueled by edge and industrial deployments.

• By Region

  • North America led the Ethernet Switch Market with a 37.6% revenue share in 2025, underpinned by hyperscaler and federal spending.
  • Asia-Pacific is tracking a 10.90% CAGR over 2026–2035, propelled by AI cluster builds and edge deployments.


Ethernet Switch Market Size and Forecast (2021–2035)

Market Research Future's estimates draw on a triangulated methodology combining top-down macroeconomic indicators (IT capital expenditure, data center capacity additions), bottom-up vendor revenue disclosures, and proprietary primary interviews with network architects and procurement teams across 40 countries. Historical figures (2021–2024) reflect actual shipment data; 2025 is a calibrated base-year estimate; and 2026–2035 represents the forecast horizon anchored to the 9.40% CAGR.
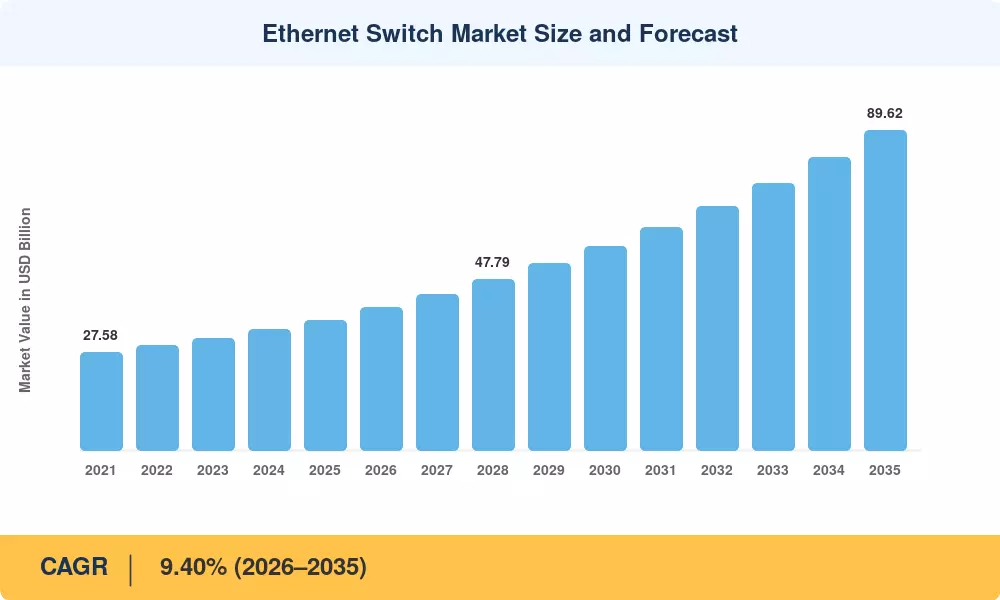
Ethernet Switch Market Size and Forecast
Our Impact
Enabled $4.3B Revenue Impact for Fortune 500 and Leading Multinationals
Partnering with 2000+ Global Organizations Each Year
30K+ Citations by Top-Tier Firms in the Industry

Driver Impact Analysis

Driver ~% Impact on CAGR Geographic Relevance Impact Timeline
AI/ML cluster fabric buildouts ~22% Global (US, China, India) Short-term (≤2 yr)
Hyperscale data center expansion ~18% North America, Asia-Pacific Medium-term (2–4 yr)
Enterprise WiFi 7 and multi-gig refresh ~15% North America, Europe Short-term (≤2 yr)
400G/800G silicon cost reduction ~14% Global Medium-term (2–4 yr)
Edge computing and IoT proliferation ~12% Asia-Pacific, MEA Long-term (≥4 yr)
Cloud-managed subscription models ~10% Global Medium-term (2–4 yr)
Sovereign AI and digital infrastructure mandates ~9% Asia-Pacific, MEA Long-term (≥4 yr)


AI and Machine Learning Cluster Fabric Buildouts

The training workloads for generative AI call for backend networks with zero packet loss and sub-microsecond tail latencies. This is pushing hyperscalers toward 400G and 800G Ethernet fabrics that are displacing InfiniBand in an increasing share of GPU clusters. In 2024, Microsoft, Google and Meta spent over USD 130 billion on capex, much of it on network infrastructure [2]. In 2023, the Ultra Ethernet Consortium was created by over 80 member firms to standardize lossless Ethernet transport protocols to reduce the barrier for AI optimized switching silicon and make the Ethernet Switch Market a direct beneficiary of every new AI training cohort [12].


Hyperscale Data Center Expansion

Global data center capacity additions are forecast to exceed an outstanding value 35 GW of critical IT load by 2030, much higher than 17 GW in 2024, according to estimates from the International Energy Agency [4]. Each megawatt of IT load translates into thousands of switch ports — typically two top-of-rack switches per server cabinet and a corresponding spine layer. This infrastructure multiplication effect means the Ethernet Switch Market grows in lockstep with every new data center campus, whether it sits in Northern Virginia, Dublin, or Johor Bahru.

Enterprise WiFi 7 and Multi-Gigabit Refresh

Legacy 1 GbE uplinks are becoming a constraint with WiFi 7 access points delivering aggregate speed above 40 Gbps. Enterprises moving to WiFi 7 must also upgrade wiring closet switches to 2.5G or 5G multi-gigabit ports with greater PoE budgets (typically 60 W or 90 W per port to power cameras, digital signage, and next-generation access points) [8]. This “pull-through” impact generates a cascading refresh opportunity across the campus Ethernet Switch Market that expert surveys indicate could exceed USD 8 Billion in cumulative incremental spend between 2025 and 2028 [13].


400G/800G Silicon Cost Reduction

Merchant-silicon roadmaps from Broadcom, Marvell, and Intel are on a two-year cadence that doubles per-port bandwidth while holding die costs roughly flat. Broadcom's Tomahawk 5, shipping in volume since late 2024, delivers 51.2 Tbps of aggregate switching capacity on a single ASIC — enough to build a 64-port 800G spine switch [3]. As these silicon platforms commoditize, they compress ASP premiums that previously kept ultra-high-speed switches confined to hyperscale buyers, opening the Ethernet Switch Market to large enterprises and colocation providers.


Restraints Impact Analysis

The restraint impact percentages below are directional estimates of each factor's dampening effect on the headline CAGR. They do not mechanically subtract from growth and should be read as relative headwinds.

Restraint ~% Negative Impact on CAGR Geographic Relevance Impact Timeline
Power and cooling cost escalation ~–6% Global Medium-term (2–4 yr)
Capital expenditure constraints for mid-tier enterprises ~–5% Europe, South America Short-term (≤2 yr)
Vendor lock-in and OS fragmentation ~–4% Global Long-term (≥4 yr)
Semiconductor supply-chain concentration ~–3% Global Medium-term (2–4 yr)
Cybersecurity attack surface expansion ~–2% North America, Europe Long-term (≥4 yr)


Power and Cooling Cost Escalation

A single 800G spine switch can draw upward of 3,000 watts under full load — roughly three times the power envelope of a comparable 100G platform from five years ago. With electricity prices rising in key data center markets (Northern Virginia saw a 30% rate increase between 2022 and 2024), operators face growing tension between bandwidth upgrades and sustainability commitments [4]. This power-density challenge tempers procurement velocity in the Ethernet Switch Market, particularly for facilities that have exhausted existing cooling headroom and face multi-year lead times on utility interconnections.

Capital Expenditure Constraints for Mid-Tier Enterprises

While hyperscalers and large enterprises can absorb premium pricing for next-generation switches, mid-market organizations with annual IT budgets below USD 5 Million often defer upgrades to stretch the useful life of existing infrastructure. Industry surveys indicate that nearly 40% of mid-tier companies in Western Europe postponed campus switch refreshes in 2024 due to macroeconomic uncertainty [14]. Leasing and network-as-a-service models are beginning to soften this constraint, but adoption remains uneven across geographies, slowing the addressable market expansion in the Ethernet Switch Market.

Vendor Lock-in and Operating System Fragmentation

Proprietary network operating systems continue to anchor many campus and service-provider deployments, creating switching costs that slow competitive turnover. Although SONiC and other open-source platforms have gained traction in hyperscale environments, interoperability challenges and the absence of unified management tooling across vendors discourage enterprises from committing to disaggregated stacks [15]. This fragmentation limits the pace at which merchant-silicon economics translate into broader Ethernet Switch Market price reductions.


Ethernet Switch Market Opportunities

AI-Optimized Ethernet Fabrics for GPU Clusters

The Ultra Ethernet Consortium's specification for lossless, congestion-aware transport opens a multi-billion-dollar opportunity for switch vendors that embed AI-specific telemetry and adaptive routing into their platforms. As enterprises build private AI inference clusters, demand for rack-scale Ethernet fabrics is extending beyond hyperscalers into financial services, pharmaceutical research, and autonomous vehicle simulation labs.

Cloud-Managed and Network-as-a-Service Platforms

Subscription-based network management platforms convert one-time hardware purchases into recurring revenue streams. Vendors offering cloud-managed switches with built-in analytics, automated firmware updates, and zero-touch provisioning are capturing budget from mid-tier enterprises that lack dedicated network engineering staff. This shift reshapes the Ethernet Switch Market toward platform economics and higher lifetime customer value.

Edge Data Center and Micro-Facility Deployments

The proliferation of content delivery, autonomous systems, and industrial automation use cases is driving demand for compact, ruggedized switches deployed at the network edge. Markets in Southeast Asia, the Middle East, and sub-Saharan Africa are particularly ripe for edge builds, where connectivity infrastructure leapfrogs traditional campus architectures.

PoE-Powered Smart Building and IoT Infrastructure

Higher-wattage Power-over-Ethernet standards (IEEE 802.3bt, delivering up to 90 W) enable switches to power LED lighting, HVAC sensors, surveillance cameras, and digital signage without dedicated electrical runs. Commercial real estate developers integrating smart-building technologies represent a greenfield vertical for the Ethernet Switch Market, with building automation spending projected to surpass USD 120 Billion globally by 2030 [9].

Emerging-Market Digital Sovereignty Programs

Governments in India, Saudi Arabia, Brazil, and Indonesia are earmarking billions of dollars for sovereign cloud infrastructure and national data center capacity. India's Digital India initiative alone allocated over USD 1.2 Billion for data center incentives in 2024, each facility requiring thousands of switch ports [11]. These programs create a structural floor for demand growth in the Ethernet Switch Market outside traditional North American and European strongholds.


Ethernet Switch Market Future Outlook

AI-Native Network Fabrics

Over the next decade, switch operating systems will evolve from reactive forwarding engines into AI-native platforms capable of real-time traffic engineering, predictive failure avoidance, and workload-aware path selection. Vendors embedding inference accelerators directly into switch ASICs will differentiate on operational intelligence, transforming the Ethernet Switch Market from a hardware commodity race into a software-defined value competition [12].

Platform Economics and Recurring Revenue

The shift toward subscription licensing and cloud-managed dashboards is restructuring vendor economics. By 2030, Market Research Future estimates that over 45% of campus switch revenue will carry a recurring software or service component, compressing gross margins on hardware while elevating lifetime customer value and reducing churn [10]. Vendors that fail to build platform stickiness will face margin erosion as merchant silicon commoditizes the hardware layer.

Sustainability and Power-Efficient Silicon

Data center operators are setting science-based carbon targets that place direct pressure on switch vendors to deliver higher bandwidth per watt. Silicon roadmaps moving to 3 nm and 2 nm process nodes will help, but thermal management, liquid-cooled switch enclosures, and power-aware scheduling algorithms will become competitive differentiators. The IEA projects global data center electricity consumption could reach 945 TWh by 2030, up from approximately 460 TWh in 2022 [4]. Switches that reduce per-port power consumption while scaling to 1.6 Tbps line rates will capture premium positioning in the Ethernet Switch Market.

Convergence of IT and OT Networks

Industrial Ethernet is blurring the boundary between enterprise IT and operational technology, as manufacturers, utilities, and logistics operators demand time-sensitive networking (TSN) features embedded in standard Ethernet switches. The convergence opportunity extends the addressable Ethernet Switch Market beyond traditional office and data center environments into factory floors, substations, and autonomous vehicle corridors, creating a structural demand layer that is largely insulated from enterprise IT budget cycles [9].


Ethernet Switch Market Segmentation

By Switch Type

Segment Key Metric Primary Demand Driver
Fixed Configuration Switches 81.5% share (2025) Campus, branch, and top-of-rack standardization
Modular Switches 10.90% CAGR (2026–2035) Hyperscale spine and service-provider core builds


Fixed configuration switches dominate the Ethernet Switch Market because they offer a standardized, lower-cost form factor that satisfies the vast majority of enterprise campus and data center top-of-rack requirements. These units ship in high volumes with predictable power profiles, making them the default choice for organizations operating standardized network designs. Modular switches, while commanding a smaller installed base, are advancing rapidly as hyperscale operators build high-radix spine layers that demand chassis capable of housing dozens of 400G or 800G line cards in a single platform.

By Port Speed

Segment Key Metric Primary Demand Driver
1 GbE and Below 28.9% share (2025) Legacy campus and branch installed base
2.5/5 GbE USD 3.42 Billion (2025) WiFi 6E/7 uplink refresh
10 GbE and Above 14.60% CAGR (2026–2035) Data center and AI fabric scale-out


The 1 GbE segment retains a significant revenue share in the Ethernet Switch Market, reflecting millions of deployed access-layer ports in office buildings, schools, and retail locations worldwide. However, growth momentum has decisively shifted toward higher-speed tiers. The 400 GbE and above category is expanding at the fastest pace, driven by AI training clusters and hyperscale spine deployments where each rack demands multiple 400G or 800G uplinks to avoid bandwidth bottlenecks.

By End User

Segment Key Metric Primary Demand Driver
Enterprise (Commercial Offices & Campuses) 38.2% share (2025) WiFi 7 refresh, PoE upgrades, branch consolidation
Cloud and Data Center Providers 12.50% CAGR (2026–2035) AI fabric expansion and colocation growth
Service Providers USD 4.18 Billion (2025) 5G transport and metro aggregation
Industrial and Manufacturing 9.20% CAGR (2026–2035) OT-IT convergence and TSN adoption


Enterprise buyers account for the largest share of the Ethernet Switch Market, purchasing access-layer and distribution-layer switches for office campuses, healthcare facilities, educational institutions, and retail chains. Cloud and data center providers, while currently a smaller revenue share, are accelerating faster than any other end-user segment as each new AI training cluster requires thousands of high-speed switch ports for GPU-to-GPU communication fabrics.

By Management Type

Segment Key Metric Primary Demand Driver
Fully Managed Switches 54.8% share (2025) Enterprise and data center policy control requirements
Smart / Web-Managed Switches USD 5.84 Billion (2025) SME and branch deployments with basic VLAN needs
Unmanaged Switches 9.80% CAGR (2026–2035) Edge, industrial, and consumer plug-and-play use cases


Fully managed switches lead the Ethernet Switch Market because enterprise security policies, segmentation requirements, and compliance mandates demand granular control over port-level access, VLAN configuration, and telemetry export. Unmanaged units, while lacking configuration interfaces, are growing briskly as IoT edge deployments and industrial applications prioritize simplicity and low cost over policy granularity.


Regional Market Share Analysis

Region Key Metric Primary Investment Themes
North America 37.6% revenue share (2025) Hyperscaler capex, federal modernization, WiFi 7 campus refresh
Europe 24.2% revenue share (2025) Industrial IoT, Digital Decade targets, sustainability-driven upgrades
Asia-Pacific 10.90% CAGR (2026–2035) Sovereign AI, edge data centers, 5G backhaul
South America 5.2% revenue share (2025) Telecom modernization, colocation expansion
Middle East & Africa 6.2% revenue share (2025) Smart city initiatives, sovereign cloud mandates
Total USD 36.48 Billion (2025)

The Ethernet Switch Market follows a regional hierarchy shaped by data center density, enterprise IT maturity, and government digital infrastructure programs. North America remains the revenue leader, while Asia-Pacific registers the fastest expansion owing to sovereign AI mandates and new colocation builds.


North America

Country Key Metric Key Driver
US 78.4% of regional share Hyperscale campus builds (Virginia, Oregon, Texas)
Canada CAGR 8.80% Government cloud migration and healthcare digitization
Mexico USD 0.68 Billion (2025) Nearshoring-driven manufacturing network upgrades


The US dominates the North American Ethernet Switch Market, anchored by hyperscaler capital programs that exceeded USD 130 Billion in 2024 and the Department of Defense's Zero Trust networking mandates requiring upgraded switch infrastructure across military installations [1][17]. Canada's federal government is migrating critical workloads to domestic cloud zones, spurring campus and data center switch procurement, while Mexico's nearshoring boom in automotive and electronics manufacturing is catalyzing factory-floor network builds.

Europe

Country Key Metric Key Driver
Germany 22.8% of regional share Industry 4.0 factory automation
UK CAGR 8.60% Financial services data center consolidation
France USD 1.34 Billion (2025) Nuclear energy data center corridor
Italy 8.3% of regional share SME digital transformation grants
Spain CAGR 8.40% Telecom edge deployments
Nordic Countries USD 1.08 Billion (2025) Renewable-powered hyperscale campuses
Russia 4.1% of regional share Domestic infrastructure substitution
Rest of Europe CAGR 7.90% EU cohesion fund digital investments


Germany's Ethernet Switch Market benefits from deep industrial automation adoption, where OT-IT convergence requires hardened managed switches on factory floors. The UK's financial district data center corridor and France's emerging nuclear-powered data center zones provide structural demand tailwinds. EU Digital Decade targets mandate gigabit connectivity for all households by 2030, driving campus and access-layer switch deployments across the continent [18].

Asia-Pacific

Country Key Metric Key Driver
China 38.5% of regional share Domestic AI chip ecosystem and cloud expansion
India CAGR 12.10% Digital India data center incentives
Japan USD 1.92 Billion (2025) Enterprise AI adoption and 5G backhaul
South Korea 10.4% of regional share Semiconductor fab network infrastructure
ASEAN CAGR 11.40% Colocation and submarine cable landing hubs
Rest of Asia-Pacific USD 0.78 Billion (2025) Government digitization programs


Asia-Pacific represents the highest-growth arena for the Ethernet Switch Market, led by China's domestic cloud giants (Alibaba Cloud, Tencent Cloud, Huawei Cloud) building AI training clusters on indigenous silicon. India's data center capacity tripled between 2020 and 2024, supported by government incentives offering fiscal benefits for facilities exceeding 5 MW [11]. ASEAN markets — particularly Malaysia, Indonesia, and Thailand — are emerging as submarine cable landing destinations, each requiring new switch infrastructure to interconnect hyperscale tenants.

South America

Country Key Metric Key Driver
Brazil 62.3% of regional share Telecom modernization and fintech data centers
Argentina CAGR 8.20% Public-sector cloud migration
Rest of South America USD 0.36 Billion (2025) Mining and energy sector digitization


Brazil's Ethernet Switch Market benefits from Anatel's broadband expansion mandates and a thriving fintech sector that requires low-latency colocation infrastructure in São Paulo and Rio de Janeiro. Argentina's public-sector digitization efforts, though constrained by macroeconomic volatility, are gradually migrating government services onto modern campus networks.

Middle East & Africa

Country Key Metric Key Driver
Saudi Arabia 28.7% of regional share NEOM and Vision 2030 smart city projects
UAE CAGR 10.60% AI strategy and hyperscale hub ambitions
South Africa USD 0.38 Billion (2025) Financial services and mining network upgrades
Egypt 9.8% of regional share New Administrative Capital connectivity buildout
Rest of MEA CAGR 8.90% Mobile-first infrastructure leapfrogging


The Middle East and Africa Ethernet Switch Market is propelled by sovereign investment programs — Saudi Arabia's NEOM project alone envisions a fully connected cognitive city requiring tens of thousands of managed switch ports, while the UAE's national AI strategy positions Dubai and Abu Dhabi as regional hyperscale hubs [11]. South Africa's financial sector and Egypt's new capital city development are creating concentrated pockets of network infrastructure demand.


Ethernet Switch Market By Region, 2025-2035

Competitive Benchmarking

The Ethernet Switch Market exhibits moderate concentration, with the top five vendors capturing an estimated 65–70% of global revenue. Cisco Systems maintains the broadest portfolio coverage, from campus access to data center spine, while Arista Networks has carved a leadership position in cloud and AI networking. The competitive field has intensified as merchant silicon adoption enables smaller vendors to offer price-competitive alternatives, and open-source network operating systems lower the barrier to market entry. The estimated Herfindahl-Hirschman Index sits in the 1,200–1,500 range, consistent with a moderately concentrated structure.

Company Est. Revenue Share Range Key Offerings for the Ethernet Switch Market Strategic Positioning
Cisco Systems ~28–33% Catalyst, Nexus, Meraki Full-stack campus-to-cloud with subscription pivot
Arista Networks ~12–16% 7800R, 7060X, CloudVision Hyperscale and AI fabric specialist
Huawei Technologies ~8–11% CloudEngine series Dominant in China and emerging markets
HPE / Aruba ~6–9% CX series, Aruba Central Cloud-managed campus and branch
Juniper Networks ~5–8% QFX, EX series, Mist AI AI-driven campus and data center
Dell Technologies ~3–5% PowerSwitch, SmartFabric OS Integrated compute-storage-network
Extreme Networks ~2–4% ExtremeSwitching, ExtremeCloud IQ Mid-market cloud-managed specialist
NVIDIA (Spectrum) ~2–3% Spectrum-4, Cumulus Linux AI-optimized data center fabrics
Broadcom ~1–3% SONiC reference platforms, Memory Tomahawk ASICs Silicon and software ecosystem enabler
Netgear ~1–2% M4350, MS510 series SME and prosumer value segment


Recent News & Developments


  • Arista Networks (May, 2026)—Arista was named a Leader in the 2026 Magic Quadrant for Enterprise Wired and Wireless LAN Infrastructure for the first time.
  • Arista Networks (June, 2026)—Arista unveiled a new 1.6T rack-scale switch family specifically designed to support the demanding high-speed infrastructure requirements of AI-driven data center clusters.
  • HPE (June, 2026)—HPE launched a new suite of AI-focused networking products and agentic management tools, following its 2025 acquisition and integration of Juniper Networks.


Ethernet Switch Market Report Scope

Parameter Detail
Market Scope Global Ethernet Switch Market encompassing fixed and modular hardware, all port speeds, all management types, and all end-user verticals
Study Period 2021–2035
CAGR 9.40% (2026–2035)
Base Year Market Size USD 36.48 Billion (2025)
Forecast Year Market Size USD 89.62 Billion (2035)
Fastest Growing Segment 400 GbE and above (by port speed); Cloud and Data Center Providers (by end user); Asia-Pacific (by region)
Companies Profiled Cisco Systems, Arista Networks, Huawei Technologies, HPE/Aruba, Juniper Networks, Dell Technologies, Extreme Networks, NVIDIA, Broadcom, Netgear
Valuation Currency USD Billion


FAQs

How should procurement teams evaluate total cost of ownership when selecting Ethernet switches for a campus refresh?
Total cost of ownership extends well beyond the switch purchase price. Teams should model five-year licensing fees, PoE power draw, and management platform subscriptions against projected port utilization to surface hidden cost drivers [10].
What role does the Ultra Ethernet Consortium specification play in displacing InfiniBand for AI workloads?
The UEC specification standardizes lossless, congestion-aware Ethernet transport that matches InfiniBand's reliability guarantees at lower cost per port. Adoption is accelerating among hyperscalers building next-generation GPU clusters [12].
How are open-source network operating systems like SONiC changing vendor selection dynamics?
SONiC decouples hardware from software, letting buyers mix merchant-silicon switches from different vendors under a unified OS. This reduces lock-in risk but requires internal engineering capacity for integration and support [15].
What supply-chain risks should buyers monitor for high-speed Ethernet switch silicon?
Advanced switching ASICs rely on leading-edge foundry capacity concentrated in East Asia. Buyers should track TSMC and Samsung allocation cycles and consider multi-source silicon strategies to mitigate delivery delays [16].
How does Power-over-Ethernet budget planning differ for WiFi 7 versus WiFi 6E deployments?
WiFi 7 access points typically require 60–90 W per port under IEEE 802.3bt, roughly doubling the PoE load of WiFi 6E devices. Switch power supplies and cooling must be sized accordingly during planning [8].
What considerations apply when deploying Ethernet switches in industrial or outdoor edge environments?
Industrial edge deployments demand extended temperature ratings, conformal coating, and DIN-rail mounting. Buyers should verify compliance with IEC 61850 or IEEE 1613 standards for substation and utility applications [9].
How are leasing and network-as-a-service models reshaping Ethernet switch procurement for mid-market enterprises?
NaaS shifts switch procurement from capital to operational expenditure, bundling hardware, software, and support into monthly fees. Mid-market buyers gain access to current-generation equipment without large upfront outlays [10].    
Author
Author
Author Profile
Ankit Gupta LinkedIn
Team Lead - Research
Ankit Gupta is a seasoned market intelligence and strategic research professional with over six plus years of experience in the ICT and Semiconductor industries. With academic roots in Telecom, Marketing, and Electronics, he blends technical insight with business strategy. Ankit has led 200+ projects, including work for Fortune 500 clients like Microsoft and Rio Tinto, covering market sizing, tech forecasting, and go-to-market strategies. Known for bridging engineering and enterprise decision-making, his insights support growth, innovation, and investment planning across diverse technology markets.
Co-Author
Co-Author Profile
Shubham Munde LinkedIn
Team Lead - Research
Shubham brings over 7 years of expertise in Market Intelligence and Strategic Consulting, with a strong focus on the Automotive, Aerospace, and Defense sectors. Backed by a solid foundation in semiconductors, electronics, and software, he has successfully delivered high-impact syndicated and custom research on a global scale. His core strengths include market sizing, forecasting, competitive intelligence, consumer insights, and supply chain mapping. Widely recognized for developing scalable growth strategies, Shubham empowers clients to navigate complex markets and achieve a lasting competitive edge. Trusted by start-ups and Fortune 500 companies alike, he consistently converts challenges into strategic opportunities that drive sustainable growth.

Research Approach


Secondary Research

The secondary research process involved comprehensive analysis of regulatory databases, industry standards repositories, peer-reviewed technology journals, and authoritative telecommunications organizations. Key sources included the Institute of Electrical and Electronics Engineers (IEEE), Internet Engineering Task Force (IETF), International Telecommunication Union (ITU), Telecommunications Industry Association (TIA), U.S. Department of Commerce (Bureau of Industry and Security), National Institute of Standards and Technology (NIST), Federal Communications Commission (FCC), European Telecommunications Standards Institute (ETSI), U.S. Census Bureau (Technology Sector Data), Eurostat (ICT Statistics), National Centers for Information and Communications Technology (NICT, Japan), Ministry of Industry and Information Technology (MIIT, China), Organisation for Economic Co-operation and Development (OECD) Digital Economy Outlook and World Bank Digital Development Reports Quarterly Ethernet Switch Trackers. These sources were used to collect network infrastructure deployment statistics, standards compliance data, enterprise connectivity trends, import/export trade data for networking equipment, and market landscape analysis for Modular Ethernet switches, Fixed Configuration switches, Managed L2/L3 switches, Smart Switches, and Unmanaged Switches across 100MbE/1GbE, 10GbE, 40GbE, and 100GbE port configurations.


Primary Research

Qualitative and quantitative insights were obtained by interviewing supply-side and demand-side stakeholders during the primary research process. Supply-side sources comprised CEOs, CTOs, VPs of Product Management, VPs of Hardware Engineering, regulatory compliance chiefs, and supply chain directors from Ethernet switch manufacturers, semiconductor component suppliers, and ODM/OEM partners. Chief Information Officers (CIOs), network infrastructure directors, data center managers, IT procurement leads from enterprises, telecommunications carriers, cloud service providers, and system integrators from the manufacturing, healthcare, financial services, and government sectors comprised demand-side sources. Market segmentation was validated by primary research, which also confirmed product development roadmaps and 400GbE/800GbE transition timelines, and gathered insights on enterprise adoption patterns, pricing strategies for cloud vs. enterprise deployments, and supply chain localization dynamics. Product type and switching port speeds were also considered.

Primary Respondent Breakdown:

By Designation: C-level Primaries (32%), Director Level (31%), Others (37%)

By Region: North America (38%), Europe (25%), Asia-Pacific (28%), Rest of World (9%)


Market Size Estimation

Global market valuation was derived through revenue mapping and unit shipment analysis. The methodology included:

Identification of 55+ key manufacturers and ODMs across North America, Europe, Asia-Pacific, and Latin America

Product mapping across Modular Ethernet switches, Fixed Configuration switches, Managed L2/L3 switches, Smart Switches, and Unmanaged Switches

Port speed segmentation analysis across 100MbE/1GbE, 10GbE, 40GbE, 100GbE, and emerging 400GbE categories

Analysis of reported and modeled annual revenues specific to Ethernet switch product lines and merchant silicon switch revenues

Coverage of manufacturers and ODMs representing 75-80% of global market share in 2024

Extrapolation using bottom-up (port shipments × ASP by port speed and region) and top-down (manufacturer revenue validation and semiconductor supplier data cross-reference) approaches to derive segment-specific valuations for data center, enterprise campus, and service provider deployment scenarios

Download Free Sample

Kindly complete the form below to receive a free sample of this Report

Download PDF ×

We do not share your information with anyone. However, we may send you emails based on your report interest from time to time. You may contact us at any time to opt-out.
















