Request Free Sample ×

Kindly complete the form below to receive a free sample of this Report

* Please use a valid business email

Leading companies partner with us for data-driven Insights

clients tt-cursor
Hero Background

Europe Intelligent Traffic Management System Market

ID: MRFR/AT/54921-HCR
200 Pages
Triveni Bhoyar
Last Updated: February 06, 2026
Europe Intelligent Traffic Management System Market Research Report By Component (Hardware, Software, Services), By Solution (Traffic Signal Control, Traffic Analytics, Vehicle Tracking, Incident Detection), By Application (Urban Traffic Management, Highway Traffic Management, Public Transport Management, Emergency Vehicle Management), By End Use (Government, Transportation Agencies, Smart City Projects) and By Regional (Germany, UK, France, Russia, Italy, Spain, Rest of Europe) - Forecast to 2035
Download PDF ×

We do not share your information with anyone. However, we may send you emails based on your report interest from time to time. You may contact us at any time to opt-out.

  1. 1 SECTION I: EXECUTIVE SUMMARY AND KEY HIGHLIGHTS
    1. 1.1 EXECUTIVE SUMMARY
      1. 1.1.1 Market Overview
      2. 1.1.2 Key Findings
      3. 1.1.3 Market Segmentation
      4. 1.1.4 Competitive Landscape
      5. 1.1.5 Challenges and Opportunities
      6. 1.1.6 Future Outlook
  2. 2 SECTION II: SCOPING, METHODOLOGY AND MARKET STRUCTURE
    1. 2.1 MARKET INTRODUCTION
      1. 2.1.1 Definition
      2. 2.1.2 Scope of the study
        1. 2.1.2.1 Research Objective
        2. 2.1.2.2 Assumption
        3. 2.1.2.3 Limitations
    2. 2.2 RESEARCH METHODOLOGY
      1. 2.2.1 Overview
      2. 2.2.2 Data Mining
      3. 2.2.3 Secondary Research
      4. 2.2.4 Primary Research
        1. 2.2.4.1 Primary Interviews and Information Gathering Process
        2. 2.2.4.2 Breakdown of Primary Respondents
      5. 2.2.5 Forecasting Model
      6. 2.2.6 Market Size Estimation
        1. 2.2.6.1 Bottom-Up Approach
        2. 2.2.6.2 Top-Down Approach
      7. 2.2.7 Data Triangulation
      8. 2.2.8 Validation
  3. 3 SECTION III: QUALITATIVE ANALYSIS
    1. 3.1 MARKET DYNAMICS
      1. 3.1.1 Overview
      2. 3.1.2 Drivers
      3. 3.1.3 Restraints
      4. 3.1.4 Opportunities
    2. 3.2 MARKET FACTOR ANALYSIS
      1. 3.2.1 Value chain Analysis
      2. 3.2.2 Porter's Five Forces Analysis
        1. 3.2.2.1 Bargaining Power of Suppliers
        2. 3.2.2.2 Bargaining Power of Buyers
        3. 3.2.2.3 Threat of New Entrants
        4. 3.2.2.4 Threat of Substitutes
        5. 3.2.2.5 Intensity of Rivalry
      3. 3.2.3 COVID-19 Impact Analysis
        1. 3.2.3.1 Market Impact Analysis
        2. 3.2.3.2 Regional Impact
        3. 3.2.3.3 Opportunity and Threat Analysis
  4. 4 SECTION IV: QUANTITATIVE ANALYSIS
    1. 4.1 Automobile, BY Application (USD Billion)
      1. 4.1.1 Traffic Management
      2. 4.1.2 Traffic Monitoring
      3. 4.1.3 Traffic Control
      4. 4.1.4 Incident Management
      5. 4.1.5 Parking Management
    2. 4.2 Automobile, BY End Use (USD Billion)
      1. 4.2.1 Government
      2. 4.2.2 Transportation
      3. 4.2.3 Logistics
      4. 4.2.4 Public Safety
      5. 4.2.5 Smart Cities
    3. 4.3 Automobile, BY Technology (USD Billion)
      1. 4.3.1 Artificial Intelligence
      2. 4.3.2 Internet of Things
      3. 4.3.3 Cloud Computing
      4. 4.3.4 Big Data Analytics
      5. 4.3.5 Machine Learning
    4. 4.4 Automobile, BY Component (USD Billion)
      1. 4.4.1 Hardware
      2. 4.4.2 Software
      3. 4.4.3 Services
      4. 4.4.4 Communication Systems
      5. 4.4.5 Data Analytics Tools
  5. 5 SECTION V: COMPETITIVE ANALYSIS
    1. 5.1 Competitive Landscape
      1. 5.1.1 Overview
      2. 5.1.2 Competitive Analysis
      3. 5.1.3 Market share Analysis
      4. 5.1.4 Major Growth Strategy in the Automobile
      5. 5.1.5 Competitive Benchmarking
      6. 5.1.6 Leading Players in Terms of Number of Developments in the Automobile
      7. 5.1.7 Key developments and growth strategies
        1. 5.1.7.1 New Product Launch/Service Deployment
        2. 5.1.7.2 Merger & Acquisitions
        3. 5.1.7.3 Joint Ventures
      8. 5.1.8 Major Players Financial Matrix
        1. 5.1.8.1 Sales and Operating Income
        2. 5.1.8.2 Major Players R&D Expenditure. 2023
    2. 5.2 Company Profiles
      1. 5.2.1 Siemens (DE)
        1. 5.2.1.1 Financial Overview
        2. 5.2.1.2 Products Offered
        3. 5.2.1.3 Key Developments
        4. 5.2.1.4 SWOT Analysis
        5. 5.2.1.5 Key Strategies
      2. 5.2.2 Kapsch TrafficCom (AT)
        1. 5.2.2.1 Financial Overview
        2. 5.2.2.2 Products Offered
        3. 5.2.2.3 Key Developments
        4. 5.2.2.4 SWOT Analysis
        5. 5.2.2.5 Key Strategies
      3. 5.2.3 Thales Group (FR)
        1. 5.2.3.1 Financial Overview
        2. 5.2.3.2 Products Offered
        3. 5.2.3.3 Key Developments
        4. 5.2.3.4 SWOT Analysis
        5. 5.2.3.5 Key Strategies
      4. 5.2.4 Cubic Corporation (US)
        1. 5.2.4.1 Financial Overview
        2. 5.2.4.2 Products Offered
        3. 5.2.4.3 Key Developments
        4. 5.2.4.4 SWOT Analysis
        5. 5.2.4.5 Key Strategies
      5. 5.2.5 Civitas (IT)
        1. 5.2.5.1 Financial Overview
        2. 5.2.5.2 Products Offered
        3. 5.2.5.3 Key Developments
        4. 5.2.5.4 SWOT Analysis
        5. 5.2.5.5 Key Strategies
      6. 5.2.6 Cetra (FR)
        1. 5.2.6.1 Financial Overview
        2. 5.2.6.2 Products Offered
        3. 5.2.6.3 Key Developments
        4. 5.2.6.4 SWOT Analysis
        5. 5.2.6.5 Key Strategies
      7. 5.2.7 Cubic Transportation Systems (GB)
        1. 5.2.7.1 Financial Overview
        2. 5.2.7.2 Products Offered
        3. 5.2.7.3 Key Developments
        4. 5.2.7.4 SWOT Analysis
        5. 5.2.7.5 Key Strategies
      8. 5.2.8 Civitas Solutions (ES)
        1. 5.2.8.1 Financial Overview
        2. 5.2.8.2 Products Offered
        3. 5.2.8.3 Key Developments
        4. 5.2.8.4 SWOT Analysis
        5. 5.2.8.5 Key Strategies
      9. 5.2.9 Indra Sistemas (ES)
        1. 5.2.9.1 Financial Overview
        2. 5.2.9.2 Products Offered
        3. 5.2.9.3 Key Developments
        4. 5.2.9.4 SWOT Analysis
        5. 5.2.9.5 Key Strategies
    3. 5.3 Appendix
      1. 5.3.1 References
      2. 5.3.2 Related Reports
  6. 6 LIST OF FIGURES
    1. 6.1 MARKET SYNOPSIS
    2. 6.2 EUROPE MARKET ANALYSIS BY APPLICATION
    3. 6.3 EUROPE MARKET ANALYSIS BY END USE
    4. 6.4 EUROPE MARKET ANALYSIS BY TECHNOLOGY
    5. 6.5 EUROPE MARKET ANALYSIS BY COMPONENT
    6. 6.6 KEY BUYING CRITERIA OF AUTOMOBILE
    7. 6.7 RESEARCH PROCESS OF MRFR
    8. 6.8 DRO ANALYSIS OF AUTOMOBILE
    9. 6.9 DRIVERS IMPACT ANALYSIS: AUTOMOBILE
    10. 6.10 RESTRAINTS IMPACT ANALYSIS: AUTOMOBILE
    11. 6.11 SUPPLY / VALUE CHAIN: AUTOMOBILE
    12. 6.12 AUTOMOBILE, BY APPLICATION, 2024 (% SHARE)
    13. 6.13 AUTOMOBILE, BY APPLICATION, 2024 TO 2035 (USD Billion)
    14. 6.14 AUTOMOBILE, BY END USE, 2024 (% SHARE)
    15. 6.15 AUTOMOBILE, BY END USE, 2024 TO 2035 (USD Billion)
    16. 6.16 AUTOMOBILE, BY TECHNOLOGY, 2024 (% SHARE)
    17. 6.17 AUTOMOBILE, BY TECHNOLOGY, 2024 TO 2035 (USD Billion)
    18. 6.18 AUTOMOBILE, BY COMPONENT, 2024 (% SHARE)
    19. 6.19 AUTOMOBILE, BY COMPONENT, 2024 TO 2035 (USD Billion)
    20. 6.20 BENCHMARKING OF MAJOR COMPETITORS
  7. 7 LIST OF TABLES
    1. 7.1 LIST OF ASSUMPTIONS
  8. 7.1.1
    1. 7.2 Europe MARKET SIZE ESTIMATES; FORECAST
      1. 7.2.1 BY APPLICATION, 2026-2035 (USD Billion)
      2. 7.2.2 BY END USE, 2026-2035 (USD Billion)
      3. 7.2.3 BY TECHNOLOGY, 2026-2035 (USD Billion)
      4. 7.2.4 BY COMPONENT, 2026-2035 (USD Billion)
    2. 7.3 PRODUCT LAUNCH/PRODUCT DEVELOPMENT/APPROVAL
  9. 7.3.1
    1. 7.4 ACQUISITION/PARTNERSHIP
  10. 7.4.1

Europe Automobile Market Segmentation

Automobile By Application (USD Billion, 2022-2035)
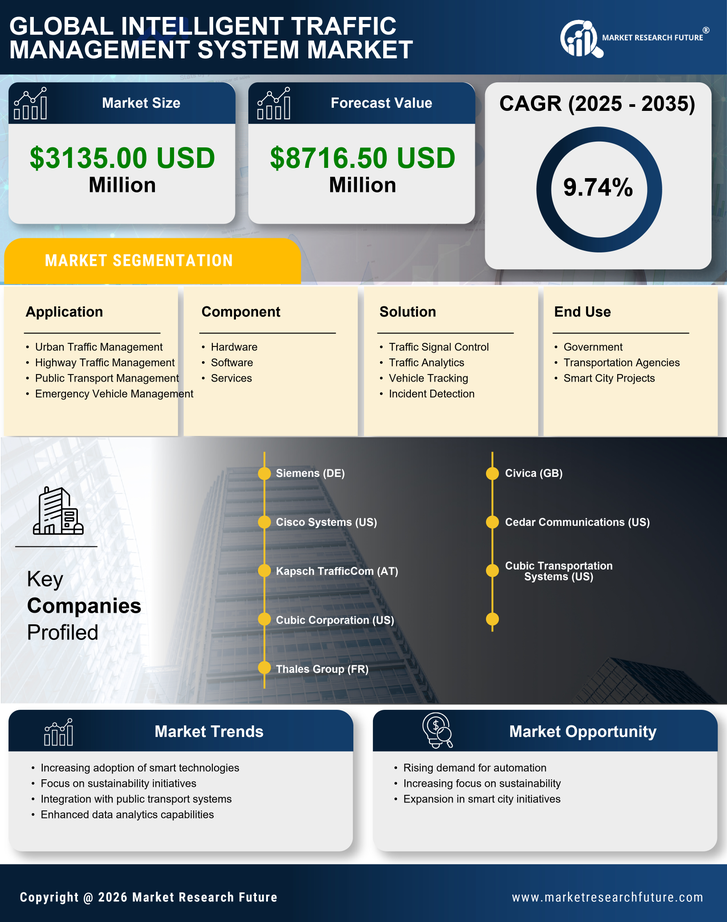
  • Traffic Management
  • Traffic Monitoring
  • Traffic Control
  • Incident Management
  • Parking Management

Automobile By End Use (USD Billion, 2022-2035)

  • Government
  • Transportation
  • Logistics
  • Public Safety
  • Smart Cities

Automobile By Technology (USD Billion, 2022-2035)

  • Artificial Intelligence
  • Internet of Things
  • Cloud Computing
  • Big Data Analytics
  • Machine Learning

Automobile By Component (USD Billion, 2022-2035)

  • Hardware
  • Software
  • Services
  • Communication Systems
  • Data Analytics Tools