Europe Passive Authentication Market Segmentation
Europe Passive Authentication Market By Application (USD Million, 2022-2035)
- Identity Verification
- Fraud Detection
- Access Control
- User Authentication
Europe Passive Authentication Market By End Use (USD Million, 2022-2035)
- Banking
- Europe Passive Authentication Market
- Retail
- Government
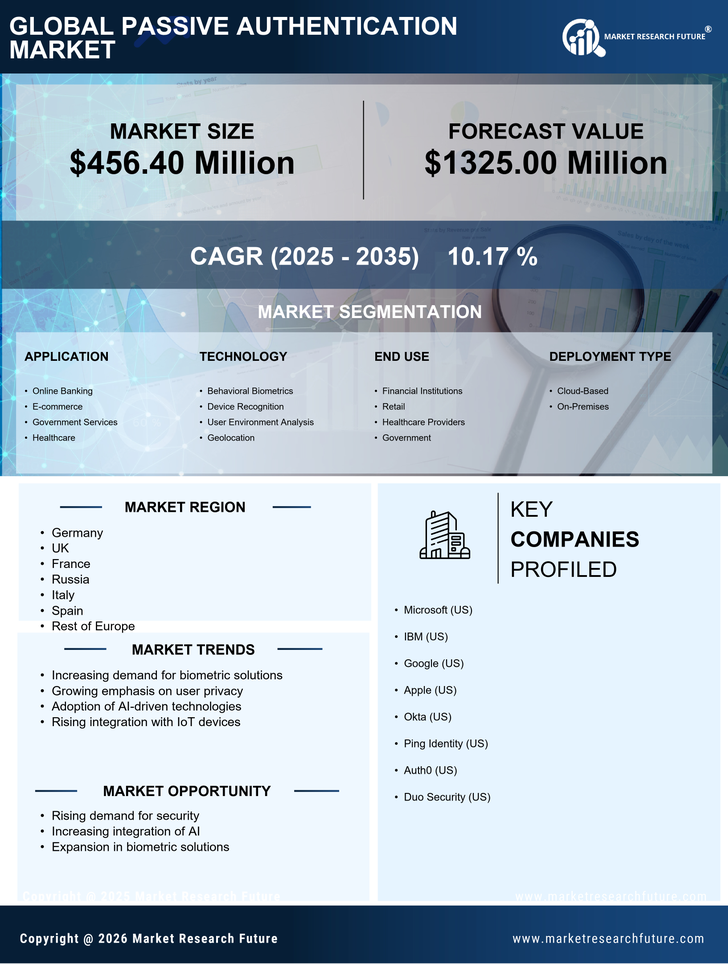
Europe Passive Authentication Market By Technology (USD Million, 2022-2035)
- Biometric Authentication
- Behavioral Analytics
- Device Recognition
- Geolocation
Europe Passive Authentication Market By Deployment Type (USD Million, 2022-2035)
- Cloud-Based
- On-Premises
- Hybrid
Europe Passive Authentication Market By User Type (USD Million, 2022-2035)
- Individual Users
- Small and Medium Enterprises
- Large Enterprises