Request Free Sample ×

Kindly complete the form below to receive a free sample of this Report

* Please use a valid business email

Leading companies partner with us for data-driven Insights

clients tt-cursor
Hero Background

Europe Self Healing Networks Market

ID: MRFR/ICT/63391-HCR
200 Pages
Ankit Gupta
Last Updated: February 06, 2026
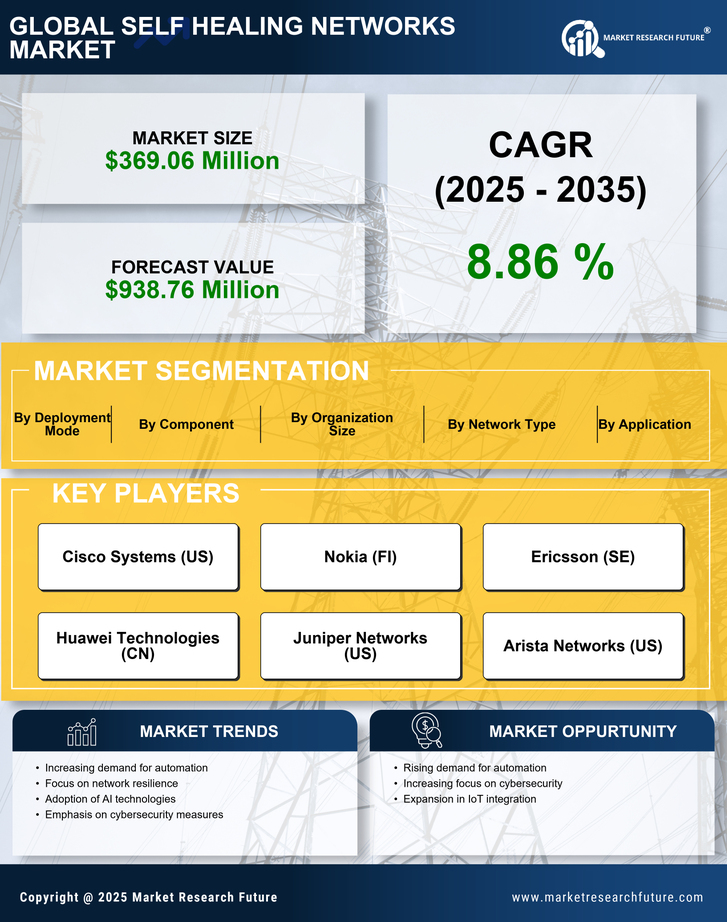
Europe Self-Healing Networks Market Size, Share and Research Report: By Component (Solutions, Services), By Network Type (Physical, Virtual, Hybrid), By Organization Size (Large Enterprises, SMEs), By Deployment Mode (On-premises, Cloud), By Application (Network Provisioning, Network Bandwidth Monitoring, Security Compliance Management, Root Cause Analysis, Network Management), By Verticals (ITES, BFSI, Media and Entertainment, Healthcare and Life Sciences, Telecom, Retail and Consumer Goods, Education) and By Regional (Germany, UK, France, Russia, Italy, Spain, Rest of Europe)- Industry Forecast to 2035
Download PDF ×

We do not share your information with anyone. However, we may send you emails based on your report interest from time to time. You may contact us at any time to opt-out.

  1. 1 SECTION I: EXECUTIVE SUMMARY AND KEY HIGHLIGHTS
    1. 1.1 EXECUTIVE SUMMARY
      1. 1.1.1 Market Overview
      2. 1.1.2 Key Findings
      3. 1.1.3 Market Segmentation
      4. 1.1.4 Competitive Landscape
      5. 1.1.5 Challenges and Opportunities
      6. 1.1.6 Future Outlook
  2. 2 SECTION II: SCOPING, METHODOLOGY AND MARKET STRUCTURE
    1. 2.1 MARKET INTRODUCTION
      1. 2.1.1 Definition
      2. 2.1.2 Scope of the study
        1. 2.1.2.1 Research Objective
        2. 2.1.2.2 Assumption
        3. 2.1.2.3 Limitations
    2. 2.2 RESEARCH METHODOLOGY
      1. 2.2.1 Overview
      2. 2.2.2 Data Mining
      3. 2.2.3 Secondary Research
      4. 2.2.4 Primary Research
        1. 2.2.4.1 Primary Interviews and Information Gathering Process
        2. 2.2.4.2 Breakdown of Primary Respondents
      5. 2.2.5 Forecasting Model
      6. 2.2.6 Market Size Estimation
        1. 2.2.6.1 Bottom-Up Approach
        2. 2.2.6.2 Top-Down Approach
      7. 2.2.7 Data Triangulation
      8. 2.2.8 Validation
  3. 3 SECTION III: QUALITATIVE ANALYSIS
    1. 3.1 MARKET DYNAMICS
      1. 3.1.1 Overview
      2. 3.1.2 Drivers
      3. 3.1.3 Restraints
      4. 3.1.4 Opportunities
    2. 3.2 MARKET FACTOR ANALYSIS
      1. 3.2.1 Value chain Analysis
      2. 3.2.2 Porter's Five Forces Analysis
        1. 3.2.2.1 Bargaining Power of Suppliers
        2. 3.2.2.2 Bargaining Power of Buyers
        3. 3.2.2.3 Threat of New Entrants
        4. 3.2.2.4 Threat of Substitutes
        5. 3.2.2.5 Intensity of Rivalry
      3. 3.2.3 COVID-19 Impact Analysis
        1. 3.2.3.1 Market Impact Analysis
        2. 3.2.3.2 Regional Impact
        3. 3.2.3.3 Opportunity and Threat Analysis
  4. 4 SECTION IV: QUANTITATIVE ANALYSIS
    1. 4.1 Information and Communications Technology, BY Application (USD Million)
      1. 4.1.1 Telecommunications
      2. 4.1.2 Smart Grids
      3. 4.1.3 Transportation
      4. 4.1.4 Healthcare
      5. 4.1.5 Industrial Automation
    2. 4.2 Information and Communications Technology, BY End Use (USD Million)
      1. 4.2.1 Utilities
      2. 4.2.2 Manufacturing
      3. 4.2.3 Transportation
      4. 4.2.4 Healthcare
      5. 4.2.5 Telecommunications
    3. 4.3 Information and Communications Technology, BY Technology (USD Million)
      1. 4.3.1 Artificial Intelligence
      2. 4.3.2 Machine Learning
      3. 4.3.3 Internet of Things
      4. 4.3.4 Big Data Analytics
      5. 4.3.5 Cloud Computing
    4. 4.4 Information and Communications Technology, BY Network Type (USD Million)
      1. 4.4.1 Wireless Networks
      2. 4.4.2 Wired Networks
      3. 4.4.3 Hybrid Networks
      4. 4.4.4 Sensor Networks
      5. 4.4.5 Mesh Networks
  5. 5 SECTION V: COMPETITIVE ANALYSIS
    1. 5.1 Competitive Landscape
      1. 5.1.1 Overview
      2. 5.1.2 Competitive Analysis
      3. 5.1.3 Market share Analysis
      4. 5.1.4 Major Growth Strategy in the Information and Communications Technology
      5. 5.1.5 Competitive Benchmarking
      6. 5.1.6 Leading Players in Terms of Number of Developments in the Information and Communications Technology
      7. 5.1.7 Key developments and growth strategies
        1. 5.1.7.1 New Product Launch/Service Deployment
        2. 5.1.7.2 Merger & Acquisitions
        3. 5.1.7.3 Joint Ventures
      8. 5.1.8 Major Players Financial Matrix
        1. 5.1.8.1 Sales and Operating Income
        2. 5.1.8.2 Major Players R&D Expenditure. 2023
    2. 5.2 Company Profiles
      1. 5.2.1 Cisco Systems (US)
        1. 5.2.1.1 Financial Overview
        2. 5.2.1.2 Products Offered
        3. 5.2.1.3 Key Developments
        4. 5.2.1.4 SWOT Analysis
        5. 5.2.1.5 Key Strategies
      2. 5.2.2 Nokia (FI)
        1. 5.2.2.1 Financial Overview
        2. 5.2.2.2 Products Offered
        3. 5.2.2.3 Key Developments
        4. 5.2.2.4 SWOT Analysis
        5. 5.2.2.5 Key Strategies
      3. 5.2.3 Ericsson (SE)
        1. 5.2.3.1 Financial Overview
        2. 5.2.3.2 Products Offered
        3. 5.2.3.3 Key Developments
        4. 5.2.3.4 SWOT Analysis
        5. 5.2.3.5 Key Strategies
      4. 5.2.4 Siemens (DE)
        1. 5.2.4.1 Financial Overview
        2. 5.2.4.2 Products Offered
        3. 5.2.4.3 Key Developments
        4. 5.2.4.4 SWOT Analysis
        5. 5.2.4.5 Key Strategies
      5. 5.2.5 Huawei Technologies (CN)
        1. 5.2.5.1 Financial Overview
        2. 5.2.5.2 Products Offered
        3. 5.2.5.3 Key Developments
        4. 5.2.5.4 SWOT Analysis
        5. 5.2.5.5 Key Strategies
      6. 5.2.6 IBM (US)
        1. 5.2.6.1 Financial Overview
        2. 5.2.6.2 Products Offered
        3. 5.2.6.3 Key Developments
        4. 5.2.6.4 SWOT Analysis
        5. 5.2.6.5 Key Strategies
      7. 5.2.7 Juniper Networks (US)
        1. 5.2.7.1 Financial Overview
        2. 5.2.7.2 Products Offered
        3. 5.2.7.3 Key Developments
        4. 5.2.7.4 SWOT Analysis
        5. 5.2.7.5 Key Strategies
      8. 5.2.8 ZTE Corporation (CN)
        1. 5.2.8.1 Financial Overview
        2. 5.2.8.2 Products Offered
        3. 5.2.8.3 Key Developments
        4. 5.2.8.4 SWOT Analysis
        5. 5.2.8.5 Key Strategies
      9. 5.2.9 Alcatel-Lucent (FR)
        1. 5.2.9.1 Financial Overview
        2. 5.2.9.2 Products Offered
        3. 5.2.9.3 Key Developments
        4. 5.2.9.4 SWOT Analysis
        5. 5.2.9.5 Key Strategies
    3. 5.3 Appendix
      1. 5.3.1 References
      2. 5.3.2 Related Reports
  6. 6 LIST OF FIGURES
    1. 6.1 MARKET SYNOPSIS
    2. 6.2 EUROPE MARKET ANALYSIS BY APPLICATION
    3. 6.3 EUROPE MARKET ANALYSIS BY END USE
    4. 6.4 EUROPE MARKET ANALYSIS BY TECHNOLOGY
    5. 6.5 EUROPE MARKET ANALYSIS BY NETWORK TYPE
    6. 6.6 KEY BUYING CRITERIA OF INFORMATION AND COMMUNICATIONS TECHNOLOGY
    7. 6.7 RESEARCH PROCESS OF MRFR
    8. 6.8 DRO ANALYSIS OF INFORMATION AND COMMUNICATIONS TECHNOLOGY
    9. 6.9 DRIVERS IMPACT ANALYSIS: INFORMATION AND COMMUNICATIONS TECHNOLOGY
    10. 6.10 RESTRAINTS IMPACT ANALYSIS: INFORMATION AND COMMUNICATIONS TECHNOLOGY
    11. 6.11 SUPPLY / VALUE CHAIN: INFORMATION AND COMMUNICATIONS TECHNOLOGY
    12. 6.12 INFORMATION AND COMMUNICATIONS TECHNOLOGY, BY APPLICATION, 2024 (% SHARE)
    13. 6.13 INFORMATION AND COMMUNICATIONS TECHNOLOGY, BY APPLICATION, 2024 TO 2035 (USD Million)
    14. 6.14 INFORMATION AND COMMUNICATIONS TECHNOLOGY, BY END USE, 2024 (% SHARE)
    15. 6.15 INFORMATION AND COMMUNICATIONS TECHNOLOGY, BY END USE, 2024 TO 2035 (USD Million)
    16. 6.16 INFORMATION AND COMMUNICATIONS TECHNOLOGY, BY TECHNOLOGY, 2024 (% SHARE)
    17. 6.17 INFORMATION AND COMMUNICATIONS TECHNOLOGY, BY TECHNOLOGY, 2024 TO 2035 (USD Million)
    18. 6.18 INFORMATION AND COMMUNICATIONS TECHNOLOGY, BY NETWORK TYPE, 2024 (% SHARE)
    19. 6.19 INFORMATION AND COMMUNICATIONS TECHNOLOGY, BY NETWORK TYPE, 2024 TO 2035 (USD Million)
    20. 6.20 BENCHMARKING OF MAJOR COMPETITORS
  7. 7 LIST OF TABLES
    1. 7.1 LIST OF ASSUMPTIONS
  8. 7.1.1
    1. 7.2 Europe MARKET SIZE ESTIMATES; FORECAST
      1. 7.2.1 BY APPLICATION, 2026-2035 (USD Million)
      2. 7.2.2 BY END USE, 2026-2035 (USD Million)
      3. 7.2.3 BY TECHNOLOGY, 2026-2035 (USD Million)
      4. 7.2.4 BY NETWORK TYPE, 2026-2035 (USD Million)
    2. 7.3 PRODUCT LAUNCH/PRODUCT DEVELOPMENT/APPROVAL
  9. 7.3.1
    1. 7.4 ACQUISITION/PARTNERSHIP
  10. 7.4.1

Europe Information and Communications Technology Market Segmentation

Information and Communications Technology By Application (USD Million, 2022-2035)

  • Telecommunications
  • Smart Grids
  • Transportation
  • Healthcare
  • Industrial Automation

Information and Communications Technology By End Use (USD Million, 2022-2035)

  • Utilities
  • Manufacturing
  • Transportation
  • Healthcare
  • Telecommunications

Information and Communications Technology By Technology (USD Million, 2022-2035)

  • Artificial Intelligence
  • Machine Learning
  • Internet of Things
  • Big Data Analytics
  • Cloud Computing

Information and Communications Technology By Network Type (USD Million, 2022-2035)

  • Wireless Networks
  • Wired Networks
  • Hybrid Networks
  • Sensor Networks
  • Mesh Networks