• Cat-intel
  • MedIntelliX
  • Resources
  • About Us
  • Hero Background
    English
    Chinese
    French
    Japanese
    Korean
    German
    Spanish

    Feed Flavors Sweeteners Market Share

    ID: MRFR/AGR/3959-HCR
    90 Pages
    Tejas Chaudhary
    October 2025

    Feed Flavors and Sweeteners Market Research Report Information By Source (Natural and Synthetic), By Form (Dry and Liquid), By Livestock (Ruminants, Swine, Pets, and Others), And By Region (North America, Europe, Asia-Pacific, And Rest Of The World) –Market Forecast Till 2035

    Share:
    Download PDF ×

    We do not share your information with anyone. However, we may send you emails based on your report interest from time to time. You may contact us at any time to opt-out.

    Feed Flavors Sweeteners Market Infographic
    $ 4,950.0
    $ 5,950.0
    $ 7,250.0

    Market Share

    Feed Flavors Sweeteners Market Share Analysis

    Feed Flavors and Sweeteners Market has seen considerable developments and changes over the years, reflecting changing trends within the animal feed industry. One such significant trend that is shifting this market is the increasing desire to make feeds more palatable. The demand for additives intended to improve the taste of commercial feeds has gone up as more people continue learning about nutrients essential for their animals. The latter sweeteners not only hide undesirable tastes from certain ingredients but also lure animals into consuming more food, thus improving overall health and performance. Another key trend of the market is the adoption of natural and sustainable feeding additives. Consumers with an increased knowledge on environmental effects due to industrialization are insisting on feed flavors and sweeteners obtained from nature. Therefore, producers are responding through creation of products made out of plant extracts, herbal ingredient based ones among others. This move matches the broader aspiration towards sustainable farming practices in relation to environment that can be observed within agro and husbandry sectors. Technological advancements have also affected the direction of the feed flavors and sweeteners market. The application of new processing methods, development of novel formulations has produced products with improved stability, efficacy and safety. This technological advancement guarantees that consistency in quality of feed additives which is made possible by customization, a factor that allows manufacturers to tune their products towards particular animal species’ preferences and nutritional needs. The global feed flavors and sweeteners market is expected to grow at a significant Compound Annual Growth Rate (CAGR) due to increasing demand for feed additives improving palatability as well as consumers’ awareness regarding meat quality. High-quality meat products are increasingly sought after by global consumers who base their decisions on nutritional values. The Food and Agriculture Organization (FAO) estimates that animals provide about 33% of the protein consumed by humans and approximately 16% of dietary energy. Furthermore, income growth, urbanization, changes in lifestyle are some of the factors influencing premium food demand. Consideration for high-quality food items has increased among customers as they become more aware about what they eat. There is an enormous emphasis on producing superior healthy livestock hence creating an increase in demand for highly palatable feeds. These factors are anticipated to boost the demand for feed flavors and sweeteners in subsequent years.

    Market Summary

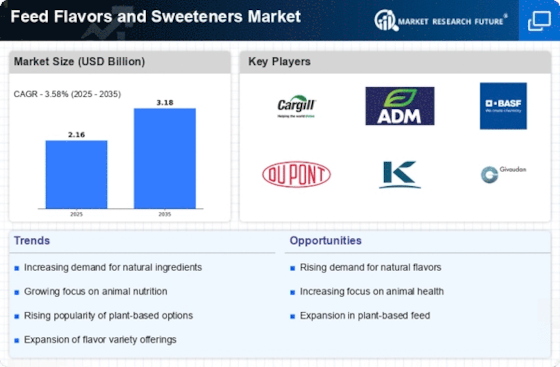
    The Global Feed Flavors and Sweeteners Market is projected to grow from 2.16 USD Billion in 2024 to 3.18 USD Billion by 2035.

    Key Market Trends & Highlights

    Feed Flavors and Sweeteners Key Trends and Highlights

    • The market is expected to experience a compound annual growth rate of 3.61 percent from 2025 to 2035.
    • By 2035, the market valuation is anticipated to reach 3.19 USD Billion, indicating robust growth potential.
    • in 2024, the market is valued at 2.16 USD Billion, laying a strong foundation for future expansion.
    • Growing adoption of innovative feed formulations due to increasing demand for high-quality animal nutrition is a major market driver.

    Market Size & Forecast

    2024 Market Size 2.16 (USD Billion)
    2035 Market Size 3.18 (USD Billion)
    CAGR (2025-2035) 3.58%
    Largest Regional Market Share in 2024 latin_america)

    Major Players

    Solvay (Belgium), Grupo Ferrer Internacional S.A. (Spain), Pancosma (Switzerland), Nutriad (Belgium), FeedStimulants (Netherlands), Alltech (US), DuPont (US), BIOMIN Holding (Austria), Prinova Group LLC (US), Norel (Spain)

    Market Trends

    Rising awareness of consumers towards quality meat products to drive market growth

    The primary factors projected to drive the feed flavors and sweeteners market CAGR are increasing demands for palatability-boosting feed additives and rising consumer awareness of quality meat products. Consumers worldwide are increasingly seeking high-quality meat as they become more aware of the nutritional dynamics of these goods. Animals supply nearly 33% of the protein consumed in human diets and approximately 16% of food energy, according to the Food and Agriculture Organization (FAO). Moreover, income growth, urbanization, and lifestyle changes influence the demand for high-quality food.

    Consumers are becoming more conscious of the quality of food they consume and the advantages linked with food goods. As a result, producing healthy and high-quality livestock has become critical, resulting in a surge in demand for high-quality feed with improved palatability. Thus, flavors and sweeteners are expected to be in high demand in the next years.

    Government agencies such as the United States Food & Drug Administration (USFDA) and the European Food Safety Authority have enforced standards governing the quality of food distributed to customers. Meat composition, fat content, color, flavor, and protein content are some of the factors that define meat quality, according to the FDA. As a result, several husbandries and commercial farms are reporting a high need for effective and palatability-enhancing feed components in order to meet these quality criteria and produce healthy cattle.

    As a result, an increasing number of standardized husbandries and commercial farms are expected to create new potential for feed flavors and sweeteners market revenue.

    The increasing demand for palatable feed products is driving innovation in flavoring and sweetening agents, which are essential for enhancing animal feed acceptance and performance.

    U.S. Department of Agriculture (USDA)

    Feed Flavors Sweeteners Market Market Drivers

    Focus on Feed Efficiency

    The Global Feed Flavors and Sweeteners Market Industry is increasingly focused on improving feed efficiency among livestock. Producers are recognizing that enhancing feed palatability through flavors and sweeteners can lead to better feed conversion ratios, ultimately reducing costs and improving profitability. This focus aligns with the industry's broader goals of sustainability and resource optimization. As the market evolves, the integration of innovative flavoring and sweetening agents is likely to play a pivotal role in achieving these objectives. The potential for improved feed efficiency is a key driver for the industry's growth.

    Market Trends and Projections

    Expansion of Livestock Production

    The Global Feed Flavors and Sweeteners Market Industry is significantly influenced by the expansion of livestock production across various regions. As the global population increases, the demand for meat, dairy, and eggs rises, prompting producers to enhance feed formulations. This expansion is particularly evident in developing countries, where livestock farming is becoming more intensive. The market is expected to grow at a CAGR of 3.61% from 2025 to 2035, indicating a sustained interest in improving feed quality through flavors and sweeteners. This growth is crucial for meeting the nutritional needs of a growing population.

    Rising Demand for Animal Nutrition

    The Global Feed Flavors and Sweeteners Market Industry experiences a notable increase in demand for animal nutrition products. As livestock producers seek to enhance feed palatability and improve animal performance, the incorporation of flavors and sweeteners becomes essential. This trend is driven by the growing awareness of the importance of nutrition in livestock health and productivity. In 2024, the market is projected to reach 2.16 USD Billion, reflecting a robust interest in optimizing feed formulations. The emphasis on quality animal nutrition is likely to continue, supporting the industry's growth trajectory.

    Regulatory Support for Feed Additives

    The Global Feed Flavors and Sweeteners Market Industry benefits from regulatory support that encourages the use of feed additives, including flavors and sweeteners. Governments and regulatory bodies are increasingly recognizing the role of these additives in enhancing animal health and welfare. This support is crucial for fostering innovation and ensuring that producers have access to safe and effective products. As regulations evolve, the market is likely to see an influx of new flavoring and sweetening solutions that meet stringent safety standards. This regulatory environment is expected to bolster the industry's growth prospects.

    Consumer Preferences for Quality Products

    The Global Feed Flavors and Sweeteners Market Industry is shaped by changing consumer preferences for high-quality animal products. As consumers become more health-conscious, there is a growing demand for meat and dairy products that are produced with high-quality feed. This trend drives livestock producers to invest in feed formulations that incorporate flavors and sweeteners to enhance the sensory attributes of animal products. The market is projected to reach 3.19 USD Billion by 2035, reflecting the increasing importance of quality in the food supply chain. This consumer-driven demand is a significant factor influencing the industry's growth.

    Market Segment Insights

    Feed Flavors and Sweeteners Source Insights

    The feed flavors and sweeteners market segmentation based on the source includes natural and synthetic. The natural segment dominated the market, accounting for 68% of market revenue. The animal feed industry has a growing consumer preference for natural and clean-label products. As a result, feed manufacturers are seeking natural sources of flavors and sweeteners to meet this demand and provide healthier and more sustainable options for animal nutrition. Many countries have implemented regulations and guidelines limiting the use of artificial additives in animal feed.

    Additionally, consumers are becoming more aware of the impact of artificial ingredients on animal health and product quality. These factors drive the adoption of natural feed flavors and sweeteners as viable alternatives to artificial additives.

    Feed Flavors and Sweeteners Form Insights

    The feed flavors and sweeteners market segmentation based on the form includes dry and liquid. The dry segment dominated the market, accounting for 64% of revenue (1.3 Billion). Feed manufacturers and producers prefer dry-feed flavors and sweeteners due to their handling, transportation, and storage convenience. Dry forms have a longer shelf life than liquid or gel forms, making them practical for bulk storage and reducing the risk of spoilage. Dry feed flavors and sweeteners can be evenly distributed throughout the feed, ensuring consistent flavor and sweetness in every batch.

    This enhanced feed uniformity leads to better feed intake and improved animal palatability, positively impacting animal performance and growth.

    Figure 1: Feed Flavors and Sweeteners Market, by Form, 2022 & 2032 (USD Billion)

    Source: Secondary Research, Primary Research, Market Research Future Database and Analyst Review

    The liquid segment is expected to grow at the fastest CAGR in the feed flavors and sweeteners industry in the coming years. Liquid feed flavors and sweeteners offer superior palatability, as they can evenly coat the feed particles, providing a concentrated and consistent taste experience for animals. This heightened flavor intensity increases feed intake and encourages optimal consumption, particularly for young or picky eaters. Liquid feed flavors and sweeteners can be conveniently added during the feed processing stage, such as spraying or coating on pellets or mixing into mash feeds.

    Feed Flavors and Sweeteners Livestock Insights

    Based on livestock, the feed flavors and sweeteners market segmentation include ruminants, swine, pets, and others. The ruminants category generated the most income (40%). Ruminant animals like cattle, sheep, and goats have complex digestive systems and unique feeding behaviors. Feed flavors and sweeteners play a crucial role in enhancing the palatability of ruminant feeds, encouraging voluntary feed intake, and ensuring proper nutrient assimilation, which ultimately supports optimal growth and production. Ruminants require a balanced diet to meet their specific nutritional needs. Including feed flavors and sweeteners helps mask any unpalatable or bitter components in the feed, promoting a well-balanced diet.

    This ensures that the animals receive all essential nutrients for good health and productivity.

    Get more detailed insights about Feed Flavors and Sweeteners Market Research Report - Global Forecast till 2032

    Regional Insights

    By region, the study provides market insights into North America, Europe, Asia-Pacific, and the Rest of the World. The North American feed flavors and sweeteners market accounted for USD 0.92 billion in 2022 and will likely exhibit a significant CAGR growth in the study period. Consumers in the region are becoming more conscious of the nutritional content and taste of animal-derived products, leading to a heightened interest in enhancing animal feed palatability with flavors and sweeteners. As a result, feed manufacturers are adopting these additives to improve feed intake and overall animal performance, meeting consumer preferences for superior-quality animal products.

    Further, the major countries studied in the market report are The US, German, Canada, the UK, Italy, Spain, France, Japan, China, Australia, South Korea, India, and Brazil.

    Figure 2: Feed Flavors And Sweeteners Market Share By Region 2022 (USD Billion)

    FEED PIGMENTS MARKET SHARE BY REGION 2022 (USD Billion)1

    Source: Secondary Research, Primary Research, Market Research Future Database and Analyst Review

    Europe feed flavors and sweeteners market accounts for the second-largest market share. The European Union has stringent guidelines on using additives in animal feed, fostering the demand for natural and safe feed flavors and sweeteners. Feed manufacturers in Europe are increasingly focusing on eco-friendly and sustainable solutions to align with consumer demands for transparency and ethical production practices. As a result, the adoption of natural feed flavors and sweeteners sourced from plant extracts, essential oils, and other renewable materials is rising.

    Further, the German feed flavors and sweeteners market held the largest market share, and the UK feed flavors and sweeteners market was the fastest-growing market in the European region.

    The Asia-Pacific Feed Flavors and Sweeteners Market is expected to grow at the fastest CAGR from 2023 to 2032. As the demand for animal-derived products, especially meat and dairy, surges with the regional population growth and rising disposable income, feed manufacturers seek effective ways to optimize animal nutrition and performance. Feed flavors and sweeteners are vital in promoting livestock feed intake, digestibility, and nutrient utilization, supporting healthy growth and productivity. Additionally, the increasing adoption of advanced animal husbandries practices, such as precision nutrition and targeted feeding, necessitates using flavors and sweeteners to formulate customized and palatable diets.

    Moreover, China’s feed flavors and sweeteners market held the largest market share, and the Indian feed flavors and sweeteners market was the fastest-growing market in the Asia-Pacific region.

    Key Players and Competitive Insights

    Leading market players are actively investing in R&D to broaden their product portfolios and meet the evolving demands of the animal nutrition sector. These investments in the feed flavors and sweeteners industry aim to develop innovative and customized flavors and sweeteners that cater to different animal species and production systems, addressing specific taste preferences and nutritional needs. Key market developments include new product launches introducing novel flavor blends and sweetener formulations to enhance feed palatability and encourage higher feed intake.

    Mergers and acquisitions are prevalent in the feed flavors and sweeteners industry as major players seek to enhance their market share and strengthen their position. These strategic moves facilitate access to new technologies, market insights, and expertise, accelerating product development and expanding market presence. In recent years, the feed flavors and sweeteners industry has offered some of the most significant advantages that address specific nutritional requirements and improve animal health and performance.

    Major players in the feed flavors and sweeteners market, including Solvay (Belgium), Grupo Ferrer Internacional S.A. (Spain), Pancosma (Switzerland), Nutriad (Belgium), FeedStimulants (Netherlands), Alltech (US), DuPont (US), BIOMIN Holding (Austria), Prinova Group LLC (US), Norel (Spain), are actively investing in research & development operations to bring cutting-edge solutions to the market.

    FeedStimulants is a leading company specializing in developing and manufacturing feed additives that enhance animal nutrition and performance. The company's core focus is providing innovative feed stimulants, including flavors and sweeteners, to improve feed palatability and encourage higher feed intake in various animal species. FeedStimulants offers a wide range of feed flavors and sweeteners tailored to the specific needs of different livestock and poultry industries. Their products are designed to enhance the taste and aroma of animal feed, promoting consistent feed consumption and optimal nutrient utilization.

    In 2018, FeedStimulants introduced an advanced line of liquid feed flavors that garnered significant attention in the animal nutrition sector. This innovative range of flavors is formulated using natural extracts and plant-based ingredients, aligning with the increasing demand for clean labels and natural feed additives.

    Solvay is a chemical company headquartered in Brussels, Belgium. With a rich history dating back to 1863, the company has grown into a leading player in various sectors, including chemicals, advanced materials, and specialty chemicals. Solvay operates through multiple business segments, which include Advanced Formulations, Advanced Materials, Performance Chemicals, and Corporate and Business Services. The company serves diverse industries such as automotive, aerospace, agriculture, consumer goods, and healthcare. Solvay offers various products and solutions, including specialty chemicals, high-performance polymers, advanced materials, and formulations for various industrial, consumer, and healthcare applications.

    Key Companies in the Feed Flavors Sweeteners Market market include

    Industry Developments

    June 2021: Phytobiotics formed its firm, Phytobiotics Iberica, with headquarters in Malaga, to service the rapidly developing market for premixed animal feed and plant production requirements in Spain and Portugal.

    May 2021: Phytobiotics launched Miracol, an animal feed flavoring solution that addresses issues with animal feed consumption.

    March 2018: Nutriad has announced opening a new palatability facility in China. This new manufacturing operation would produce feed flavors and sweeteners.

    Future Outlook

    Feed Flavors Sweeteners Market Future Outlook

    The Global Feed Flavors and Sweeteners Market is projected to grow at a 3.58% CAGR from 2025 to 2035, driven by rising demand for animal nutrition and flavor enhancement.

    New opportunities lie in:

    • Develop innovative natural flavoring solutions to meet consumer preferences for clean labels.
    • Invest in R&D for synthetic sweeteners that enhance feed efficiency and palatability.
    • Expand distribution networks in emerging markets to capitalize on growing livestock industries.

    By 2035, the market is expected to exhibit robust growth, positioning itself as a key player in animal nutrition.

    Market Segmentation

    Feed Flavors and Sweeteners Form Outlook

    • Dry
    • Liquid

    Feed Flavors and Sweeteners Source Outlook

    • Natural
    • Synthetic

    Feed Flavors and Sweeteners Regional Outlook

    North America
    • US
    • Canada

    Feed Flavors and Sweeteners Livestock Outlook

    • Ruminants
    • Swine
    • Pets
    • Others

    Report Scope

    Attribute/Metric Details
    Market Size 2024 USD 2.16  Billion
    Market Size 2035 3.18 (Value (USD Billion))
    Compound Annual Growth Rate (CAGR) 3.58% (2025 - 2035)
    Base Year 2024
    Market Forecast Period 2025 - 2035
    Historical Data 2018-2022
    Market Forecast Units Value (USD Billion)
    Report Coverage Market Competitive Landscape, Revenue Forecast, Growth Factors, and Trends
    Segments Covered Source, Form, Livestock, and Region
    Geographies Covered North America, Europe, Asia Pacific, and the Rest of the World
    Countries Covered The US, German, Canada, UK, Italy, France, China, Spain, India, Australia, Japan, South Korea, and Brazil
    Key Companies Profiled Solvay (Belgium), Grupo Ferrer Internacional S.A. (Spain), Pancosma (Switzerland), Nutriad (Belgium), FeedStimulants (Netherlands), Alltech (US), DuPont (US), BIOMIN Holding (Austria), Prinova Group LLC (US), Norel (Spain)
    Key Market Opportunities ·         Rising need for specialized and customized feed formulations to meet diverse animal nutrition requirements
    Key Market Dynamics ·         Increasing demand for natural and clean-label feed additives·         Escalating awareness of the impact of feed palatability on animal performance and profitability
    Market Size 2025 2.24 (Value (USD Billion))

    Market Highlights

    Author

    Tejas Chaudhary
    Research Analyst Level II

    She holds an experience of about 6+ years in market research and business consulting, working under the spectrum of information communication technology, telecommunications and semiconductor domains. aarti conceptualizes and implements a scalable business strategy and provides strategic leadership to the clients. her expertise lies in market estimation, competitive intelligence, pipeline analysis, customer assessment, etc.

    Leave a Comment

    Latest Comments

    John Doe
    john@example.com

    This is a great article! Really helped me understand the topic better.

    Posted on July 23, 2025, 10:15 AM
    Jane Smith
    jane@domain.com

    Thanks for sharing this. I’ve bookmarked it for later reference.

    Posted on July 22, 2025, 7:45 PM

    FAQs

    How much is the feed flavors and sweeteners market?

    The feed flavors and sweeteners market size was valued at USD 2 Billion in 2022.

    What is the growth rate of the feed flavors and sweeteners market?

    The market is projected to grow at a CAGR of 3.58 % during the forecast period, 2024-2032.

    Which region held the largest market share in the feed flavors and sweeteners market?

    North America had the largest share of the market.

    Who are the key players in the feed flavors and sweeteners market?

    The key players in the market are Solvay (Belgium), Grupo Ferrer Internacional S.A. (Spain), Pancosma (Switzerland), Nutriad (Belgium), FeedStimulants (Netherlands), Alltech (US), DuPont (US), BIOMIN Holding (Austria), Prinova Group LLC (US), Norel (Spain).

    Which source led the feed flavors and sweeteners market?

    The natural category dominated the market in 2022.

    Which livestock had the largest market share in the feed flavors and sweeteners market?

    The ruminants had the largest share of the market.

    1. Table of Contents
    2. Executive Summary
    3. Scope of the Report
      1. Market Definition
      2. Scope of the Study
        1. Research Objectives
        2. Assumptions & Limitations
      3. Market Structure
    4. Market Research Methodology
      1. Research Process
      2. Secondary Research
      3. Primary Research
      4. Forecast Model
    5. Market Landscape
      1. Supply Chain Analysis
        1. Raw Material Suppliers
        2. Manufacturers/Producers
        3. Distributors/Retailers/Wholesalers/E-Commerce
        4. End Users
      2. Porter’s Five Forces Analysis
        1. Threat of New Entrants
        2. Bargaining Power of Buyers
        3. Bargaining Power of Suppliers
        4. Threat of Substitutes
        5. Internal Rivalry
    6. Market Dynamics of the Global Feed Flavors & Sweeteners Market
      1. Introduction
      2. Drivers
      3. Restraints
      4. Opportunities
      5. Challenges
    7. Global Feed Flavors & Sweeteners Market, by Type
      1. Introduction
      2. Flavors
        1. Market Estimates & Forecast, 2023–2032
        2. Market Estimates & Forecast, by Region, 2023–2032
        3. Sweet
        4. Savory
        5. Others
      3. Sweeteners
        1. Market Estimates & Forecast, 2023–2032
        2. Market Estimates & Forecast, by Region, 2023–2032
        3. Saccharine
        4. Glycyrrhizin
        5. Neohesperidine Dihydrochalcone
        6. Others
    8. Global Feed Flavors & Sweeteners Market, by Form
      1. Introduction
      2. Dry
        1. Market Estimates & Forecast, 2023–2032
        2. Market Estimates & Forecast, by Region, 2023–2032
      3. Liquid
        1. Market Estimates & Forecast, 2023–2032
        2. Market Estimates & Forecast, by Region, 2023–2032
    9. Global Feed Flavors & Sweeteners Market, by Source
      1. Introduction
      2. Natural
        1. Market Estimates & Forecast, 2023–2032
        2. Market Estimates & Forecast, by Region, 2023–2032
      3. Synthetic
        1. Market Estimates & Forecast, 2023–2032
        2. Market Estimates & Forecast, by Region, 2023–2032
    10. Global Feed Flavors & Sweeteners Market, by Livestock
      1. Introduction
      2. Ruminants
        1. Market Estimates & Forecast, 2023–2032
        2. Market Estimates & Forecast, by Region, 2023–2032
      3. Swine
        1. Market Estimates & Forecast, 2023–2032
        2. Market Estimates & Forecast, by Region, 2023–2032
      4. Pet
        1. Market Estimates & Forecast, 2023–2032
        2. Market Estimates & Forecast, by Region, 2023–2032
      5. Others
        1. Market Estimates & Forecast, 2023–2032
        2. Market Estimates & Forecast, by Region, 2023–2032
    11. Global Feed Flavors & Sweeteners Market, by Region
      1. Introduction
      2. North America
        1. Market Estimates & Forecast, 2023–2032
        2. Market Estimates & Forecast, by Type, 2023–2032
        3. Market Estimates & Forecast, by Form, 2023–2032
        4. Market Estimates & Forecast, by Source, 2023–2032
        5. Market Estimates & Forecast, by Livestock, 2023–2032
        6. US
        7. Canada
        8. Mexico
      3. Europe
        1. Market Estimates & Forecast, 2023–2032
        2. Market Estimates & Forecast, by Type, 2023–2032
        3. Market Estimates & Forecast, by Form, 2023–2032
        4. Market Estimates & Forecast, by Source, 2023–2032
        5. Market Estimates & Forecast, by Livestock, 2023–2032
        6. Germany
        7. France
        8. Italy
        9. Spain
        10. UK
        11. Rest of Europe
      4. Asia-Pacific
        1. Market Estimates & Forecast, 2023–2032
        2. Market Estimates & Forecast, by Type, 2023–2032
        3. Market Estimates & Forecast, by Form, 2023–2032
        4. Market Estimates & Forecast, by Source, 2023–2032
        5. Market Estimates & Forecast, by Livestock, 2023–2032
        6. China
        7. India
        8. Japan
        9. Australia & New Zealand
        10. Rest of Asia-Pacific
      5. Rest of the World (RoW)
        1. Market Estimates & Forecast, 2023–2032
        2. Market Estimates & Forecast, by Type, 2023–2032
        3. Market Estimates & Forecast, by Form, 2023–2032
        4. Market Estimates & Forecast, by Source, 2023–2032
        5. Market Estimates & Forecast, by Livestock, 2023–2032
        6. South America
        7. The Middle East
        8. Africa
    12. Company Landscape
      1. Introduction
      2. Market Strategy
      3. Key Development Analysis
    13. (Expansions/Mergers and Acquisitions/Joint Ventures/New Product Developments/Agreements/Investments)
    14. Company Profiles
      1. Grupo Ferrer Internacional S.A.
        1. Company Overview
        2. Financial Updates
        3. Product/Business Segment Overview
        4. Strategy
        5. Key Developments
        6. SWOT Analysis
      2. Solvay
        1. Company Overview
        2. Financial Updates
        3. Product/Business Segment Overview
        4. Strategy
        5. Key Developments
        6. SWOT Analysis
      3. Nutriad
        1. Company Overview
        2. Financial Updates
        3. Product/Business Segment Overview
        4. Strategy
        5. Key Developments
        6. SWOT Analysis
      4. Pancosma
        1. Company Overview
        2. Financial Updates
        3. Product/Business Segment Overview
        4. Strategy
        5. Key Developments
        6. SWOT Analysis
      5. Alltech
        1. Company Overview
        2. Financial Updates
        3. Product/Business Segment Overview
        4. Strategy
        5. Key Developments
        6. SWOT Analysis
      6. FeedStimulants
        1. Company Overview
        2. Financial Updates
        3. Product/Business Segment Overview
        4. Strategy
        5. Key Developments
        6. SWOT Analysis
      7. BIOMIN Holding
        1. Company Overview
        2. Financial Updates
        3. Product/Business Segment Overview
        4. Strategy
        5. Key Developments
        6. SWOT Analysis
      8. DuPont
        1. Company Overview
        2. Financial Updates
        3. Product/Business Segment Overview
        4. Strategy
        5. Key Developments
        6. SWOT Analysis
      9. Norel
        1. Company Overview
        2. Financial Updates
        3. Product/Business Segment Overview
        4. Strategy
        5. Key Developments
        6. SWOT Analysis
      10. Prinova Group LLC
        1. Company Overview
        2. Financial Updates
        3. Product/Business Segment Overview
        4. Strategy
        5. Key Developments
        6. SWOT Analysis
      11. Agri-Flavors
        1. Company Overview
        2. Financial Updates
        3. Product/Business Segment Overview
        4. Strategy
        5. Key Developments
        6. SWOT Analysis
      12. Origination O2D
        1. Company Overview
        2. Financial Updates
        3. Product/Business Segment Overview
        4. Strategy
        5. Key Developments
        6. SWOT Analysis
      13. Kerry Group
        1. Company Overview
        2. Financial Updates
        3. Product/Business Segment Overview
        4. Strategy
        5. Key Developments
        6. SWOT Analysis
      14. Pestell Minerals & Ingredients
        1. Company Overview
        2. Financial Updates
        3. Product/Business Segment Overview
        4. Strategy
        5. Key Developments
        6. SWOT Analysis
      15. Kemin Industries, Inc.
        1. Company Overview
        2. Financial Updates
        3. Product/Business Segment Overview
        4. Strategy
        5. Key Developments
        6. SWOT Analysis
    15. Conclusion
    16. List of Tables and Figures
      1. LIST OF TABLES
      2. Table 1 Global Feed Flavors & Sweeteners, by Region, 2023–2032 (USD Million)
      3. Table 2 Global Feed Flavors & Sweeteners, by Type, 2023–2032 (USD Million)
      4. Table 3 Global Feed Flavors & Sweeteners, by Form,2023–2032 (USD Million)
      5. Table 4 Global Feed Flavors & Sweeteners, by Source, 2023–2032 (USD Million)
      6. Table 5 Global Feed Flavors & Sweeteners, by Livestock, 2023–2032 (USD Million)
      7. Table 6 North America: Feed Flavors & Sweeteners, by Country, 2023–2032 (USD Million)
      8. Table 7 North America: Feed Flavors & Sweeteners, by Type, 2023–2032 (USD Million)
      9. Table 8 North America: Feed Flavors & Sweeteners, by Form,2023–2032 (USD Million)
      10. Table 9 North America: Feed Flavors & Sweeteners, by Source, 2023–2032 (USD Million)
      11. Table 10 North America: Feed Flavors & Sweeteners, by Livestock, 2023–2032 (USD Million)
      12. Table 11 US: Feed Flavors & Sweeteners, by Type, 2023–2032 (USD Million)
      13. Table 12 US: Feed Flavors & Sweeteners, by Form,2023–2032 (USD Million)
      14. Table 13 US: Feed Flavors & Sweeteners, by Source, 2023–2032 (USD Million)
      15. Table 14 US: Feed Flavors & Sweeteners, by Livestock, 2023–2032 (USD Million)
      16. Table 15 Canada: Feed Flavors & Sweeteners, by Type, 2023–2032 (USD Million)
      17. Table 16 Canada: Feed Flavors & Sweeteners, by Form,2023–2032 (USD Million)
      18. Table 17 Canada: Feed Flavors & Sweeteners, by Source, 2023–2032 (USD Million)
      19. Table 18 Canada: Feed Flavors & Sweeteners, by Livestock, 2023–2032 (USD Million)
      20. Table 19 Mexico: Feed Flavors & Sweeteners, by Type, 2023–2032 (USD Million)
      21. Table 20 Mexico: Feed Flavors & Sweeteners, by Form,2023–2032 (USD Million)
      22. Table 21 Mexico: Feed Flavors & Sweeteners, by Source, 2023–2032 (USD Million)
      23. Table 22 Mexico: Feed Flavors & Sweeteners, by Livestock, 2023–2032 (USD Million)
      24. Table 23 Europe: Feed Flavors & Sweeteners, by Country, 2023–2032 (USD Million)
      25. Table 24 Europe: Feed Flavors & Sweeteners, by Type, 2023–2032 (USD Million)
      26. Table 25 Europe: Feed Flavors & Sweeteners, by Form,2023–2032 (USD Million)
      27. Table 26 Europe: Feed Flavors & Sweeteners, by Source, 2023–2032 (USD Million)
      28. Table 27 Europe: Feed Flavors & Sweeteners, by Livestock, 2023–2032 (USD Million)
      29. Table 28 Germany: Feed Flavors & Sweeteners, by Type, 2023–2032 (USD Million)
      30. Table 29 Germany: Feed Flavors & Sweeteners, by Form,2023–2032 (USD Million)
      31. Table 30 Germany: Feed Flavors & Sweeteners, by Source, 2023–2032 (USD Million)
      32. Table 31 Germany: Feed Flavors & Sweeteners, by Livestock, 2023–2032 (USD Million)
      33. Table 32 France: Feed Flavors & Sweeteners, by Type, 2023–2032 (USD Million)
      34. Table 33 France: Feed Flavors & Sweeteners, by Form,2023–2032 (USD Million)
      35. Table 34 France: Feed Flavors & Sweeteners, by Source, 2023–2032 (USD Million)
      36. Table 35 France: Feed Flavors & Sweeteners, by Livestock, 2023–2032 (USD Million)
      37. Table 36 Italy: Feed Flavors & Sweeteners, by Type, 2023–2032 (USD Million)
      38. Table 37 Italy: Feed Flavors & Sweeteners, by Form,2023–2032 (USD Million)
      39. Table 38 Italy: Feed Flavors & Sweeteners, by Source, 2023–2032 (USD Million)
      40. Table 39 Italy: Feed Flavors & Sweeteners, by Livestock, 2023–2032 (USD Million)
      41. Table 40 Spain: Feed Flavors & Sweeteners, by Type, 2023–2032 (USD Million)
      42. Table 41 Spain: Feed Flavors & Sweeteners, by Form,2023–2032 (USD Million)
      43. Table 42 Spain: Feed Flavors & Sweeteners, by Source, 2023–2032 (USD Million)
      44. Table 43 Spain: Feed Flavors & Sweeteners, by Livestock, 2023–2032 (USD Million)
      45. Table 44 UK: Feed Flavors & Sweeteners, by Type, 2023–2032 (USD Million)
      46. Table 45 UK: Feed Flavors & Sweeteners, by Form,2023–2032 (USD Million)
      47. Table 46 UK: Feed Flavors & Sweeteners, by Source, 2023–2032 (USD Million)
      48. Table 47 UK: Feed Flavors & Sweeteners, by Livestock, 2023–2032 (USD Million)
      49. Table 48 Rest of Europe: Feed Flavors & Sweeteners, by Type, 2023–2032 (USD Million)
      50. Table 49 Rest of Europe: Feed Flavors & Sweeteners, by Form,2023–2032 (USD Million)
      51. Table 50 Rest of Europe: Feed Flavors & Sweeteners, by Source, 2023–2032 (USD Million)
      52. Table 51 Rest of Europe: Feed Flavors & Sweeteners, by Livestock, 2023–2032 (USD Million)
      53. Table 52 Asia-Pacific: Feed Flavors & Sweeteners, by Country, 2023–2032 (USD Million)
      54. Table 53 Asia-Pacific: Feed Flavors & Sweeteners, by Type, 2023–2032 (USD Million)
      55. Table 54 Asia-Pacific: Feed Flavors & Sweeteners, by Form,2023–2032 (USD Million)
      56. Table 55 Asia-Pacific: Feed Flavors & Sweeteners, by Source, 2023–2032 (USD Million)
      57. Table 56 Asia-Pacific: Feed Flavors & Sweeteners, by Livestock, 2023–2032 (USD Million)
      58. Table 57 China: Feed Flavors & Sweeteners, by Type, 2023–2032 (USD Million)
      59. Table 58 China: Feed Flavors & Sweeteners, by Form,2023–2032 (USD Million)
      60. Table 59 China: Feed Flavors & Sweeteners, by Source, 2023–2032 (USD Million)
      61. Table 60 China: Feed Flavors & Sweeteners, by Livestock, 2023–2032 (USD Million)
      62. Table 61 India: Feed Flavors & Sweeteners, by Type, 2023–2032 (USD Million)
      63. Table 62 India: Feed Flavors & Sweeteners, by Form,2023–2032 (USD Million)
      64. Table 63 India: Feed Flavors & Sweeteners, by Source, 2023–2032 (USD Million)
      65. Table 64 India: Feed Flavors & Sweeteners, by Livestock, 2023–2032 (USD Million)
      66. Table 65 Japan: Feed Flavors & Sweeteners, by Type, 2023–2032 (USD Million)
      67. Table 66 Japan: Feed Flavors & Sweeteners, by Form,2023–2032 (USD Million)
      68. Table 67 Japan: Feed Flavors & Sweeteners, by Source, 2023–2032 (USD Million)
      69. Table 68 Japan: Feed Flavors & Sweeteners, by Livestock, 2023–2032 (USD Million)
      70. Table 69 Australia & New Zealand: Feed Flavors & Sweeteners, by Type, 2023–2032 (USD Million)
      71. Table 70 Australia & New Zealand: Feed Flavors & Sweeteners, by Form,2023–2032 (USD Million)
      72. Table 71 Australia & New Zealand: Feed Flavors & Sweeteners, by Source, 2023–2032 (USD Million)
      73. Table 72 Australia & New Zealand: Feed Flavors & Sweeteners, by Livestock, 2023–2032 (USD Million)
      74. Table 73 Rest of Asia-Pacific: Feed Flavors & Sweeteners, by Type, 2023–2032 (USD Million)
      75. Table 74 Rest of Asia-Pacific: Feed Flavors & Sweeteners, by Form,2023–2032 (USD Million)
      76. Table 75 Rest of Asia-Pacific: Feed Flavors & Sweeteners, by Source, 2023–2032 (USD Million)
      77. Table 76 Rest of Asia-Pacific: Feed Flavors & Sweeteners, by Livestock, 2023–2032 (USD Million)
      78. Table 77 Rest of the World (RoW): Feed Flavors & Sweeteners, by Country, 2023–2032 (USD Million)
      79. Table 78 Rest of the World (RoW): Feed Flavors & Sweeteners, by Type, 2023–2032 (USD Million)
      80. Table 79 Rest of the World (RoW): Feed Flavors & Sweeteners, by Form,2023–2032 (USD Million)
      81. Table 80 Rest of the World (RoW): Feed Flavors & Sweeteners, by Source, 2023–2032 (USD Million)
      82. Table 81 Rest of the World (RoW): Feed Flavors & Sweeteners, by Livestock, 2023–2032 (USD Million)
      83. Table 82 South America: Feed Flavors & Sweeteners, by Type, 2023–2032 (USD Million)
      84. Table 83 South America: Feed Flavors & Sweeteners, by Form,2023–2032 (USD Million)
      85. Table 84 South America: Feed Flavors & Sweeteners, by Source, 2023–2032 (USD Million)
      86. Table 85 South America: Feed Flavors & Sweeteners, by Livestock, 2023–2032 (USD Million)
      87. Table 86 Middle East: Feed Flavors & Sweeteners, by Type, 2023–2032 (USD Million)
      88. Table 87 Middle East: Feed Flavors & Sweeteners, by Form,2023–2032 (USD Million)
      89. Table 88 Middle East: Feed Flavors & Sweeteners, by Source, 2023–2032 (USD Million)
      90. Table 89 Middle East: Feed Flavors & Sweeteners, by Livestock, 2023–2032 (USD Million)
      91. Table 90 Africa: Feed Flavors & Sweeteners, by Type, 2023–2032 (USD Million)
      92. Table 91 Africa: Feed Flavors & Sweeteners, by Form,2023–2032 (USD Million)
      93. Table 92 Africa: Feed Flavors & Sweeteners, by Source, 2023–2032 (USD Million)
      94. Table 93 Africa: Feed Flavors & Sweeteners, by Livestock, 2023–2032 (USD Million)   LIST OF FIGURES
      95. FIGURE 1 Global Feed Flavors & Sweeteners Market Segmentation
      96. FIGURE 2 Forecast Research Methodology
      97. FIGURE 3 Five Forces Analysis of Global Feed Flavors & Sweeteners Market
      98. FIGURE 4 Value Chain of Global Feed Flavors & Sweeteners Market
      99. FIGURE 5 Share of Global Feed Flavors & Sweeteners Market in 2023, by Country (%)
      100. FIGURE 6 Global Feed Flavors & Sweeteners Market, by Region, 2023–2032,
      101. FIGURE 7 Global Feed Flavors & Sweeteners Market Size, by Type, 2023
      102. FIGURE 8 Share of Global Feed Flavors & Sweeteners Market, by Type, 2023–2032 (%)
      103. FIGURE 9 Global Feed Flavors & Sweeteners Market Size, by Source, 2023
      104. FIGURE 10 Share of Global Feed Flavors & Sweeteners Market, by Source, 2023–2032 (%)
      105. FIGURE 11 Global Feed Flavors & Sweeteners Market Size, by Form, 2023
      106. FIGURE 12 Share of Global Feed Flavors & Sweeteners Market, by Form, 2023–2032 (%)
      107. FIGURE 13 Global Feed Flavors & Sweeteners Market Size, by Livestock, 2023
      108. FIGURE 14 Share of Global Feed Flavors & Sweeteners Market, by Livestock, 2023–2032 (%)

    Feed Flavors and Sweeteners Source Outlook (USD Billion, 2018-2032)

    • Natural
    • Synthetic

    Feed Flavors and Sweeteners Form Outlook (USD Billion, 2018-2032)

    • Dry
    • Liquid

    Feed Flavors and Sweeteners Livestock Outlook (USD Billion, 2018-2032)

    • Ruminants
    • Swine
    • Pets
    • Others

    Feed Flavors and Sweeteners Regional Outlook (USD Billion, 2018-2032)

    • North America Outlook (USD Billion, 2018-2032)

      • North America Feed Flavors and Sweeteners by Source
        • Natural
        • Synthetic
      • North America Feed Flavors and Sweeteners by Form
        • Dry
        • Liquid
      • North America Feed Flavors and Sweeteners by Livestock
        • Ruminants
        • Swine
        • Pets
        • Others
      • US Outlook (USD Billion, 2018-2032)

      • US Feed Flavors and Sweeteners by Source
        • Natural
        • Synthetic
      • US Feed Flavors and Sweeteners by Form
        • Dry
        • Liquid
      • US Feed Flavors and Sweeteners by Livestock
        • Ruminants
        • Swine
        • Pets
        • Others
      • CANADA Outlook (USD Billion, 2018-2032)

      • CANADA Feed Flavors and Sweeteners by Source
        • Natural
        • Synthetic
      • CANADA Feed Flavors and Sweeteners by Form
        • Dry
        • Liquid
      • CANADA Feed Flavors and Sweeteners by Livestock
        • Ruminants
        • Swine
        • Pets
        • Others
    • Europe Outlook (USD Billion, 2018-2032)

      • Europe Feed Flavors and Sweeteners by Source
        • Natural
        • Synthetic
      • Europe Feed Flavors and Sweeteners by Form
        • Dry
        • Liquid
      • Europe Feed Flavors and Sweeteners by Livestock
        • Ruminants
        • Swine
        • Pets
        • Others
      • Germany Outlook (USD Billion, 2018-2032)

      • Germany Feed Flavors and Sweeteners by Source
        • Natural
        • Synthetic
      • Germany Feed Flavors and Sweeteners by Form
        • Dry
        • Liquid
      • Germany Feed Flavors and Sweeteners by Livestock
        • Ruminants
        • Swine
        • Pets
        • Others
      • France Outlook (USD Billion, 2018-2032)

      • France Feed Flavors and Sweeteners by Source
        • Natural
        • Synthetic
      • France Feed Flavors and Sweeteners by Form
        • Dry
        • Liquid
      • France Feed Flavors and Sweeteners by Livestock
        • Ruminants
        • Swine
        • Pets
        • Others
      • UK Outlook (USD Billion, 2018-2032)

      • UK Feed Flavors and Sweeteners by Source
        • Natural
        • Synthetic
      • UK Feed Flavors and Sweeteners by Form
        • Dry
        • Liquid
      • UK Feed Flavors and Sweeteners by Livestock
        • Ruminants
        • Swine
        • Pets
        • Others
      • ITALY Outlook (USD Billion, 2018-2032)

      • ITALY Feed Flavors and Sweeteners by Source
        • Natural
        • Synthetic
      • ITALY Feed Flavors and Sweeteners by Form
        • Dry
        • Liquid
      • ITALY Feed Flavors and Sweeteners by Livestock
        • Ruminants
        • Swine
        • Pets
        • Others
      • SPAIN Outlook (USD Billion, 2018-2032)

      • Spain Feed Flavors and Sweeteners by Source
        • Natural
        • Synthetic
      • Spain Feed Flavors and Sweeteners by Form
        • Dry
        • Liquid
      • Spain Feed Flavors and Sweeteners by Livestock
        • Ruminants
        • Swine
        • Pets
        • Others
      • Rest Of Europe Outlook (USD Billion, 2018-2032)

      • Rest Of Europe Feed Flavors and Sweeteners by Source
        • Natural
        • Synthetic
      • REST OF EUROPE Feed Flavors and Sweeteners by Form
        • Dry
        • Liquid
      • REST OF EUROPE Feed Flavors and Sweeteners by Livestock
        • Ruminants
        • Swine
        • Pets
        • Others
    • Asia-Pacific Outlook (USD Billion, 2018-2032)

      • Asia-Pacific Feed Flavors and Sweeteners by Source
        • Natural
        • Synthetic
      • Asia-Pacific Feed Flavors and Sweeteners by Form
        • Dry
        • Liquid
      • Asia-Pacific Feed Flavors and Sweeteners by Livestock
        • Ruminants
        • Swine
        • Pets
        • Others
      • China Outlook (USD Billion, 2018-2032)

      • China Feed Flavors and Sweeteners by Source
        • Natural
        • Synthetic
      • China Feed Flavors and Sweeteners by Form
        • Dry
        • Liquid
      • China Feed Flavors and Sweeteners by Livestock
        • Ruminants
        • Swine
        • Pets
        • Others
      • Japan Outlook (USD Billion, 2018-2032)

      • Japan Feed Flavors and Sweeteners by Source
        • Natural
        • Synthetic
      • Japan Feed Flavors and Sweeteners by Form
        • Dry
        • Liquid
      • Japan Feed Flavors and Sweeteners by Livestock
        • Ruminants
        • Swine
        • Pets
        • Others
      • India Outlook (USD Billion, 2018-2032)

      • India Feed Flavors and Sweeteners by Source
        • Natural
        • Synthetic
      • India Feed Flavors and Sweeteners by Form
        • Dry
        • Liquid
      • India Feed Flavors and Sweeteners by Livestock
        • Ruminants
        • Swine
        • Pets
        • Others
      • Australia Outlook (USD Billion, 2018-2032)

      • Australia Feed Flavors and Sweeteners by Source
        • Natural
        • Synthetic
      • Australia Feed Flavors and Sweeteners by Form
        • Dry
        • Liquid
      • Australia Feed Flavors and Sweeteners by Livestock
        • Ruminants
        • Swine
        • Pets
        • Others
      • Rest of Asia-Pacific Outlook (USD Billion, 2018-2032)

      • Rest of Asia-Pacific Feed Flavors and Sweeteners by Source
        • Natural
        • Synthetic
      • Rest of Asia-Pacific Feed Flavors and Sweeteners by Form
        • Dry
        • Liquid
      • Rest of Asia-Pacific Feed Flavors and Sweeteners by Livestock
        • Ruminants
        • Swine
        • Pets
        • Others
    • Rest of the World Outlook (USD Billion, 2018-2032)

      • Rest of the World Feed Flavors and Sweeteners by Source
        • Natural
        • Synthetic
      • Rest of the World Feed Flavors and Sweeteners by Form
        • Dry
        • Liquid
      • Rest of the World Feed Flavors and Sweeteners by Livestock
        • Ruminants
        • Swine
        • Pets
        • Others
      • Middle East Outlook (USD Billion, 2018-2032)

      • Middle East Feed Flavors and Sweeteners by Source
        • Natural
        • Synthetic
      • Middle East Feed Flavors and Sweeteners by Form
        • Dry
        • Liquid
      • Middle East Feed Flavors and Sweeteners by Livestock
        • Ruminants
        • Swine
        • Pets
        • Others
      • Africa Outlook (USD Billion, 2018-2032)

      • Africa Feed Flavors and Sweeteners by Source
        • Natural
        • Synthetic
      • Africa Feed Flavors and Sweeteners by Form
        • Dry
        • Liquid
      • Africa Feed Flavors and Sweeteners by Livestock
        • Ruminants
        • Swine
        • Pets
        • Others
      • Latin America Outlook (USD Billion, 2018-2032)

      • Latin America Feed Flavors and Sweeteners by Source
        • Natural
        • Synthetic
      • Latin America Feed Flavors and Sweeteners by Form
        • Dry
        • Liquid
      • Latin America Feed Flavors and Sweeteners by Livestock
        • Ruminants
        • Swine
        • Pets
        • Others
    Infographic

    Free Sample Request

    Kindly complete the form below to receive a free sample of this Report

    Get Free Sample

    Customer Strories

    “I am very pleased with how market segments have been defined in a relevant way for my purposes (such as "Portable Freezers & refrigerators" and "last-mile"). In general the report is well structured. Thanks very much for your efforts.”

    Victoria Milne

    Founder
    Case Study
    Chemicals and Materials