Segmentation Quick Reference
| Dimension | Sub-Segments | Dominant Segment | Fastest Growing Segment |
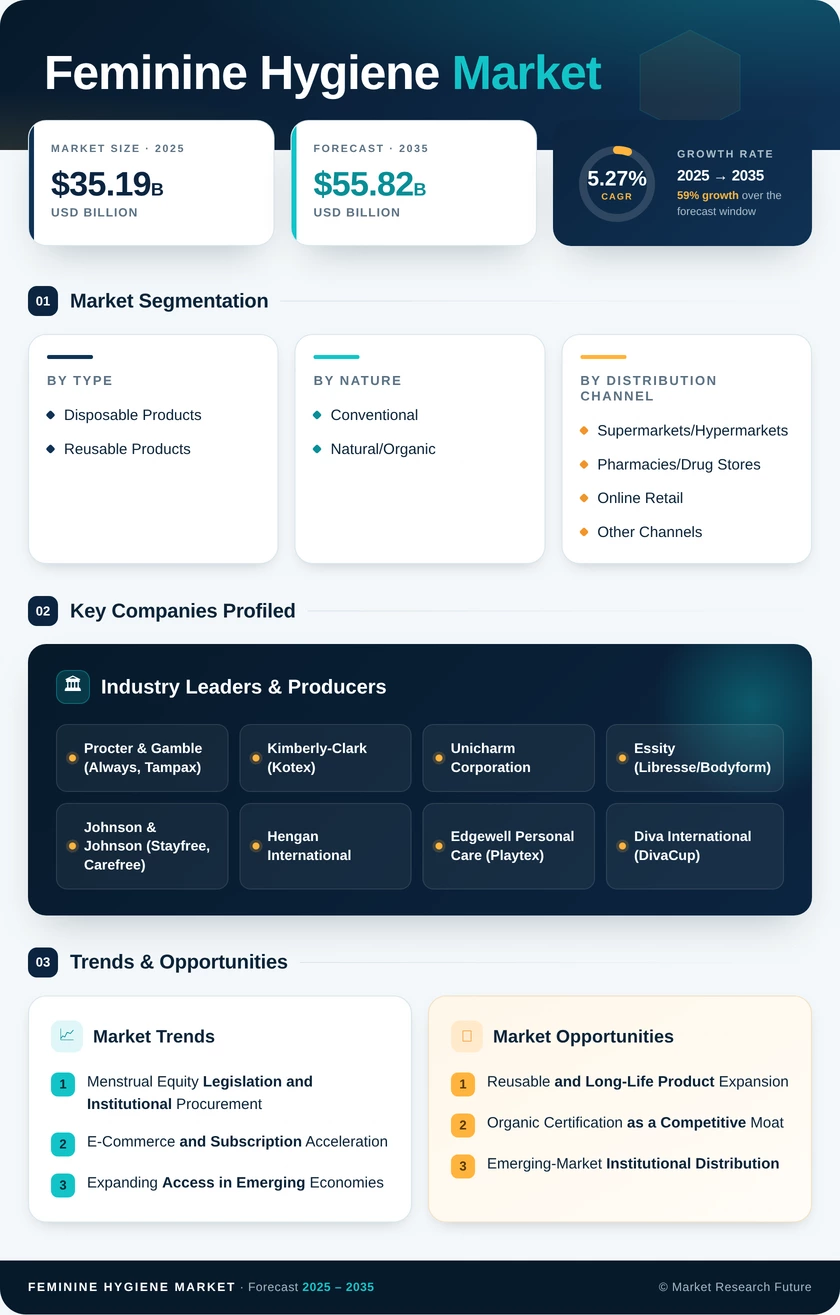
| By Product Type | Sanitary Pads/Napkins, Tampons, Menstrual Cups, Period Panties, Other | Sanitary Pads/Napkins | Menstrual Cups |
| By Product Category | Disposable Products, Reusable Products | Disposable Products | Reusable Products |
| By Nature | Conventional, Natural/Organic | Conventional | Natural/Organic |
| By Distribution Channel | Supermarkets/Hypermarkets, Pharmacies/Drug Stores, Online Retail, Other | Pharmacies/Drug Stores | Online Retail |
| By Region | North America, Europe, Asia-Pacific, South America, Middle East & Africa | North America | Asia-Pacific |
Market Segmentation Overview
By Product Type
| Sub-Segment | Key Trend |
| Sanitary Pads/Napkins | Organic cotton variants gaining shelf space; institutional procurement growth |
| Tampons | Compact applicator innovation; sustained loyalty in North America and Western Europe |
| Menstrual Cups | Medical-grade silicone adoption; DTC distribution scaling globally |
| Period Panties | Absorbent-technology improvements; dual-use positioning as backup or standalone |
| Other (Discs, Sponges, Liners) | Niche format diversification; menstrual disc awareness rising |
Sanitary pads remain the universal entry point for menstrual hygiene management globally, while menstrual cups represent the highest-growth format as consumers prioritize long-term cost efficiency and sustainability.
By Product Category
| Sub-Segment | Key Trend |
| Disposable Products | Volume leader; sustainability pressure driving compostable material adoption |
| Reusable Products | Fastest-growing category; supported by eco-regulation and consumer education |
Disposable products continue to dominate unit sales, though reusable alternatives are structurally gaining share as environmental mandates and cost-consciousness align consumer and regulatory incentives.
By Nature
| Sub-Segment | Key Trend |
| Conventional | Competitive pricing maintains volume leadership; gradual reformulation toward cleaner inputs |
| Natural/Organic | GOTS and USDA BioPreferred certifications drive trust; Gen Z adoption accelerating |
The organic segment is outpacing conventional growth by a factor of approximately 1.6x, reflecting a generational shift toward ingredient transparency in personal care.
By Distribution Channel
| Sub-Segment | Key Trend |
| Supermarkets/Hypermarkets | Promotional pricing and breadth of assortment sustain traffic |
| Pharmacies/Drug Stores | Health-credentialed environment supports premium product placement |
| Online Retail | Subscription replenishment and DTC bundles drive fastest channel growth |
| Other Channels | Institutional vending, school programs, and convenience stores expanding access |
Online retail is reshaping purchase behavior through subscription models that reduce churn and increase average order value, while pharmacy chains retain dominance through health-adjacent consumer trust.