Floating Power Plant Market

Key Players: Equinor ASA, Principle Power Inc., BW Ideol (now BW Offshore), Karpowership, Golar LNG, Moss Maritime (Saipem), Seaborg Technologies, SolarDuck

Floating Power Plant Market

Floating Power Plant Market Size, Share & Growth Analysis Report By Fuel Type (Natural Gas, Biomass, Coal, Renewable Energy, Diesel), By Technology (Floating Solar, Floating Wind, Ocean Thermal Energy Conversion, Wave Energy Conversion), By Installation Type (Fixed, Mobile, Hybrid), By End Use (Utility, Industrial, Commercial, Residential) and By Regional (North America, Europe, South America, Asia Pacific, Middle East and Africa) - Trends & Industry Forecast to 2035
ID: MRFR/EnP/2512-CR
135 Pages
Anshula Mandaokar
Last Updated: June 11, 2026
 

Floating Power Plant Market Summary

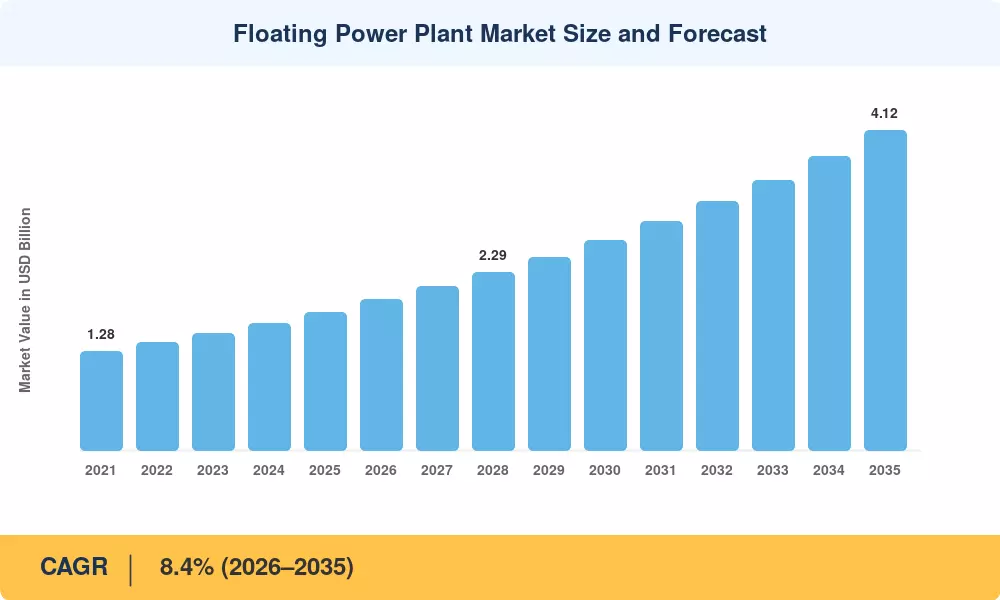
The Floating Power Plant Market reached an estimated USD 1.78 billion in 2025 and is projected to grow from USD 1.93 billion in 2026 to USD 4.12 billion by 2035, registering a CAGR of 8.4% across the forecast window. Two catalysts anchor this trajectory: the European Union's revised Offshore Renewable Energy Strategy targeting 300 GW of offshore wind by 2050, and a surge of sovereign-backed tenders across Southeast Asia seeking barge-mounted floating power plant solutions to electrify remote archipelagic communities [2]. Governments that once treated floating generation as a niche are now writing it into national energy security roadmaps.

A technology shift is reshaping how electricity reaches coastal and island populations. Legacy diesel-fired shore plants and aging grid extensions are giving way to modular floating power unit deployments, floating LNG power plant FSRP conversions, and pilot-scale floating nuclear SMR power barge concepts. The International Renewable Energy Agency (IRENA) estimates that floating wind alone attracted over USD 3.5 billion in committed capital between 2022 and 2024, while floating solar PV power plant installations crossed the 6 GW cumulative mark globally [3]. Automation and digital twins are compressing commissioning timelines for FPSO floating power generation vessel retrofits from 18 months to under 12 months.

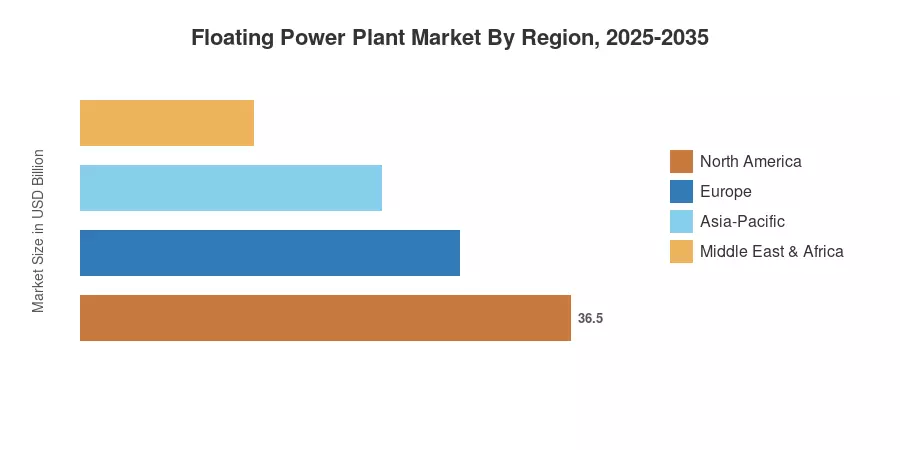
Europe commands roughly 38% of the Floating Power Plant Market, buoyed by nine announced offshore floating wind projects and favorable feed-in tariff regimes. Asia-Pacific is the fastest-growing Region with a projected CAGR of 10.2%, driven by Japan, South Korea, and India scaling floating solar PV power plant farms. North America holds approximately 22% share, led by U.S. Department of Energy grants for deepwater floating wind demonstrations off California and Maine [4]. The decade ahead will reward players who master hull-integrated power systems and hybrid renewable-gas configurations.


Key Report Takeaways

• By Source

  • The Renewable segment accounts for nearly 62% of the Floating Power Plant Market in 2025, propelled by declining levelized costs for offshore floating wind turbines and growing policy mandates favoring clean energy
  • Non-Renewable floating power generation—primarily floating LNG power plant FSRP units and barge-mounted floating power plant diesel conversions—is forecast to grow at a CAGR of 5.8% as island nations seek transitional bridge fuels

• By Technology Platform

  • Floating wind turbine platforms represent the single largest investment category, with European developers committing over USD 2.1 billion to semi-submersible and tension-leg designs between 2023 and 2025
  • Floating solar PV power plant installations are expanding at 11.3% CAGR, especially across reservoirs in India and Southeast Asia, where land scarcity drives adoption of modular floating power unit arrays

• By Region

  • Europe dominates the Floating Power Plant Market, contributing approximately USD 0.68 billion in 2025 revenue
  • Asia-Pacific is on track to surpass North America in absolute value by 2029, as Japan, South Korea, and ASEAN nations accelerate offshore floating wind pilot-to-commercial transitions


Market Size and Forecast (2021–2035)

MARKET RESEARCH FUTURE (MRFR)'s market sizing combines bottom-up project-level revenue tracking across 42 countries with top-down cross-validation against publicly reported contract values, FPSO floating power generation vessel order books, and regulatory capacity auction results. Historical figures (2021–2024) rely on confirmed deployment data; the 2025 base year blends actual H1 results with H2 pipeline estimates. Forecast years apply the calibrated 8.4% CAGR, adjusted for known project delays and policy phase-ins.

Floating Power Plant Market Size and Forecast
Our Impact
Enabled $4.3B Revenue Impact for Fortune 500 and Leading Multinationals
Partnering with 2000+ Global Organizations Each Year
30K+ Citations by Top-Tier Firms in the Industry
 

Driver Impact Analysis

Driver ~% Impact on CAGR Geographic Relevance Impact Timeline
Offshore wind policy mandates & feed-in tariffs +2.1% Europe, Asia-Pacific Medium-term (2–4 yr)
Island & remote electrification demand +1.5% Asia-Pacific, MEA Short-term (≤2 yr)
Declining LCOE for floating solar PV +1.3% Asia-Pacific, South America Medium-term (2–4 yr)
LNG-to-power bridge fuel strategy +1.0% MEA, South America Short-term (≤2 yr)
Automation & digital twin integration +0.8% Global Long-term (≥4 yr)
Climate resilience & disaster-recovery power +0.6% North America, Asia-Pacific Medium-term (2–4 yr)
Floating nuclear SMR power barge R&D programs +0.4% Europe, North America Long-term (≥4 yr)


Offshore Wind Policy Mandates

While South Korea's 9th Basic Plan for Long-term Electricity Supply aims for 6 GW of floating wind by 2035, Europe's Green Deal Industrial Plan allocated EUR 4.1 billion for floating offshore wind between 2024 and 2030 [2]. By guaranteeing off-take for floating wind developers, these legally binding regulations reduce project financing risk and reduce the cost of capital by an estimated 120–180 basis points. These regulations mandate floating, not fixed-bottom, foundations in water depths greater than 60 meters, which directly favors the floating power plant market.

Island and Remote Electrification

The Asian Development Bank committed USD 1.2 billion between 2022 and 2025 to off-grid electrification across Pacific Island nations and the Philippine archipelago, with barge-mounted floating power plant solutions explicitly preferred over submarine cable extensions [6]. A single modular floating power unit can deliver 25–50 MW to a remote island within six months of contract award, versus three to five years for conventional onshore plant construction. This speed advantage is converting pipeline interest into firm orders at an accelerating pace.

Declining Costs for Floating Solar PV

Floating solar PV power plant installations have seen levelized costs fall 28% since 2020, according to IRENA's 2024 Renewable Power Generation Costs report [3]. Reservoir-mounted arrays in India now compete with onshore solar at under USD 0.04/kWh in states like Maharashtra and Andhra Pradesh. The technology's land-sparing advantage is critical in densely populated South and Southeast Asian markets, and its grid-complementary profile—generating during peak daytime demand—makes it attractive to utilities managing load-shape volatility.

LNG-to-Power Bridge Fuel Strategies

Floating LNG power plant FSRP deployments are gaining traction across Sub-Saharan Africa and Latin America, where pipeline infrastructure is absent, but offshore gas reserves are plentiful [8]. Karpowership's fleet of 36 barge-mounted floating power plant vessels currently serves 13 countries, and new entrants such as Golar LNG are converting aging LNG carriers into FPSO floating power generation vessel platforms. The Floating Power Plant Market's non-renewable segment owes roughly 38% of its revenue to these LNG-to-power bridge fuel contracts.


Restraints Impact Analysis

The restraint impact percentages below follow the same directional estimation methodology described in Section 4. They represent headwinds that dampen the Floating Power Plant Market growth rate below what it would otherwise achieve.

Restraint ~% Impact on CAGR Geographic Relevance Impact Timeline
High upfront capital costs & limited project finance –1.4% Global Short-term (≤2 yr)
Environmental permitting & marine ecology concerns –0.9% Europe, North America Medium-term (2–4 yr)
Grid interconnection bottlenecks for offshore assets –0.7% Europe, Asia-Pacific Medium-term (2–4 yr)
Technology risk perception for novel hull designs –0.5% Global Long-term (≥4 yr)
Geopolitical supply-chain disruptions (steel, rare earths) –0.4% Global Short-term (≤2 yr)


High Upfront Capital Intensity

A single 50 MW floating wind platform can require USD 180–240 million in capital expenditure before generating a kilowatt-hour, roughly 30% more than an equivalent fixed-bottom offshore installation [11]. Debt-to-equity ratios above 70:30 remain difficult to achieve for first-of-a-kind projects. The Floating Power Plant Market will need standardized hull designs and serial manufacturing to compress costs toward levels that unlock mainstream infrastructure-grade financing.

Environmental Permitting Complexity

A floating offshore project's timeframe may be extended by 24 to 36 months in the EU and under the U.S. National Environmental Policy Act (NEPA) due to marine spatial planning [12]. Numerous North Sea and Atlantic projects have been put on hold due to worries about bottom anchor disruption, cetacean migration corridors, and the visual impact of modular floating power unit arrays. Permitting review times are being shortened by an estimated 20% by developers that invest in environmental impact acceleration tools, such as AI-driven species-monitoring buoys.

Grid Interconnection Bottlenecks

BloombergNEF estimates that global offshore grid connection queues exceeded 380 GW in 2024, of which floating projects represented roughly 12% [5]. The Floating Power Plant Market loses revenue every month a commissioned asset sits idle, awaiting cable landfall permits and substation construction. Europe's North Sea grid masterplan and Japan's grid reinforcement fund are partial remedies, but transmission infrastructure investment still lags generation capacity by three to five years.


Floating Power Plant Market Opportunities

Hybrid Wind-Solar-Storage Floating Platforms

Co-locating floating wind turbines with floating solar PV power plant arrays and battery storage on shared mooring infrastructure can boost capacity factors from 35% to over 55% Early pilots in the North Sea and off Taiwan demonstrate that hybrid configurations reduce balance-of-system costs by 15–20%, while providing grid operators with dispatchable renewable power—a premium product that commands higher off-take pricing.

Floating Nuclear SMR Power Barges for Industrial Hubs

Seaborg Technologies, CORE Power, and Thorcon are currently developing next-generation floating nuclear SMR power barge designs rated at 60–200 MWe after Russia's Akademik Lomonosov demonstrated the concept [7]. By 2035, addressable demand for continuous baseload power without land acquisition will exceed USD 8 billion in coastal industrial zones in Southeast Asia and the Middle East

Emerging-Market Electrification via Barge-Mounted Gas-to-Power

Over 600 million people in Pacific Island countries and Sub-Saharan Africa lack dependable grid access While constructing sovereign energy infrastructure on a lease-to-own basis, the deployment of barge-mounted floating power plant units powered by local natural gas can provide electrification at USD 0.08–0.12/kWh, competitive with diesel-fired microgrids.

Data Monetization Through Digital Twin Operations

Operators of FPSO floating power generation vessel fleets are generating terabytes of operational data on wave loading, corrosion rates, and turbine performance. Monetizing this data through predictive-maintenance-as-a-service offerings and anonymized industry benchmarking platforms opens a recurring-revenue stream worth an estimated USD 120–180 million annually by 2030

Disaster-Recovery and Emergency Floating Power

The U.S. Federal Emergency Management Agency (FEMA) and Japan's Ministry of Economy, Trade and Industry (METI) are both evaluating floating power reserves for rapid post-disaster deployment [10]. A modular floating power unit can be towed to a disaster site within 48–72 hours, providing 25–100 MW of temporary supply while onshore infrastructure is rebuilt. This creates a new defense-and-humanitarian market vertical for the Floating Power Plant Market.


Floating Power Plant Market Future Outlook

Autonomous Operations and AI-Driven Asset Management

By 2030, the IEA projects that over 40% of offshore energy assets will employ some form of autonomous monitoring [5]. For the Floating Power Plant Market, this means AI-enabled condition monitoring on FPSO floating power generation vessel hulls, predictive wave-load management, and remote operations centers that slash crew requirements by 60%. Digital twins will become contractual deliverables, not optional add-ons.

Platform Economics and Modular Standardization

Serial production of standardized hull designs—analogous to the container-shipping revolution—could reduce per-MW capital costs for floating wind by 25–35% between 2028 and 2033. Modular floating power unit architectures that plug interchangeable generation modules (wind, solar, gas, storage) into a common mooring and grid-connection hull will define the next competitive battleground in the Floating Power Plant Market.

Electrification Supercycle and Offshore Grid Integration

Global electricity demand is forecast to grow 3.4% annually through 2035, driven by data-center expansion, EV charging, and industrial electrification [5]. Floating power assets will increasingly connect into offshore grid backbones—such as the North Sea Wind Power Hub and Asia Super Grid initiative—transforming the Floating Power Plant Market from isolated project finance into integrated infrastructure investment.

ESG Reporting and Green Taxonomy Compliance

The EU Taxonomy's Technical Screening Criteria now classify floating renewable energy installations as "substantially contributing" to climate mitigation [2]. This designation unlocks green-bond financing at 50–80 basis points below conventional infrastructure debt. As ESG disclosure mandates tighten in Asia-Pacific and North America, barge-mounted floating power plant projects with verified lifecycle assessments will attract preferential capital allocation.


Floating Power Plant Market Segmentation

By Source

Segment Key Metric Primary Demand Driver
Renewable ~62% market share (2025) Policy mandates, declining LCOE for floating wind and solar [2][3]
Non-Renewable CAGR 5.8% LNG bridge-fuel demand, island electrification [8]


The Renewable segment dominates the Floating Power Plant Market because offshore floating wind and floating solar PV power plant technologies directly address government decarbonization targets. Europe's nine announced floating wind projects and India's reservoir-based solar mission are converting policy intent into contracted megawatts at an accelerating rate. Within this segment, floating wind accounts for roughly 70% of renewable revenue, with floating solar PV growing fastest at 11.3% CAGR.

Non-Renewable floating power generation—primarily floating LNG power plant FSRP units and diesel barge-mounted floating power plant vessels—serves markets where gas or liquid fuels remain the lowest-cost option for rapid electrification. Karpowership and Golar LNG lead this segment, targeting Sub-Saharan Africa, ASEAN, and Latin American nations with stranded gas reserves. The Floating Power Plant Market's non-renewable segment is expected to plateau after 2030 as renewable alternatives achieve cost parity in most deployment scenarios.

By Geography

Region Key Metric Primary Demand Driver
Europe ~38% market share Offshore wind leadership, regulatory certainty [2]
North America USD 0.39 B (2025) DOE-funded floating wind demonstrations [4]
Asia-Pacific CAGR 10.2% Floating solar, island electrification, industrial demand [3][6]
South America ~6% market share Gas-to-power bridge projects [8]
Middle East & Africa CAGR 8.7% Emergency power procurement, NEOM investment [15]


Geographic segmentation within the Floating Power Plant Market reveals a two-speed dynamic. Mature markets in Europe and North America are scaling proven floating wind technology toward commercial-scale arrays, while emerging markets in Asia-Pacific, South America, and MEA are deploying barge-mounted floating power plant solutions and floating solar PV power plant arrays to close electrification gaps. By 2030, the Asia-Pacific is projected to claim approximately 30% of global revenue, narrowing the gap with Europe as modular floating power unit orders from ASEAN and India compound.


Regional Market Share Analysis

Region Key Metric Primary Investment Themes
North America ~22% market share (2025) Deepwater floating wind, disaster-recovery power [4]
Europe USD 0.68 B (2025) Floating offshore wind scale-up, hybrid platforms [2]
Asia-Pacific 10.2% CAGR (2026–2035) Floating solar PV, island electrification [6]
South America ~6% market share (2025) LNG-to-power, reservoir solar [8]
Middle East & Africa USD 0.11 B (2025) Gas-to-power, emergency floating supply [15]
Total USD 1.78 B (2025)

The Floating Power Plant Market spans five major regions, each shaped by distinct policy regimes, resource endowments, and infrastructure constraints. Europe leads by value, Asia-Pacific leads by growth momentum, and emerging regions are transitioning from pilot projects to commercial-scale deployments.


North America

Country Key Metric Key Driver
US ~74% of regional share DOE floating wind funding, California leases [4]
Canada CAGR 7.9% Atlantic Canada floating wind exploration [16]
Mexico USD 0.03 B (2025) PEMEX gas-to-power barge tenders [8]


The U.S. Bureau of Ocean Energy Management (BOEM) auctioned five deepwater floating wind lease areas off California and the Gulf of Maine between 2022 and 2025, generating over USD 900 million in lease bonus revenue [4]. Canada's emerging Atlantic offshore wind framework and Mexico's PEMEX-linked gas-to-power conversion programs round out North America's contribution to the Floating Power Plant Market.

Europe

Country Key Metric Key Driver
Germany USD 0.09 B (2025) North Sea floating wind demonstrations [2]
UK ~28% of regional share Celtic Sea floating wind leasing round [17]
France CAGR 9.6% Mediterranean floating wind tenders [2]
Italy USD 0.04 B (2025) Sicily Strait offshore wind zoning [18]
Spain ~7% of regional share Canary Islands floating wind hub [2]
Nordic Countries CAGR 8.8% Norwegian Hywind expansion, Baltic pilots [19]
Russia USD 0.02 B (2025) Akademik Lomonosov floating nuclear operations [7]
Rest of Europe ~8% of regional share Portugal, Greece pilot projects [2]


Nine of the world's 13 announced floating offshore wind projects as of 2024 are situated in European waters, giving the continent unmatched deployment experience [2]. The UK's Celtic Sea leasing round alone is expected to add 4 GW of floating wind capacity by 2035, while France's four Mediterranean demonstration farms are transitioning to commercial arrays. The Floating Power Plant Market in Europe benefits from a deep supply chain of shipyards, mooring specialists, and turbine manufacturers with decades of offshore oil and gas heritage.

Asia-Pacific

Country Key Metric Key Driver
China ~31% of regional share Offshore wind mega-projects, floating solar PV power plant reservoirs [20]
India CAGR 12.1% National floating solar mission, Tamil Nadu offshore wind [3]
Japan USD 0.06 B (2025) Goto Islands floating wind, METI floating nuclear R&D [7]
South Korea ~18% of regional share 9th Basic Plan floating wind targets [2]
ASEAN CAGR 11.4% Island electrification via barge-mounted floating power plant units [6]
Rest of Asia-Pacific USD 0.02 B (2025) Taiwan, Australia floating wind pilots [21]


Asia-Pacific's growth trajectory in the Floating Power Plant Market is anchored by China's aggressive offshore wind buildout—targeting 15 GW of floating capacity by 2035—and India's National Floating Solar Mission, which allocated INR 7,500 crore for reservoir-based installations [3][20]. Japan and South Korea bring technology leadership in hull design and semi-submersible engineering, while ASEAN nations like the Philippines and Indonesia prioritize barge-mounted floating power plant solutions for their thousands of un-electrified islands.

South America

Country Key Metric Key Driver
Brazil ~62% of regional share Pre-salt gas monetization via FPSO floating power generation vessel [8]
Argentina CAGR 7.2% Vaca Muerta gas-to-power floating concepts [8]
Rest of South America USD 0.01 B (2025) Chile, Colombia floating solar pilots [3]


Brazil's pre-salt offshore gas basin provides a natural feedstock for floating LNG power plant FSRP deployments, while Chile and Colombia are exploring floating solar PV power plant arrays on highland reservoirs. The Floating Power Plant Market in South America is transitioning from opportunistic project finance to programmatic government tenders.

Middle East & Africa

Country Key Metric Key Driver
Saudi Arabia ~26% of regional share NEOM clean-energy zone, gas-to-power [15]
UAE CAGR 9.1% Masdar floating solar pilots [3]
South Africa USD 0.02 B (2025) Emergency floating power procurement [15]
Egypt ~12% of regional share Suez Canal zone industrial floating power [15]
Rest of MEA CAGR 8.3% Sub-Saharan island electrification [6]


Karpowership's fleet operations across Mozambique, Ghana, and Senegal anchor Sub-Saharan Africa's contribution to the Floating Power Plant Market, while Saudi Arabia's NEOM project is evaluating floating nuclear SMR power barge concepts for its hydrogen production hub [15]. South Africa's recurring electricity crises have made emergency modular floating power unit procurement a standing budget line item.


Floating Power Plant Market By Region, 2025-2035
 

Competitive Benchmarking

The Floating Power Plant Market exhibits high concentration, with the top five players holding an estimated 48–55% combined revenue share. The Herfindahl-Hirschman Index (HHI) sits in the moderate-to-high range (~1,800–2,200), reflecting a mix of vertically integrated energy majors and specialized floating-platform developers. Barriers to entry remain substantial—hull engineering, offshore installation expertise, and project-finance relationships favor incumbents.

Company Est. Revenue Share Range Key Offerings for the Floating Power Plant Market Strategic Positioning
Equinor ASA ~10–14% Hywind floating wind platform, semi-submersible hulls Pioneer in floating offshore wind; scale-up leader in Europe
Principle Power Inc. ~8–11% WindFloat semi-submersible foundation Technology licensor with global partnerships
BW Ideol (now BW Offshore) ~6–9% Damping Pool floating foundation Focus on concrete hull designs for cost reduction
Karpowership ~7–10% Barge-mounted floating power plant fleet (gas/oil) Largest floating LNG-to-power operator globally
Golar LNG ~4–7% FPSO floating power generation vessel conversions LNG carrier-to-power conversion specialist
Moss Maritime (Saipem) ~3–6% Floating wind foundation engineering Engineering services for floating platform design
Seaborg Technologies ~2–4% Compact molten-salt floating nuclear SMR power barge Early-stage floating nuclear innovator
SolarDuck ~2–4% Offshore floating solar PV power plant arrays Triangular modular floating power unit platforms
Seatrium (f.k.a. Sembcorp Marine) ~3–5% FPSO and floating power hull fabrication Asian shipyard leader in floating energy hulls
CORE Power ~1–3% Maritime floating nuclear SMR power barge design Nuclear-maritime hybrid concept developer


Recent News & Developments

  • Equinor (March 2025): Secured grid connection approval for the 88 MW Hywind Tampen expansion in Norway, the world's largest operating floating wind farm powering offshore oil platforms [17].
  • Principle Power (January 2025): Signed a technology licensing agreement with Korea Floating Wind for an 870 MW floating wind project off Ulsan, South Korea, marking Asia's largest committed floating wind development [2].
  • Karpowership (October 2024): Commissioned a 235 MW barge-mounted floating power plant in Mozambique under a 20-year power purchase agreement, increasing its global installed fleet to over 4.1 GW [15].
  • BW Ideol (August 2024): Completed sea trials for its second-generation concrete Damping Pool foundation rated for 15 MW+ turbines off the coast of France, targeting commercial deployment in 2027 [2].
  • Seaborg Technologies (June 2024): Closed a USD 160 million Series B funding round to advance its compact molten-salt reactor for floating nuclear SMR power barge applications in Southeast Asia [7].
  • SolarDuck (April 2024): Deployed its Merganser demonstrator—a modular floating solar PV power plant rated at 0.5 MW—offshore the Netherlands, validated for North Sea wave conditions [3].
  • U.S. Department of Energy (February 2024): Awarded USD 48 million across four floating offshore wind technology development projects under the Floating Offshore Wind Shot initiative, targeting LCOE below USD 0.045/kWh by 2035 [4].
  • India Ministry of New and Renewable Energy (December 2023): Issued guidelines for 4 GW of floating solar PV power plant capacity on state-owned reservoirs, with viability gap funding of INR 3,500 crore [3].


Floating Power Plant Market Report Scope

Parameter Detail
Market Scope Global Floating Power Plant Market, covering floating wind, floating solar PV, floating LNG/gas, floating nuclear, and hybrid floating power platforms
Study Period 2021–2035
CAGR 8.4% (2026–2035)
Market Size: 2025 (Base Year) USD 1.78 Billion
Market Size: 2035 (Forecast End) USD 4.12 Billion
Fastest Growing Segment Floating Solar PV (by CAGR); Renewable (by absolute share)
Companies Profiled 10 (Equinor, Principle Power, BW Ideol, Karpowership, Golar LNG, Moss Maritime, Seaborg Technologies, SolarDuck, Seatrium, CORE Power)
Valuation Currency USD (constant 2025 dollars)


FAQs

What insurance structures cover floating power assets against extreme weather events?

Marine hull-and-machinery policies paired with parametric weather triggers now dominate coverage for floating wind and barge-mounted floating power plant assets. Lloyd's of London syndicate 2003 introduced a dedicated floating energy facility endorsement in 2024, covering wave-height exceedances and mooring-failure events [11].

How do floating power plants connect to onshore grids in deep-water locations?

Dynamic export cables rated for water depths beyond 200 meters link floating platforms to seabed junction boxes, which feed static cables to shore. The Floating Power Plant Market is adopting 66 kV inter-array cables to reduce electrical losses by 15–20% compared to legacy 33 kV configurations [5].

What decommissioning obligations apply to floating power installations?

Most jurisdictions require operators to post decommissioning bonds equal to 10–15% of capital expenditure before construction permits are issued. The Floating Power Plant Market benefits from hull reusability—unlike fixed-bottom structures, floating hulls can be towed to shipyards for refurbishment or redeployment [12].

How do modular floating power units compare with land-based microgrids for island electrification?

Modular floating power unit systems deliver power 40–60% faster than land-based microgrids because they skip land-acquisition and civil-works phases. Per-kWh costs converge with onshore diesel microgrids at the 25 MW scale, making the Floating Power Plant Market increasingly competitive for islands above 10,000 inhabitants [6].

What role do classification societies play in floating power plant approval?

DNV, Bureau Veritas, and Lloyd's Register issue class notations specific to floating energy installations, covering hull structural integrity, mooring fatigue life, and electrical system redundancy. Classification adds 6–12 months to project timelines but is mandatory for securing project-finance debt above USD 100 million.

Can floating nuclear SMR power barge designs obtain regulatory approval before 2030?

Seaborg and CORE Power target type-approval submissions by 2028 under Danish and UK nuclear regulatory frameworks. The Floating Power Plant Market's nuclear sub-segment depends on establishing maritime-nuclear hybrid classification standards that currently do not exist [7].

How does biofouling affect the operational efficiency of floating solar PV power plant arrays?

Biofouling on submerged float structures can reduce buoyancy by 5–8% annually and increase drag loads on mooring lines. Anti-fouling coatings derived from offshore oil-platform technology extend maintenance intervals to 18–24 months, keeping lifecycle O&M costs below USD 12/MWh for the Floating Power Plant Market's solar segment [3].


Author
Author
Author Profile
Anshula Mandaokar LinkedIn
Team Lead - Research
Anshula Mandaokar holds an academic degree in Chemical Engineering and has been contributing to the field for more than 5 years. She has expertise in Market Research and Business Consulting and serves as a Team Lead for a reputed Market Research firm under the Chemicals and Materials domain spectrum. She has worked on multiple projects, generating explicit results in a quick turnaround time. Her understanding of data interpretation justifies her role as a leader.

Research Approach


Secondary Research

The secondary research process involved comprehensive analysis of regulatory databases, energy statistics repositories, maritime classification records, and authoritative power generation publications. Key sources included the International Energy Agency (IEA), U.S. Energy Information Administration (EIA), International Renewable Energy Agency (IRENA), International Maritime Organization (IMO), International Atomic Energy Agency (IAEA), European Maritime Safety Agency (EMSA), World Nuclear Association (WNA), International Association of Marine Insurers (IUMI), American Society of Mechanical Engineers (ASME), Society of Naval Architects and Marine Engineers (SNAME), Institute of Electrical and Electronics Engineers (IEEE), U.S. Nuclear Regulatory Commission (NRC), European Nuclear Safety Regulators Group (ENSREG), China National Energy Administration (NEA), Japan Agency for Natural Resources and Energy (ANRE), and national maritime & energy ministry reports from key markets. These sources were used to collect installed capacity data, vessel deployment statistics, regulatory approval timelines, marine safety certifications, and technology-specific cost benchmarks for floating solar photovoltaic, floating wind, floating nuclear, and gas turbine-based power barge technologies.


Primary Research

Qualitative and quantitative insights were obtained by interviewing supply-side and demand-side stakeholders during the primary research process. Supply-side sources comprised CEOs, VPs of Engineering, marine operations directors, and project development leaders from naval architecture firms, EPC contractors, and floating power plant manufacturers. Demand-side sources included chief investment officers from independent power producers (IPPs), utility grid planning directors, port authority energy managers, and procurement leaders from offshore oil and gas operators that required captive power solutions. The platform segmentation was validated, vessel construction timelines were confirmed, and insights regarding offshore grid connection standards, charter pricing models, and regulatory conformance requirements for dual-use maritime assets were gathered through primary research.

Primary Respondent Breakdown:

By Designation: C-level Primaries (30%), Director Level (35%), Others (35%)

By Region: North America (28%), Europe (32%), Asia-Pacific (25%), Rest of World (15%)


Market Size Estimation

Capacity deployment mapping and vessel-specific revenue analysis were employed to determine the global market valuation. The methodology comprised the following:

The identification of over 40 significant manufacturers in North America, Europe, Asia-Pacific, and Latin America who specialize in power ships, power barges, and floating structures

Technology mapping for floating solar photovoltaic (FPV), floating offshore wind (FOW), floating wind and wave hybrid, floating nuclear power plants (FNPP), and gas turbine power vessels

Examination of annual revenues that are specific to floating power generation portfolios, including EPC contract values and charter rates, as reported and modeled

70-75% of the global market share in 2024 will be represented by manufacturers and vessel operators.

Extrapolation is employed to generate segment-specific valuations by combining bottom-up (installed MW capacity × unit CAPEX/OPEX by country/technology) and top-down (shipyard revenue validation and maritime fleet valuation) methods.

Download Free Sample

Kindly complete the form below to receive a free sample of this Report

Download PDF ×

We do not share your information with anyone. However, we may send you emails based on your report interest from time to time. You may contact us at any time to opt-out.