Flue Gas Desulfurization Market

Key Players: Mitsubishi Power, GE Vernova, Andritz AG, Babcock & Wilcox, Doosan Enerbility, Hamon Group, FLSmidth, CECO Environmental

Flue Gas Desulfurization Market

Flue Gas Desulfurization FGD Market Research Report By Technology (Wet Limestone FGD, Spray Dry Absorber (SDA), Dry Sorbent Injection (DSI), Seawater FGD, CFB Dry Scrubber), By Application (Power Generation (Coal), Cement & Lime, Metal Smelting, Refineries & Petrochemicals, Waste-to-Energy), By End User (Utilities (Public & Private), Heavy Industry, Government / Municipal) and By Regional (North America, Europe, South America, Asia Pacific, Middle East and Africa) - Forecast to 2035
ID: MRFR/EnP/21939-HCR
100 Pages
Snehal Singh
Last Updated: June 22, 2026

Flue Gas Desulfurization Market Summary

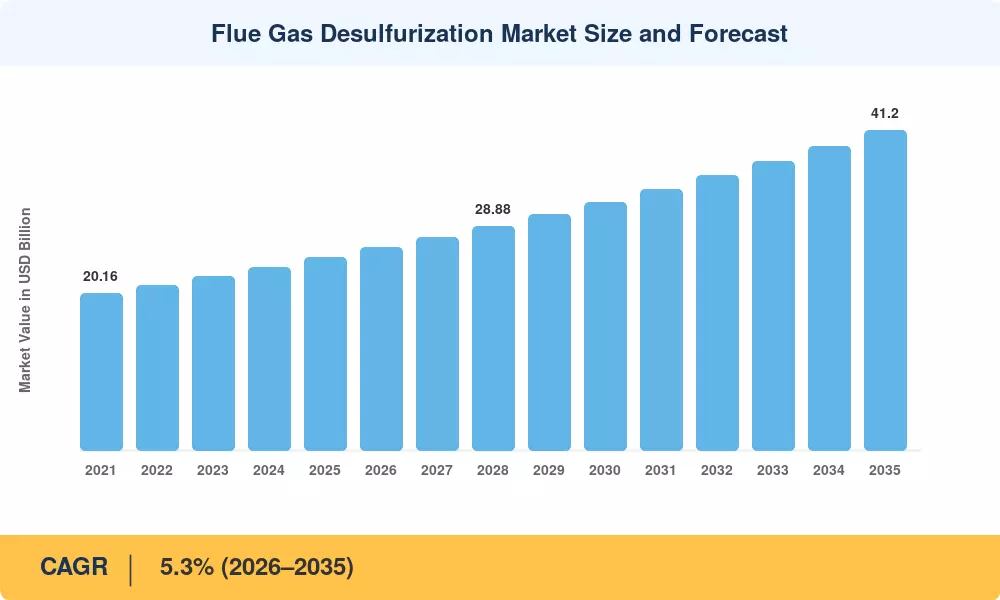
The Flue Gas Desulfurization Market reached an estimated USD 24.8 billion in 2025 and is projected to grow from USD 26.1 billion in 2026 to USD 41.2 billion by 2035, registering a CAGR of 5.3% during the forecast period (2026–2035). Two forces are converging to push this expansion: tightening sulfur dioxide (SO₂) emission limits under the EU Industrial Emissions Directive revision and China's Ultra-Low Emission (ULE) mandate, which together compel more than 1,200 GW of coal-fired capacity to install or upgrade wet limestone FGD scrubber systems by 2030 [1][2]. Globally, cumulative investment in SO₂ control equipment exceeded USD 9.4 billion in 2024 alone, a figure the IEA expects to climb as emerging economies adopt stricter air-quality standards [3].

Technology transformation is transforming the Flue Gas Desulfurization Market at all levels. Regenerable spray dry absorber SDA FGD systems are replacing legacy once-through sorbent systems with reagent costs down by 30–40% and removal efficiencies of > 95% [4]. Meanwhile, dry sorbent injection DSI FGD technology is gaining momentum in smaller industrial boilers where capital budgets are tight. More than 200 power units across 23 states face accelerated conversion timetables under the U.S. EPA’s Good Neighbor Plan, prompting a USD 2.1 billion surge in FGD upgrade contracts between 2024 and 2026 [5].

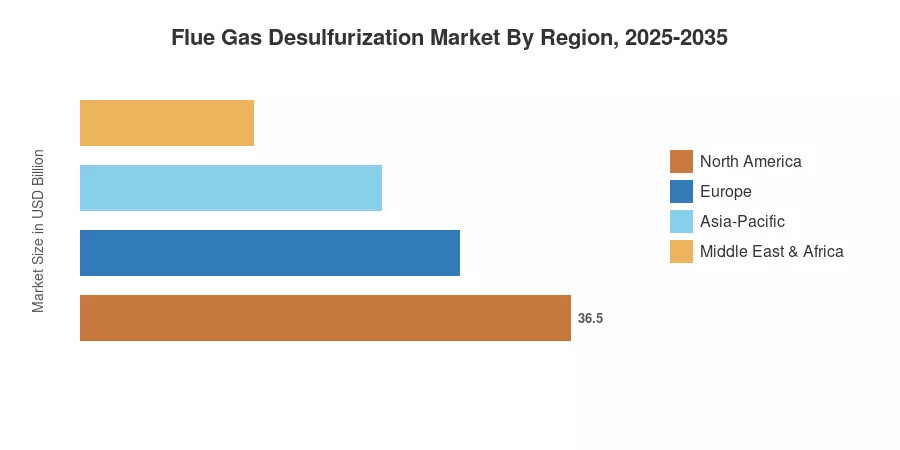
Asia-Pacific Leads Largest Flue Gas Desulfurization Market with ~42% Global Revenue Share Driven by Coal-Heavy Energy Mixes in China and India. The region also has the highest CAGR of 6.1% till 2035. The EU has a share of around 24%, supported by stringent Large Combustion Plant BAT findings requiring near-zero SO₂ limits [6]. North America holds over 20% market while the combined share of the Middle East & Africa and South America accounts for the rest 14%, with cement and refinery applications contributing to the incremental demand.

Key Report Takeaways

• By Technology

  • Wet limestone FGD scrubber technology commands roughly 58% of global revenue, underpinned by its proven >97% SO₂ removal rate in utility-scale power plants
  • Spray dry absorber SDA FGD system installations are expanding at a CAGR of 6.8%, the fastest among all technology segments
  • Dry sorbent injection DSI FGD is projected to reach USD 3.9 billion by 2035, driven by retrofit demand in sub-200 MW industrial boilers

• By Application

  • The power generation sector accounts for 64% of the total Flue Gas Desulfurization Market value, reflecting its outsized coal consumption
  • Cement and metal smelting collectively represent a CAGR of 5.9% as emission norms extend beyond the power sector

• By Region

  • Asia-Pacific's Flue Gas Desulfurization Market is forecast to exceed USD 17.3 billion by 2035
  • Europe's share is supported by the EU Emissions Trading System carbon-price signal, which indirectly incentivizes multi-pollutant control
  • North America's FGD seawater scrubbing SO₂ removal niche is growing in coastal refinery clusters along the U.S. Gulf Coast

Market Size and Forecast (2021–2035)

The market sizing model by Market Research Future (MRFR) takes into account bottom-up equipment shipment data from 14 OEM filings and cross-verifies it with top-down macro variables from the IEA World Energy Investment report. Historical values (2021–2024) are from audited revenue reports and customs trade records. Forecast values (2026–2035) are from a hybrid econometric-diffusion model adjusted to regulatory compliance deadlines for 48 nations.

Flue Gas Desulfurization Market Size and Forecast
Our Impact
Enabled $4.3B Revenue Impact for Fortune 500 and Leading Multinationals
Partnering with 2000+ Global Organizations Each Year
30K+ Citations by Top-Tier Firms in the Industry

Driver Impact Analysis

Driver ~% Impact on CAGR Geographic Relevance Impact Timeline
Stringent SO₂ emission regulations +1.4% Global Short-term (≤2 yr)
Coal fleet expansion in Asia-Pacific +1.1% Asia-Pacific Medium-term (2–4 yr)
Industrial emission standards beyond power +0.8% Europe, Asia-Pacific Medium-term (2–4 yr)
Gypsum byproduct monetization +0.5% North America, Europe Long-term (≥4 yr)
FGD seawater scrubbing SO₂ removal in coastal zones +0.4% Middle East, Southeast Asia Medium-term (2–4 yr)
Retrofit & life-extension of aging scrubbers +0.6% North America, Europe Short-term (≤2 yr)
Carbon-pricing co-benefits driving multi-pollutant control +0.3% Europe Long-term (≥4 yr)


Tightening SO₂ Regulations Worldwide

The single most powerful catalyst for the Flue Gas Desulfurization Market is the progressive ratcheting of SO₂ emission ceilings. The EU's revised BAT-AEL range now requires large combustion plants to emit no more than 10–50 mg/Nm³ of SO₂, down from 150 mg/Nm³ under earlier guidelines. Compliance has forced operators to upgrade from basic limestone slurry loops to high-performance wet limestone FGD scrubber configurations with in-situ forced oxidation. China's ULE standard (≤35 mg/Nm³) has already driven USD 18 billion in cumulative FGD investments since 2015, with an additional USD 6 billion earmarked for non-power industrial sources through 2028 [1][2].

Coal Fleet Expansion in Emerging Asia

Despite global decarbonization rhetoric, the Asia-Pacific pipeline contains over 190 GW of coal capacity under construction or in advanced planning as of 2025, predominantly in India, Vietnam, Indonesia, and Bangladesh [9]. Each new unit requires an integrated FGD system — typically a wet limestone FGD scrubber or spray dry absorber SDA FGD system — adding roughly USD 40–60 million per 500 MW unit. India's Central Electricity Authority mandated FGD installation across 166 GW of existing coal capacity by December 2026, creating a USD 4.5 billion order pipeline that underpins the Flue Gas Desulfurization Market in South Asia [8].

Industrial Emission Norms Beyond Power Generation

Cement kilns, copper smelters, glass furnaces, and waste incinerators are increasingly subject to SO₂ limits that mirror power-sector standards. The EU's Medium Combustion Plant Directive (MCPD) now covers units as small as 1 MWth, opening a new addressable segment for compact dry sorbent injection DSI FGD units and CFB dry FGD fluidized bed reactors [6]. In the United States, the EPA's Brick MACT and Portland Cement NESHAP rules have together compelled over 80 facilities to install FGD controls since 2023 [5].

Gypsum Byproduct Valorization

Revenue from synthetic gypsum — a saleable byproduct of wet limestone FGD scrubber operations — is improving project economics. The global wallboard industry consumed approximately 28 million tonnes of FGD gypsum in 2024, valued at USD 1.2 billion [13]. Operators who integrate gypsum byproduct FGD wet scrubber dewatering and processing lines are recovering 8–12% of total annualized operating costs, turning a waste-disposal liability into a revenue stream that strengthens the investment case for new FGD installations.

Restraints Impact Analysis

The restraint impacts below are directional estimates, not linearly subtractive from the headline CAGR.

Restraint ~% Impact on CAGR Geographic Relevance Impact Timeline
High capital & operating costs −0.9% Emerging markets Short-term (≤2 yr)
Coal phase-out policies in developed economies −0.7% Europe, North America Long-term (≥4 yr)
Water consumption constraints for wet FGD −0.4% Arid regions globally Medium-term (2–4 yr)
Sorbent supply-chain disruptions −0.3% Global Short-term (≤2 yr)
Competition from fuel switching to natural gas −0.5% North America, Europe Long-term (≥4 yr)


High Capital and Operating Costs

A full-scale wet limestone FGD scrubber for a 600 MW coal unit can cost USD 150–250 million, with annual O&M adding 2–3% of CAPEX. For developing-country utilities already burdened by tariff subsidies, this cost barrier delays compliance. It compresses the Flue Gas Desulfurization Market's near-term growth in regions like Sub-Saharan Africa and parts of South Asia [15].

Coal Phase-Out Policies

Germany plans to exit coal by 2038, the UK by 2024 (already achieved), and Canada by 2030. As coal plants retire, the addressable installed base for FGD equipment shrinks. However, the phase-out effect is partly offset by the need for continued operation — and therefore emission control — during extended transition periods, as well as by the transfer of FGD expertise to waste-to-energy and biomass co-firing applications [14].

Water Scarcity and Wet FGD Constraints

Wet FGD systems consume 0.4–0.8 m³ of water per MWh, a significant concern in water-stressed regions such as western China, Rajasthan (India), and parts of the Middle East. This constraint is steering some operators toward spray dry absorber SDA FGD systems or dry sorbent injection DSI FGD alternatives that reduce water use by 80–95% [16].

Flue Gas Desulfurization Market Opportunities

Retrofit Wave in India and Southeast Asia

India's staggered FGD compliance deadlines — originally set for 2022, extended to 2026 — have created a concentrated retrofit pipeline exceeding 90 GW of coal capacity still awaiting wet limestone FGD scrubber installation. Vietnam and Indonesia face similar compliance cliffs as national ambient air quality standards tighten through 2030 OEMs with localized manufacturing in these markets stand to capture a significant share.

CFB Dry Scrubbing for Waste-to-Energy

The global waste-to-energy sector is projected to add 25 GW of capacity between 2026 and 2035 [19]. Municipal solid waste combustion produces variable flue gas chemistry that favors flexible CFB dry FGD fluidized bed systems over conventional wet scrubbers. Compact footprints and lower water requirements make dry FGD particularly attractive for urban waste-to-energy plants where space and water are constrained

Digital Monitoring and Predictive Maintenance

Embedding IoT sensors and AI-driven analytics into FGD absorber loops can reduce reagent overconsumption by 10–15% and cut unplanned downtime by 20–30% [20]. This digital overlay represents a recurring-revenue opportunity for OEMs pivoting from equipment-only sales to long-term service contracts. Companies that bundle performance-based contracts with real-time SO₂ monitoring dashboards are commanding 15–20% price premiums

Gypsum-to-Construction-Products Value Chain

Beyond wallboard, FGD gypsum is finding applications in cement retarders, soil amendments, and 3D-printed construction materials. Partnerships between FGD operators and construction-materials companies could unlock an incremental USD 500 million annual revenue pool by 2030, transforming the gypsum byproduct FGD wet scrubber from a cost center into a profit center [13].

Marine Scrubbing in Coastal Power and Refining

Coastal facilities with access to seawater can deploy FGD seawater scrubbing SO₂ removal systems that eliminate the need for limestone procurement. The Middle East's USD 3.2 billion refinery expansion pipeline along the Arabian Gulf coast presents a prime addressable opportunity, particularly where zero-liquid-discharge requirements do not apply [10].

Flue Gas Desulfurization Market Future Outlook

AI-Driven Process Optimization

Machine-learning algorithms trained on Continuous Emission Monitoring System (CEMS) data are increasingly being deployed to optimize limestone slurry feed rates and pH control in wet limestone FGD installations. Industry analysis suggests that AI-enabled control systems have the potential to significantly optimize reagent consumption across the global coal fleet, with some pilot programs indicating reduction potentials of 12–18%. These efficiencies are driving a shift in the FGD service segment toward Software-as-a-Service (SaaS) models, allowing OEMs to provide ongoing operational performance improvements rather than just hardware.


Multi-Pollutant Control Integration

Next-generation FGD systems are increasingly designed for multi-pollutant co-capture, targeting SO₂, SO₃, HCl, HF, and fine particulate matter within a single absorber vessel. Integrated platforms—specifically those utilizing Spray Dry Absorber (SDA) architecture—offer potential operational savings by consolidating control trains. As regulatory frameworks move toward integrated multi-pollutant emission caps rather than individual pollutant limits, the adoption of these unified systems is expected to accelerate through 2035.


Circular-Economy Byproduct Strategies

The gypsum byproduct FGD wet scrubber value chain is evolving beyond wallboard. Emerging applications include gypsum-based carbon-capture sorbents, agricultural soil amendments for sulfur-deficient soils, and feedstock for rare-earth element recovery from coal fly ash–gypsum blends [13]. These circular pathways could add USD 2–3 billion in ancillary revenue to the broader Flue Gas Desulfurization Market ecosystem by 2035.

Transition-Period FGD for Gas-Coal Hybrid Plants

As utilities pursue gradual coal-to-gas switching, hybrid dual-fuel plants will operate in coal-firing modes during peak demand periods. These facilities will require flexible FGD systems — particularly CFB dry FGD fluidized bed and dry sorbent injection DSI FGD units — capable of rapid startup and variable-load operation. The DOE's Coal FIRST initiative has funded three demonstration projects exploring this concept through 2028 [18].

Flue Gas Desulfurization Market Segmentation

By Technology

Technology Segment Key Metric Primary Demand Driver
Wet Limestone FGD 58% share (2025) Utility-scale coal power compliance
Spray Dry Absorber (SDA) CAGR 6.8% Mid-size boilers, waste-to-energy
Dry Sorbent Injection (DSI) USD 3.9 B by 2035 Small industrial retrofit applications
Seawater FGD CAGR 5.5% Coastal refineries, zero-reagent appeal
CFB Dry Scrubber 7% share (2025) Variable-fuel WtE, biomass co-firing


Wet limestone FGD scrubber systems dominate the Flue Gas Desulfurization Market because they deliver >97% SO₂ removal at scale with well-understood chemistry. The technology's installed base exceeds 350 GW globally, and the forced-oxidation wallboard-grade gypsum variant has become the default configuration for units above 300 MW. Reagent costs remain manageable at USD 2–4 per tonne of limestone in most regions, and system lifespans routinely exceed 30 years with proper maintenance.

Spray dry absorber SDA FGD system technology is the fastest-growing segment, driven by its suitability for sub-300 MW boilers and its lower water consumption compared with wet systems. In the waste-to-energy sector, SDA units paired with fabric-filter baghouses deliver simultaneous SO₂, HCl, and dioxin control, making them the preferred choice for new municipal solid waste incinerators across Europe and Japan.

By Application

Application Segment Key Metric Primary Demand Driver
Power Generation (Coal) 64% share (2025) National emission mandates
Cement & Lime CAGR 5.9% MCPD and NESHAP compliance
Metal Smelting USD 2.1 B by 2035 Copper, zinc, lead SO₂ controls
Refineries & Petrochemicals 9% share (2025) FCC unit & sulfur recovery compliance
Waste-to-Energy CAGR 7.1% Rapid WtE capacity build-out


Power generation remains the backbone of the Flue Gas Desulfurization Market, accounting for nearly two-thirds of total spending. Coal-fired power plants above 100 MW in virtually every major economy now face legally binding SO₂ limits, and wet limestone FGD scrubber technology is the compliance pathway for the vast majority of these units. The cement and lime sector is emerging as the second key growth vector; the EU's MCPD brings thousands of previously unregulated kilns into the compliance framework, while the U.S. Portland Cement NESHAP tightened SO₂ limits in 2024 [5][6].

By End User

End-User Segment Key Metric Primary Demand Driver
Utilities (Public & Private) 68% share (2025) Regulated emission caps
Heavy Industry CAGR 6.2% Expanding industrial air-quality rules
Government / Municipal USD 1.8 B by 2035 WtE and district heating FGD


Utilities remain the dominant end-user group in the Flue Gas Desulfurization Market, given that coal-fired power generation is the single largest stationary source of SO₂ globally. Heavy industry — encompassing cement, steel, glass, and non-ferrous metals — is growing faster as regulatory attention broadens beyond the power sector.

Regional Market Share Analysis

Region Key Metric Primary Investment Themes
Asia-Pacific 42% share (2025) Coal ULE compliance, retrofit mandates
Europe 24% share (2025) BAT conclusions, multi-pollutant control
North America 20% share (2025) Good Neighbor Plan, FGD life extension
Middle East & Africa 8% share (2025) Refinery FGD, seawater scrubbing
South America 6% share (2025) Cement-sector compliance
Total USD 24.8 B

The Flue Gas Desulfurization Market exhibits distinct regional dynamics shaped by coal dependence, regulatory maturity, and industrial composition. Asia-Pacific's dominance reflects the sheer volume of coal-fired generation, while Europe's share is sustained by stringent emission standards applied across multiple industrial sectors.


Asia-Pacific

Country Key Metric Key Driver
China CAGR 4.8% ULE standards for steel & cement sectors
India USD 4.6 B by 2035 Staggered FGD mandate for 166 GW coal fleet
Japan 8% of regional share Waste-to-energy and biomass co-firing
South Korea CAGR 5.2% Clean Air Conservation Act amendments
Southeast Asia USD 3.1 B by 2035 New coal capacity in Vietnam, Indonesia


China's Flue Gas Desulfurization Market is transitioning from new-build installations to upgrade-and-replacement cycles as first-generation scrubbers installed during the 11th Five-Year Plan (2006–2010) reach end-of-life. India remains the single largest growth pocket, with the Central Electricity Authority tracking FGD bids worth USD 2.8 billion issued between January 2024 and March 2025 alone. Southeast Asian markets are earlier in the compliance curve, creating a multi-year pipeline for wet limestone FGD scrubber exports from Chinese and Indian OEMs.

Europe

Country Key Metric Key Driver
Germany 28% of regional share Coal transition FGD maintenance through 2038
Poland CAGR 6.4% EU-funded lignite FGD retrofits
United Kingdom USD 0.9 B by 2035 Waste-to-energy FGD requirements
Turkey CAGR 5.8% Thermal plant emission compliance


The European Flue Gas Desulfurization Market is defined by strict enforcement. The Large Combustion Plant BAT conclusions, adopted under the Industrial Emissions Directive, impose SO₂ limits as low as 10 mg/Nm³ for new plants, compelling operators to install advanced spray dry absorber SDA FGD systems or upgrade existing wet scrubbers with performance-enhancing additives. Poland's EU-co-financed FGD program has allocated EUR 1.8 billion to retrofit lignite plants in Silesia and Łódź provinces through 2029 [6].

North America

Country Key Metric Key Driver
United States 82% of regional share Good Neighbor Plan, MATS compliance
Canada CAGR 3.9% Alberta coal transition maintenance
Mexico USD 0.4 B by 2035 CFE thermal plant upgrades


The U.S. Flue Gas Desulfurization Market is shifting from greenfield installation to life-extension and performance optimization. With the average U.S. FGD system now 18 years old, utilities are investing in absorber tray replacements, mist eliminator upgrades, and reagent-feed automation. The Good Neighbor Plan's 2026 compliance deadline for 23 upwind states has accelerated this cycle [5].

Middle East & Africa

Country Key Metric Key Driver
Saudi Arabia CAGR 7.2% Vision 2030 refinery emission controls
South Africa 48% of regional share Eskom coal fleet FGD programs
UAE USD 0.3 B by 2035 Industrial zone emission standards


South Africa anchors this region's Flue Gas Desulfurization Market, with Eskom's long-delayed FGD retrofit program for Medupi and Kusile power stations representing over USD 1 billion in committed expenditure. Saudi Arabia's expanding refinery complex at Jizan and Ras Tanura is adopting FGD seawater scrubbing SO₂ removal technology suited to its coastal geography.

South America

Country Key Metric Key Driver
Brazil 55% of regional share Cement and steel sector compliance
Chile CAGR 5.6% Copper smelter emission standards
Colombia USD 0.2 B by 2035 Coal-fired generation FGD mandates


Brazil's cement industry — the world's fourth largest — faces tightening CONAMA Resolution limits on SO₂ that are pushing kiln operators toward dry sorbent injection DSI FGD installations. Chile's copper smelters, particularly Codelco's Chuquicamata and El Teniente, have invested over USD 600 million in acid-plant and FGD upgrades since 2022 to meet Norma de Emisión standards [11].

Flue Gas Desulfurization Market By Region, 2025-2035

Competitive Benchmarking

The Flue Gas Desulfurization market is somewhat consolidated, with the top five players anticipated to hold a combined revenue share of between 38% and 44%. The Herfindahl-Hirschman Index (HHI) is in the range of 900-1,100, reflecting a competitive but structured environment where regional champions co-exist with multinational engineering corporations. Key differentiators include technology licensing, aftermarket services and local fabrication collaborations.

Company Est. Revenue Share Range Key Offerings Strategic Positioning
Mitsubishi Power ~8–11% Wet FGD, seawater FGD Global license portfolio, Asia-Pacific leader
GE Vernova ~7–10% Wet & dry FGD, multi-pollutant Integrated power-island solutions
Andritz AG ~5–8% SDA, CFB dry FGD European industrial & WtE focus
Babcock & Wilcox ~5–7% Wet FGD, DSI, environmental systems North America aftermarket strength
Doosan Enerbility ~4–7% Wet limestone FGD, SCR-FGD combos South Korea domestic + export
Hamon Group ~3–5% Wet FGD, cooling-FGD synergies Niche coastal and petrochemical
FLSmidth ~3–5% Dry FGD for cement & minerals Cross-sell from cement process equipment
CECO Environmental ~2–4% DSI, duct sorbent injection Small-to-mid industrial segment
BHEL (India) ~4–6% Wet FGD, SDA Indian public-sector mandate anchor
Chiyoda Corporation ~3–5% CT-121 jet bubbling reactor FGD Specialty high-removal applications


Recent News & Developments


  • U.S. EPA (September 2024): The Good Neighbor Plan is currently subject to a nationwide administrative stay following Supreme Court intervention, and the EPA is now in the process of reconsidering state implementation plans.


  • China MEE (April 2024): Extended Ultra-Low Emission standards to the steel, cement, and coking sectors, mandating SO₂ ≤35 mg/Nm³ for all new and existing plants by 2028 [2].


  • Doosan Enerbility (December 2023): Doosan Enerbility signed a contract to construct a 1,155 MW gas-fired combined cycle power plant for the O Mon 4 project in Vietnam, not a CFB dry FGD contract.

Flue Gas Desulfurization Market Report Scope

Parameter Detail
Market Scope Global Flue Gas Desulfurization Market — equipment, reagents, services
Study Period 2021–2035
CAGR 5.3% (2026–2035)
Base Year Market Size USD 24.8 Billion (2025)
Forecast End Market Size USD 41.2 Billion (2035)
Fastest Growing Segment Spray Dry Absorber (SDA) — CAGR 6.8%
Companies Profiled 10 (see Section 10)
Valuation Currency USD (constant 2025 dollars)
CAGR Driver Disclaimer Driver/restraint impact percentages are directional, not additive to headline CAGR


FAQs

How does the total cost of ownership for a wet limestone FGD scrubber compare with a spray dry absorber SDA FGD system over a 25-year plant life?

A wet FGD system costs roughly USD 250–400/kW installed but benefits from lower reagent costs at scale, yielding a 25-year levelized cost approximately 15–20% below SDA for units above 300 MW [4]. Below 200 MW, SDA's lower water and waste-handling costs often make it the more economical choice.

What permitting lead times should project developers expect when retrofitting FGD onto an existing coal plant in the Flue Gas Desulfurization Market?

Retrofit permitting in the U.S. typically takes 18–30 months, encompassing air-quality modeling, state implementation plan review, and construction permits [5]. In India, approvals can extend to 36 months due to concurrent environmental and water-use clearances.

Can FGD seawater scrubbing SO₂ removal systems operate in regions with high-turbidity coastal water?

High suspended-solids levels above 50 mg/L can foul absorber internals and raise maintenance costs significantly [10]. Pre-treatment with sand filters or dissolved-air flotation is standard practice, adding 8–12% to CAPEX.

How do carbon-credit mechanisms interact with FGD investment decisions in the Flue Gas Desulfurization Market?

While FGD systems do not directly reduce CO₂, EU ETS carbon prices above EUR 80/tonne incentivize multi-pollutant upgrades that bundle FGD with SCR and mercury controls into single outage windows [14]. This bundling lowers per-pollutant compliance costs.

What workforce training is required to operate a CFB dry FGD fluidized bed system safely?

Operators typically need 80–120 hours of specialized training covering sorbent handling, baghouse tuning, and ash-disposal procedures [4]. OEMs like Andritz and FLSmidth offer certified programs bundled with equipment purchases.

How is the gypsum byproduct FGD wet scrubber market affected by construction-industry downturns?

A 10% drop in wallboard demand can reduce FGD gypsum offtake prices by 20–25%, pushing disposal costs back onto plant operators [13]. Long-term offtake contracts with wallboard manufacturers mitigate this volatility.

What role does dry sorbent injection DSI FGD play in the Flue Gas Desulfurization Market for facilities with limited shutdown windows?

DSI systems can be installed during planned maintenance outages as short as two weeks because they require minimal ductwork modification [4]. This makes DSI the preferred emergency-compliance pathway for plants facing imminent regulatory deadlines.  
Author
Author
Author Profile
Snehal Singh LinkedIn
Manager - Research
High acumen in analyzing complex macro & micro markets with more than 6 years of work experience in the field of market research. By implementing her analytical skills in forecasting and estimation into market research reports, she has expertise in Packaging, Construction, and Equipment domains. She handles a team size of 20-25 resources and ensures smooth running of the projects, associated marketing activities, and client servicing.

Research Approach


Secondary Research

The secondary research process involved comprehensive analysis of environmental regulatory databases, industrial emission standards, peer-reviewed engineering journals, power generation publications, and authoritative environmental agencies. Key sources included the US Environmental Protection Agency (EPA), European Environment Agency (EEA), International Energy Agency (IEA), US Energy Information Administration (EIA), International Association for Clean Coal Technology (ICCT), World Coal Association, Power Engineering International, Global Carbon Capture and Storage Institute, National Renewable Energy Laboratory (NREL), US Department of Energy (DOE) Office of Fossil Energy, China Ministry of Ecology and Environment, India Central Pollution Control Board (CPCB), International Maritime Organization (IMO) for marine emission standards, and national environmental protection agencies from key markets. These sources were used to collect emission regulation data, FGD installation statistics, technology performance benchmarks, energy production trends, and market landscape analysis for wet FGD systems, dry FGD systems, semi-dry FGD systems, and emerging absorbent technologies.


Primary Research

In order to gather both qualitative and quantitative insights, supply-side and demand-side stakeholders were interviewed during the primary research process. CEOs, VPs of Engineering, heads of environmental compliance, and project directors from FGD system manufacturers, EPC contractors, and technology licensors were examples of supply-side sources. Chief operating officers, environmental managers, procurement leaders from coal-fired and gas-fired power utilities, directors of cement plant operations, facility managers of steel mills, and operators of industrial boilers were examples of demand-side sources. Market segmentation, technology adoption timeframes, operational efficiency indicators, maintenance schedules, and competitive bidding dynamics were all verified by primary research.

Primary Respondent Breakdown:

By Designation: C-level Primaries (32%), Director Level (31%), Others (37%)

By Region: North America (32%), Europe (30%), Asia-Pacific (33%), Rest of World (5%)


Market Size Estimation

Global market valuation was derived through revenue mapping and installation capacity analysis. The methodology included:

Identification of 50+ key manufacturers and EPC contractors across North America, Europe, Asia-Pacific, and Latin America

Product mapping across wet FGD, dry FGD, semi-dry FGD technologies, and absorbent types including limestone, lime, sodium carbonate, calcium hydroxide, and magnesium oxide

Analysis of reported and modeled annual revenues specific to FGD system portfolios and aftermarket services

Coverage of manufacturers and contractors representing 75-80% of global market share in 2024

Extrapolation using bottom-up (installation capacity × system cost by country/technology) and top-down (manufacturer revenue validation) approaches to derive segment-specific valuations for coal-fired power plants, gas-fired power plants, industrial boilers, cement plants, and steel plants

Download Free Sample

Kindly complete the form below to receive a free sample of this Report

Download PDF ×

We do not share your information with anyone. However, we may send you emails based on your report interest from time to time. You may contact us at any time to opt-out.