Food Glazing Agents Market (2026 - 2035)

Food Glazing Agents Market Size, Share, Industry Trend & Analysis Research Report Information By Type (Stearic Acid, Candelilla Wax, Carnauba Wax, Beeswax, Shellac, Other Types), By Application (Bakery, Confectionery, Processed Meat, Poultry and Seafood, Fruits and Vegetables, Other Applications), By Source (Plant-Derived, Animal and Insect-Derived, Mineral and Synthetic), By Geography (North America, Europe, Asia-Pacific, South America, Middle East & Africa) – Forecast Till 2035

Forecast Period
2026-2035
CAGR
5.9%
2025 Market Size
USD 2.71 Billion
2035 Market Size
USD 4.81 Billion
Food, Beverages & Nutrition ● Updated August 25, 2026 Report ID: MRFR/FnB/1671-HCR | Pages: 110 | Author: Varsha More

Food Glazing Agents Market Summary

The Food Glazing Agents Market reached USD 2.71 Billion in 2025 and opens the forecast window at USD 2.87 Billion in 2026, climbing to USD 4.81 Billion by 2035 at a 5.9% CAGR. Two catalysts anchor that trajectory. The European Union's continued tightening of additive purity criteria under Regulation (EU) No 231/2012 has forced reformulation across coating portfolios, while India's Production Linked Incentive scheme for food processing — sanctioned at roughly USD 1.3 billion — has expanded industrial bakery and confectionery capacity that consumes coating chemistry at scale [1][2].

The chemistry of wax is evolving. Plant-sourced carnauba, candelilla, and rice bran wax dispersions, as well as water-based emulsions that eradicate solvent carryover, are replacing petroleum-derived microcrystalline films and older shellac grades. The Food Glazing Agents Market is consolidating around cleaner, traceable inputs, as evidenced by the combined commitment of over USD 90 million to emulsion capacity and allergen-segregated lines by Freudenberg's confectionery coatings subsidiary and RPM International's food coatings unit since 2023 [3][4].

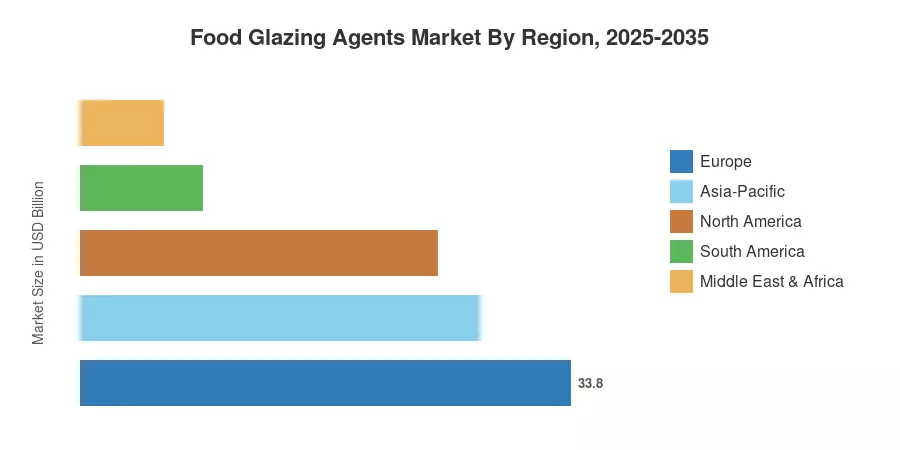
Dense confectionery manufacturing in Germany, Belgium, and Italy is the reason why Europe accounts for 33.8% of global value when viewed regionally. The industrialization of Chinese and Indian bakery chains is driving the fastest growth in the Asia-Pacific region, with a compound annual growth rate (CAGR) of 7.3%. Fresh-produce coating mandates in retail supply agreements are the primary factor driving North America's 24.6% market share, which follows Europe. The Food Glazing Agents Market will be influenced by the substitution economics of natural versus synthetic coatings, rather than volume growth, through 2035.


Key Report Takeaways

• By Type

  • Stearic acid holds 24.2% of global value, the largest single type position in the Food Glazing Agents Market.
  • Carnauba wax generated USD 0.59 Billion in 2025 on confectionery and produce demand.
  • Shellac is expanding at a 6.4% CAGR as pharmaceutical-grade purification spills into food use.

• By Application

  • Bakery accounted for USD 0.85 Billion in 2025, the anchor application
  • Confectionery captured a 26.8% share, concentrated in panned and coated formats
  • Fruits and vegetables are the fastest-growing application at a 6.7% CAGR

• By Region

  • Europe leads the Food Glazing Agents Market with a 33.8% share
  • Asia-Pacific posts a 7.3% CAGR, the highest of any region
  • Middle East & Africa contributed USD 0.15 Billion in 2025


Market Size and Forecast (2021–2035)

Estimates blend customs-level trade flows for wax and shellac imports, audited disclosures from coating formulators, and processor-side consumption interviews across 14 countries. Historical years are reconciled against Eurostat and FAO food-processing output indices; forecast years apply application-weighted growth rather than a single blended rate [5][6].
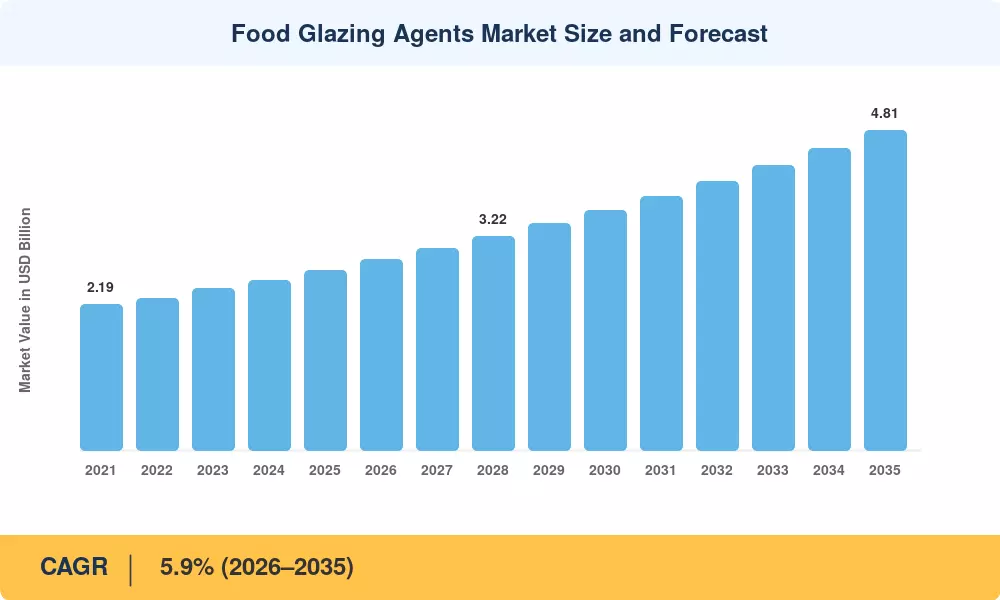
Food Glazing Agents Market Size and Forecast
Our Impact
Enabled $4.3B Revenue Impact for Fortune 500 and Leading Multinationals
Partnering with 2000+ Global Organizations Each Year
30K+ Citations by Top-Tier Firms in the Industry

Driver Impact Analysis

Driver ~% Impact on CAGR Geographic Relevance Impact Timeline
Industrial bakery and confectionery capacity growth ~26% Asia-Pacific, Europe Medium-term (2–4 yr)
Clean-label substitution away from synthetic films ~21% Europe, North America Long-term (≥4 yr)
Post-harvest loss reduction in fresh produce ~17% Asia-Pacific, South America Long-term (≥4 yr)
Retail shelf-appearance specifications ~13% North America, Europe Short-term (≤2 yr)
Cold-chain and export-distance expansion ~10% Middle East & Africa Medium-term (2–4 yr)
Rising per-capita confectionery consumption ~8% Asia-Pacific Medium-term (2–4 yr)
Vegan and halal certification demand ~5% Middle East & Africa, Asia-Pacific Short-term (≤2 yr)


Industrial Bakery and Confectionery Capacity Growth

Scale is the single largest lever on the Food Glazing Agents Market. India's Production Linked Incentive scheme for the food processing sector, notified at approximately INR 10,900 crore, has disbursed incentives against committed capacity that includes more than 60 bakery and ready-to-eat lines [2]. Each industrial line consumes coating material continuously rather than batch-wise, which converts capacity announcements into predictable multi-year offtake. France's biscuit and cake federation recorded that per-capita cake consumption is rising from 3.0 kg to 3.3 kg between 2021 and 2022, with biscuit intake steady at 5 kg — modest movement. However, across 68 million consumers it materially shifts coating volume [14].

Clean-Label Substitution Away From Synthetic Films

Reformulation pressure is structural. EFSA's re-evaluation programme for glazing additives has narrowed acceptable specifications for several mineral hydrocarbon grades, and roughly 41% of European confectionery launches tracked in 2024 carried a natural or plant-origin coating claim [11][16]. Substitution rarely reduces spend; plant waxes typically price 20–35% above mineral equivalents, so value migrates upward even where tonnage is flat.

Post-Harvest Loss Reduction in Fresh Produce

Losses remain the industry's quietest opportunity. FAO estimates that around 13% of food produced is lost between harvest and retail, with fruit and vegetable categories disproportionately affected [10]. Edible coatings extend saleable life by three to nine days depending on commodity, and large produce exporters in Chile, South Africa and Egypt have folded coating cost into landed-price models rather than treating it as discretionary.

Retail Shelf-Appearance Specifications

Buyers now write gloss into contracts. Major North American grocers include surface-finish and moisture-barrier clauses in private-label bakery agreements, and non-compliance triggers deduction schedules that can exceed 2% of invoice value [12]. That transfers specification authority from the processor to the retailer and locks in coating usage regardless of input cost cycles.


Restraints Impact Analysis

Restraint ~% Drag on CAGR Geographic Relevance Impact Timeline
Raw material harvest volatility (carnauba, shellac) ~29% South America, Asia-Pacific Short-term (≤2 yr)
Consumer resistance to insect-derived additives ~24% Europe, North America Long-term (≥4 yr)
Regulatory divergence across additive schedules ~19% Global Medium-term (2–4 yr)
Price premium versus uncoated alternatives ~16% Asia-Pacific, Africa Medium-term (2–4 yr)
Labelling complexity for E-number disclosure ~12% Europe Short-term (≤2 yr)


Raw Material Harvest Volatility

Supply is agricultural, not industrial. Carnauba is hand-harvested almost entirely in Brazil's Piauí, Ceará and Rio Grande do Norte states, and drought-affected 2022 harvests pushed Type 1 flake prices up by roughly 34% within nine months [8]. Shellac carries a similar profile: Indian lac production has fluctuated between 17,000 and 22,000 tonnes annually, and resin prices have swung more than 40% peak-to-trough since 2021 [9]. Formulators hedge by dual-sourcing candelilla, but candelilla itself is concentrated in northern Mexico.

Consumer Resistance to Insect-Derived Additives

Perception constrains shellac. Surveys of European vegan and vegetarian shoppers indicate that around 62% actively avoid confectionery declaring E904, and several private-label ranges have removed it outright [15]. Reformulating to plant waxes is technically feasible, but changes gloss retention and panning behaviour, which raises trial cost and slows conversion.

Regulatory Divergence Across Additive Schedules

Approval lists do not align. A coating cleared under Codex General Standard 192-1995 may still require dossier support for specific EU or Japanese uses, and maximum-use levels differ by category [17]. Exporters serving three or more jurisdictions typically maintain parallel formulations, adding an estimated 8–14% to formulation and compliance overhead.


Food Glazing Agents Market Opportunities

Water-Based Emulsion Platforms

Solvent-free emulsions are the clearest technical opening in the Food Glazing Agents Market. Ethanol-carrier shellac systems face tightening workplace exposure limits in the EU and North America, and water-dispersible carnauba and candelilla emulsions now deliver comparable gloss at 12–18% lower applied cost per tonne of product [3]. Suppliers that own emulsion capacity capture margin that pure wax traders cannot.

Fresh Produce Coating in Emerging Markets

Emerging-market produce is under-served. India, Indonesia and Nigeria together lose an estimated USD 18 billion of horticultural output annually to post-harvest deterioration. Yet, edible coating penetration in these markets sits in the low single digits [10]. Distribution partnerships with packhouse equipment vendors — rather than ingredient distributors — offer the fastest route to installed usage.

Certified Vegan and Halal Coating Lines

Certification is becoming a purchasing filter rather than a marketing claim. Malaysia's JAKIM and the GCC Standardization Organization both require documented origin for animal-derived additives, and dedicated plant-only production lines command 10–15% price premiums in these channels [15]. Segregated capacity is the constraint, not chemistry, which favours incumbents in the Food Glazing Agents Market with multi-line plants.

Traceability Data as a Commercial Product

Coating suppliers sit on origin data that buyers increasingly need. Batch-level provenance for carnauba — including harvest cooperative, harvest window and labour-audit status — supports customer ESG disclosure under the EU Corporate Sustainability Reporting Directive [19]. Selling verified traceability records as a subscription alongside material is an emerging revenue line, mirroring what specialty chemical firms have already monetised.

Functional and Active Coating Systems

Barrier films are absorbing new payloads. Antimicrobial and antioxidant actives carried within a wax matrix extend produce and cheese life beyond what an inert film achieves, and several 2024–2025 trials reported 20–30% reductions in surface mould incidence [20]. Regulatory classification remains unsettled, which is precisely why early positioning matters.


Food Glazing Agents Market Future Outlook

Substitution Economics Over Volume Growth

Value in the Food Glazing Agents Market will increasingly come from mix rather than tonnage. Plant waxes carry a 20–35% premium over mineral equivalents, so a market growing 5.9% in value may grow only 3.5–4.0% in volume through 2035. Procurement teams should model these separately.

Upstream Integration and Supply Security

Harvest volatility is pushing buyers upstream. Expect more direct cooperative contracts in Piauí and Jharkhand, longer-tenor offtake agreements, and modest strategic inventory builds — a pattern already visible in specialty wax procurement since the 2022 price spike [8][9].

Active and Multifunctional Coatings

Coatings will do more than shine. Antimicrobial-loaded films and moisture-modulating systems are moving from trial to commercial use, and FAO-aligned post-harvest programmes are funding pilot deployments across Asian and African horticulture corridors [10][20].

Traceability and Sustainability Reporting

Disclosure obligations are reshaping supplier selection. The EU Corporate Sustainability Reporting Directive brings roughly 50,000 companies into scope, and food manufacturers are cascading origin-documentation requirements down to additive suppliers [19]. Suppliers without batch-level provenance systems will lose shelf space before they lose on price.


Food Glazing Agents Market Segmentation

By Type

Segment Metric Primary Demand Driver
Stearic Acid 24.2% share Cost-efficient anti-sticking and gloss
Carnauba Wax USD 0.59 Billion Premium confectionery and produce
Beeswax 17.4% share Natural-label bakery and cheese
Shellac 6.4% CAGR Panned confectionery gloss retention
Candelilla Wax USD 0.32 Billion Vegan alternative to beeswax
Other Types 9.7% share Rice bran and blended systems


Stearic acid with 24.2% share, anchors the Food Glazing Agents Market on economics. It performs reliably as a release and finishing aid at a fraction of natural wax cost, which keeps it dominant in high-volume biscuit and cracker production even as premium categories migrate elsewhere. Carnauba occupies the opposite pole — supply-constrained, price-volatile, and increasingly specified by name in premium chocolate and citrus coating programmes. The gap between them defines most formulation decisions in this market. Beeswax is the fastest-growing sub-segment with a 17.4% share.

By Application

Segment Metric Primary Demand Driver
Bakery USD 0.85 Billion Industrial biscuit and cake output
Confectionery 26.8% share Panned and coated formats
Fruits and Vegetables 6.7% CAGR Post-harvest loss reduction
Processed Meat, Poultry and Seafood USD 0.37 Billion Casing and surface protection
Other Applications 8.6% share Dairy, nutraceutical, pet food


The bakery application dominates the market with a valuation of USD 0.85 billion, because coating is embedded in the process line, not added at the margin — every industrial biscuit line applies finishing material continuously. Meanwhile, fruits and vegetables emerge as the fastest-growing application, expanding at a robust 6.7% CAGR fueled by critical post-harvest loss reduction initiatives. Confectionery holds a notable 26.8% share, while processed meat, poultry, and seafood account for USD 0.37 billion.


By Source

Segment Metric Primary Demand Driver
Plant-Derived 58.3% share Clean-label and vegan certification
Animal and Insect-Derived USD 0.76 Billion Established performance in panning
Mineral and Synthetic 13.8% share Cost-sensitive high-volume applications


Based on the provided source table, plant-derived ingredients dominate the market, capturing a major 58.3% share driven by clean-label and vegan certification demands. Meanwhile, animal and insect-derived sources account for a valuation of USD 0.76 billion, supported by established panning performance. In contrast, mineral and synthetic sources hold a 13.8% share tailored for cost-sensitive, high-volume applications.


Regional Market Share Analysis

Region Share of Global Value (2025) Primary Investment Themes
Europe 33.8% Clean-label reformulation, purity compliance
Asia-Pacific 27.5% Bakery capacity build-out, produce coating
North America 24.6% Retail specification, private-label growth
South America 8.4% Carnauba upstream integration
Middle East & Africa 5.7% Export horticulture, halal certification
Total 100.0%

Geography in the Food Glazing Agents Market tracks confectionery manufacturing density more closely than population. Europe's lead reflects concentrated chocolate and biscuit production; Asia-Pacific's momentum reflects capacity being built now rather than installed decades ago.


North America

Country Metric Key Driver
US 68.4% of region Private-label bakery specification clauses
Canada USD 0.11 Billion Frozen bakery export processing
Mexico 5.9% CAGR Candelilla upstream and confectionery growth


US demand is contract-led. Retailer surface-finish clauses have made coating a compliance input rather than a cosmetic choice, and the FDA's affirmation of carnauba and beeswax under 21 CFR 184 gives formulators a stable regulatory floor to build on [21]. Mexico's dual position — candelilla source and growing confectionery producer — makes it structurally more interesting than its share suggests.

Europe

Country Metric Key Driver
Germany 21.0% of region Confectionery manufacturing density
UK USD 0.15 Billion Retail bakery and premium biscuit
France 15.0% of region Rising per-capita cake consumption
Italy 5.2% CAGR Artisan-to-industrial bakery transition
Spain USD 0.09 Billion Citrus and produce coating
Nordic Countries 8.0% of region Clean-label reformulation
Russia 4.6% CAGR Domestic confectionery substitution
Rest of Europe 11.0% of region Contract manufacturing base


Compliance drives European spend in the Food Glazing Agents Market. Regulation (EU) No 231/2012 purity criteria and ongoing EFSA re-evaluations have pushed processors toward documented plant-origin inputs, and Germany alone hosts confectionery output exceeding EUR 13 billion annually [1][16]. Spain's citrus exporters represent a distinct sub-demand centre where coating is applied at packhouse rather than factory.

Asia-Pacific

Country Metric Key Driver
China 31.0% of region Industrial bakery expansion
India 8.1% CAGR Processing incentives and confectionery scale
Japan USD 0.13 Billion Premium confectionery and gifting
South Korea 11.0% of region Convenience bakery formats
ASEAN 14.0% of region Export-oriented snack manufacturing
Rest of Asia-Pacific 6.9% CAGR Fresh produce handling upgrades


Momentum here is capacity-driven. India's processing incentive disbursements and China's continued consolidation of bakery chains create the fastest expansion in the Food Glazing Agents Market, with regional growth running at 7.3% against a global 5.9% [2]. India also supplies the majority of world lac resin, giving it an unusual dual role as both consumer and upstream source [9].

South America

Country Metric Key Driver
Brazil 54.0% of region Carnauba production and domestic confectionery
Argentina USD 0.05 Billion Biscuit and cracker manufacturing
Rest of South America 6.3% CAGR Chilean and Peruvian fruit exports


Brazil's position is unique: it supplies all commercial carnauba effectively while operating one of the largest confectionery sectors in the hemisphere [8]. Cooperative-level labour audits initiated after 2023 supply-chain scrutiny have raised sourcing costs modestly but improved buyer confidence in long-term contracts.

Middle East & Africa

Country Metric Key Driver
Saudi Arabia 27.0% of region Halal-certified confectionery manufacturing
UAE USD 0.03 Billion Re-export and food processing hubs
South Africa 23.0% of region Citrus and table grape export coating
Egypt 7.1% CAGR Horticultural export expansion
Rest of MEA 14.0% of region Emerging processing capacity


Export horticulture defines the region. South African citrus shipments exceeding 2.5 million tonnes annually rely on coating to survive 20–30 day sea transit, and Egypt's expanding grape and citrus programmes follow the same logic [13]. Gulf demand is more manufacturing-led, with halal documentation acting as a gating requirement.


Food Glazing Agents Market By Region, 2025-2035

Competitive Benchmarking

Concentration is low. The estimated HHI for the Food Glazing Agents Market sits in the 620–780 range, with the top five suppliers holding roughly 34–40% of global value. Fragmentation reflects the market's split personality: a commodity wax and stearate trade with thin differentiation, layered over a specialty coatings business where formulation IP and regulatory dossiers create genuine moats. Regional wax refiners retain durable positions because freight and certification costs discourage long-haul supply.

Company Est. Revenue Share Range Key Offerings for Food Glazing Agents Market Strategic Positioning
Capol GmbH (Freudenberg) ~9–12% Confectionery glazes, anti-sticking systems Formulation-led specialist, EU compliance depth
Mantrose-Haeuser (RPM International) ~8–11% Produce and confectionery coatings Broadest produce coating portfolio
Kerry Group plc ~6–9% Integrated coating and finishing systems Bundled with wider ingredient supply
Strahl & Pitsch Inc. ~5–7% Refined beeswax, carnauba, candelilla Upstream wax refining strength
Koster Keunen LLC ~4–6% Natural wax and wax ester systems Natural-source purity positioning
Norevo GmbH ~3–5% Shellac, gum arabic, coating blends Shellac supply chain control
Stearinerie Dubois ~3–5% Esters, stearates, release agents Custom synthesis capability
Poth Hille & Co Ltd ~2–4% Wax blends and food-grade refining UK and European distribution reach
British Wax Refining Company ~2–4% Refined natural and blended waxes Niche technical service model
Masterol Foods Pty Ltd ~2–3% Bakery release and glazing systems Asia-Pacific bakery focus
Carnauba do Brasil ~2–3% Carnauba flake and powder grades Upstream origin integration


Recent News & Developments

  • Freudenberg / Capol (March 2024): Commissioned an expanded water-based coating line in Germany, adding capacity for solvent-free confectionery glazes and reducing ethanol handling across the site [3].
  • RPM International (September 2024): Reported continued growth in its food coatings unit and outlined further investment in produce coating capacity serving North American packhouses [4].
  • EFSA (June 2024): Published re-evaluation outcomes narrowing specification tolerances for selected glazing additives, prompting reformulation across European confectionery portfolios [16].
  • Kerry Group (November 2024): Launched a plant-origin coating system for bakery targeting vegan certification without loss of gloss retention [22].
  • Government of India (February 2025): Confirmed additional Production Linked Incentive disbursements to food processing units, several covering new industrial bakery lines [2].
  • Koster Keunen (April 2025): Announced expanded traceability documentation for carnauba and candelilla supply, including cooperative-level harvest records [23].
  • South African Citrus Growers' Association (August 2024): Reported record export volumes, reinforcing packhouse coating demand across the southern hemisphere season [13].
  • Norevo (January 2025): Introduced a reformulated shellac grade with improved dissolution characteristics for high-speed panning operations [24].


Food Glazing Agents Market Report Scope

Parameter Detail
Market Scope Global Food Glazing Agents Market by type, application, source and geography
Study Period 2021–2035 (Historical 2021–2024; Base Year 2025; Forecast 2026–2035)
CAGR 5.9% (2026–2035)
Market Size Checkpoints USD 2.71 Billion (2025); USD 2.87 Billion (2026); USD 4.81 Billion (2035)
Fastest Growing Segments Fruits and Vegetables (application); Shellac (type); Asia-Pacific (region)
Companies Profiled 11 leading suppliers including Capol, Mantrose-Haeuser, Kerry, Strahl & Pitsch, Koster Keunen
Valuation Currency USD Billion, constant 2025 prices

FAQs

What procurement terms should buyers negotiate when entering the Food Glazing Agents Market?
Push for index-linked pricing tied to published carnauba and lac resin benchmarks, plus dual-source clauses. Fixed annual pricing has repeatedly failed during harvest shocks [8][9].
How should a formulator evaluate switching from shellac to a plant wax?
Run panning trials on gloss retention and tack under production humidity, not lab conditions. Most conversion failures trace to line speed, not material chemistry [20].
Are contract manufacturers or brand owners the primary buyers in the Food Glazing Agents Market?
Contract manufacturers purchase most volume, but brand owners increasingly write the specification. Selling effort should target both, with technical support directed at the co-packer [12].
What certification documentation do Gulf and Southeast Asian buyers typically require?
Origin declarations for any animal- or insect-derived component, plus recognised halal certification from JAKIM or a GCC-accredited body. Missing documentation blocks shipment more often than specification failures [15].
Does the Food Glazing Agents Market face meaningful substitution risk from packaging technology?
Modified-atmosphere packaging competes for the same shelf-life budget in some categories. Coatings retain the advantage where surface appearance matters or packaging is impractical [20].
Which regulatory change should suppliers monitor most closely through 2027?
Ongoing EFSA specification revisions, which can invalidate existing grades without a transition period. Maintaining an approved alternate grade per product is prudent insurance [16].
How material is traceability to winning large accounts?
Increasingly decisive. Manufacturers in scope of EU sustainability reporting now request batch-level origin data during qualification, and suppliers without it are screened out early [19].    
Author
Author
Author Profile
Varsha More LinkedIn
Senior Research Analyst
Experienced business professional with a demonstrated history of working in the CFnB industry. Skilled in market research, and market estimation. Strong professional with a Masters focused in marketing management.
Share::
Request Free Sample

Research Approach


Secondary Research

The secondary research process involved comprehensive analysis of food regulatory databases, peer-reviewed food science journals, food technology publications, and authoritative food safety organizations. Key sources included the US Food & Drug Administration (FDA) Food Additive Status Database, European Food Safety Authority (EFSA) Food Additives and Flavourings Database, Joint FAO/WHO Expert Committee on Food Additives (JECFA) Evaluations, Codex Alimentarius Commission (CAC) Food Additive Provisions, Food Chemicals Codex (FCC) by US Pharmacopeia, European Commission Directorate-General for Health and Food Safety (DG SANTE), Food Standards Australia New Zealand (FSANZ), Health Canada Food Additive Database, Japan Ministry of Health, Labour and Welfare Food Additive Lists, International Organization of the Flavor Industry (IOFI), International Food Additives Council (IFAC), Food Ingredients Europe (FIE) Association, Institute of Food Technologists (IFT), FoodandFeedInformation.eu, FAOSTAT Trade Database, UN Comtrade Database for food ingredient trade flows, PubMed/FSTA (Food Science and Technology Abstracts) for clinical safety studies, and national food safety authority reports from China (NHC), India (FSSAI), and Brazil (ANVISA).

These sources were employed to gather approval status data for glazing agents (E-numbers 570, 901-904, 905, etc.), production statistics, import/export trade flows, application-specific usage rates, and competitive landscape analysis across natural waxes, synthetic fatty acids, and plant-based glazing alternatives.


Primary Research

Qualitative and quantitative insights were obtained by interviewing supply-side and demand-side stakeholders during the primary research process. The supply-side sources consisted of CEOs, VPs of R&D, global regulatory affairs directors, regional commercial leaders, and innovation leads from food ingredient manufacturers, specialty wax producers, and oleochemical companies. The demand-side sources consisted of global procurement directors and category managers from multinational confectionery manufacturers, bakery product formulators, processed meat and poultry producers, nutraceutical encapsulation specialists, and private label food manufacturers. The primary research validated market segmentation for stearic acid, carnauba wax, beeswax, and shellac grades, confirmed clean-label transition timelines and natural ingredient pipeline developments, and gathered insights on formulation costs, supply chain dynamics for the Brazilian carnauba wax and Chinese shellac markets, as well as pricing volatility for plant-based versus petroleum-derived glazing agents.

Primary Respondent Breakdown:

• By Designation: C-level Executives (28%), VP/Director Level (34%), Manager Level (22%), Technical Specialists/SMEs (16%)

• By Region: North America (32%), Europe (25%), Asia-Pacific (35%), Latin America (5%), Middle East & Africa (3%)

• By Stakeholder Type: Ingredient Manufacturers (45%), Food/Beverage Manufacturers (40%), Regulatory/Technical Consultants (15%)


Market Size Estimation

Revenue mapping and consumption volume analysis were employed to determine the global market valuation for various ingredient categories and application sectors. The methodology comprised the following:

• Identification of over 60 key manufacturers and specialty suppliers in North America, Europe, Asia-Pacific, Latin America, and the Middle East and Africa, including integrated oleochemical producers (stearic acid/fatty acids), natural wax harvesters (carnauba, candelilla, beeswax), and shellac processors.

• Product mapping for the following categories: stearic acid, carnauba wax, beeswax, candelilla wax, shellac, paraffin wax, and microcrystalline wax, categorized by grade (food, pharmaceutical, cosmetic).

• Examination of the annual revenues that have been reported and modeled for food-grade glazing agent portfolios, which includes direct sales and distribution channel contributions

• A comprehensive list of manufacturers that account for 75-80% of the global market share in 2024, including key players in Brazil (carnauba wax), India/Thailand (shellac), and Southeast Asia (stearic acid production).

• Segment-specific valuations for natural versus synthetic glazing agents are derived through extrapolation using bottom-up (application volume × pricing by region: confectionery coatings, bakery glazes, meat casings, fruit coatings, supplement excipients) and top-down (manufacturer revenue validation and trade data triangulation) approaches.

Share::
Request Free Sample
Download Free Sample

Kindly complete the form below to receive a free sample of this Report

* Please use a valid business email

Share::
Request Free Sample
Download PDF ×

We do not share your information with anyone. However, we may send you emails based on your report interest from time to time. You may contact us at any time to opt-out.
















