Footwear Market (2026 - 2035)

Footwear Market Size, Share, Industry Trend & Analysis Research Report By Product Type (Athletic Footwear, Non-Athletic Footwear), By End User (Men, Women, Kids), By Category (Mass, Premium), By Distribution Channel (Supermarkets/Hypermarkets, Specialty Stores, Online Retail Stores, Other Distribution Channels) - Forecast to 2035
ID: MRFR/CG/6565-HCR
128 Pages
Pradeep Nandi
Last Updated: July 12, 2026
Footwear Market
Market Size
Forecast Period2026-2035
CAGR (2026-2035)3.56%
2025 Market SizeUSD 415.50 Billion
2035 Market SizeUSD 589.50 Billion
Key Players
Nike Inc.
Adidas AG
Skechers USA Inc.
Puma SE
New Balance Athletics
VF Corporation (Vans
Opportunities
  • Circular Economy and Resale Platforms
  • Smart and Connected Footwear
  • Emerging-Market Penetration in Africa

Footwear Market Summary

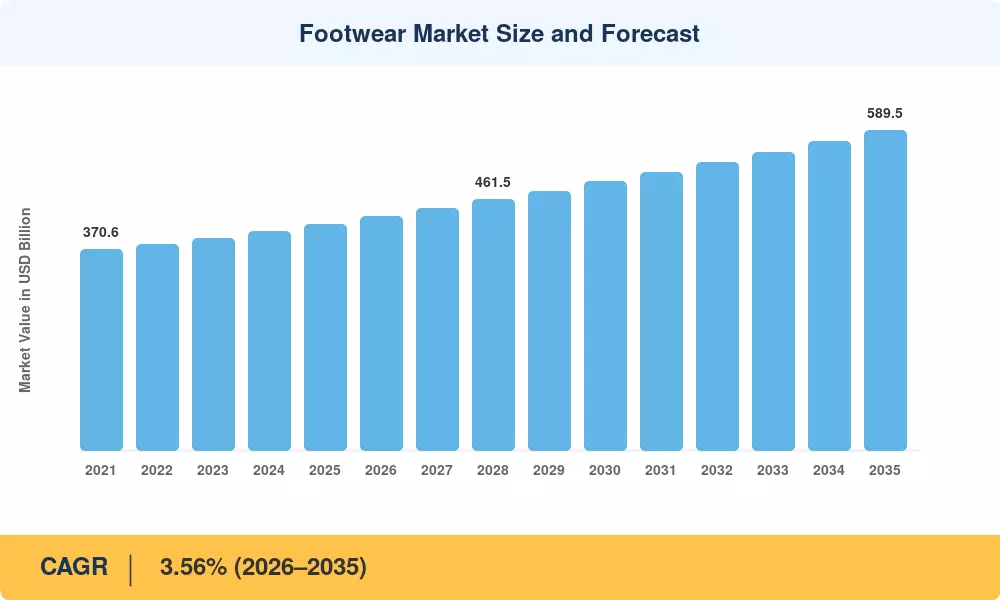
The global Footwear Market was valued at USD 415.50 Billion in 2025 and is projected to grow from USD 430.30 Billion in 2026 to USD 589.50 Billion by 2035, registering a CAGR of 3.56% during the forecast period (2026โ€“2035). Two catalysts stand behind this trajectory: the EU's Ecodesign for Sustainable Products Regulation (ESPR), which is forcing manufacturers to rethink material sourcing and lifecycle transparency [1], and the continued penetration of direct-to-consumer (D2C) digital channels that reached an estimated USD 21 Billion in global footwear e-commerce revenue by 2024 [2]. These forces are reshaping how brands compete and how consumers buy.

A transformation is underway in production technology. Traditional petroleum-based synthetics and manual cutting processes are giving way to 3D-printed midsoles, bio-based polymers, and AI-driven demand forecasting. Nike's USD 1 Billion investment in automated manufacturing hubs and Adidas's partnership with Carbon on lattice-sole printing illustrate the capital flowing into next-generation production [3]. Brands that fail to digitize their supply chains risk losing share as lead times and waste reduction become competitive differentiators.

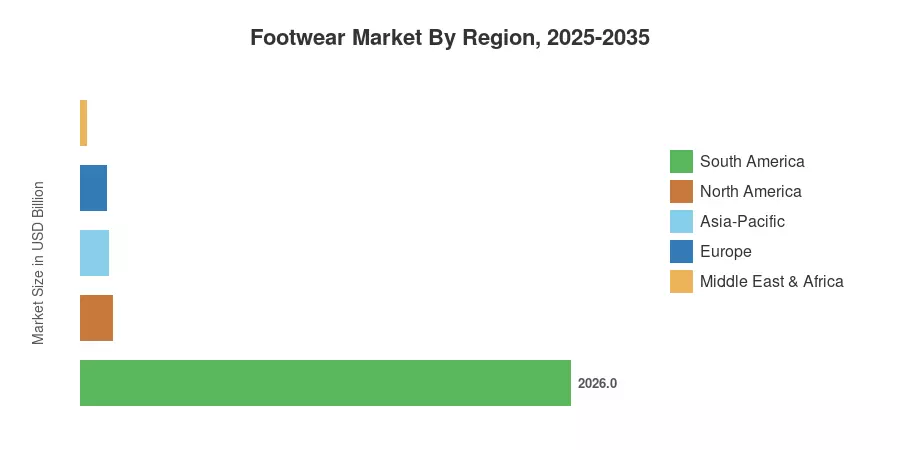
North America leads the Footwear Market with approximately 32% of global revenue, driven by high per-capita spending and a mature athletic-wear culture. South America is the fastest-growing region, propelled by urbanization in Brazil and expanding middle-class purchasing power. Europe holds roughly a 26% share, anchored by Italy's luxury manufacturing base and Germany's performance-wear demand. The decade ahead will test whether sustainability mandates accelerate or constrain growth across each of these corridors.

ย 

Key Report Takeaways

โ€ข By Product Type

  • Non-athletic footwear commanded approximately 61% of the Footwear Market in 2025, supported by formal and casual lifestyle demand across mature economies.
  • Athletic footwear is forecast to register the fastest CAGR of 5.02% through 2035 as fitness culture and athleisure trends intensify.

โ€ข By End User

  • Women accounted for roughly 52% of Footwear Market sales in 2025, reflecting higher purchase frequency and broader style segmentation.
  • The kids segment is projected to expand at a 4.89% CAGR through 2035, fueled by rising parental spending on branded children's shoes.

โ€ข By Region

  • North America remains the dominant region, contributing USD 133.00 Billion in 2025 revenue.
  • South America's Footwear Market is on track to post the highest regional CAGR during 2026โ€“2035.

ย 

Market Size and Forecast (2021โ€“2035)

Market Research Future's estimates blend proprietary primary research with validated secondary data from trade associations, customs databases, and company filings. Historical figures (2021โ€“2024) are reconciled against World Footwear Yearbook data, while forecast values (2026โ€“2035) reflect a constant-CAGR projection anchored to the 2025 base year.
Footwear Market Size and Forecast
Our Impact
Enabled $4.3B Revenue Impact for Fortune 500 and Leading Multinationals
Partnering with 2000+ Global Organizations Each Year
30K+ Citations by Top-Tier Firms in the Industry

Driver Impact Analysis

Driver ~% Impact on CAGR Geographic Relevance Impact Timeline
Athleisure lifestyle adoption +0.65% Global Medium-term (2โ€“4 yr)
D2C and e-commerce expansion +0.55% North America, Europe Short-term (โ‰ค2 yr)
Urbanization in emerging economies +0.50% Asia-Pacific, South America Long-term (โ‰ฅ4 yr)
Sustainability regulation (ESPR) +0.40% Europe Medium-term (2โ€“4 yr)
Rising disposable income in Asia +0.35% Asia-Pacific Long-term (โ‰ฅ4 yr)
Celebrity and influencer collaborations +0.30% Global Short-term (โ‰ค2 yr)
Advanced manufacturing (3D printing, automation) +0.25% North America, Europe Long-term (โ‰ฅ4 yr)

ย 

Athleisure Lifestyle Adoption

The blurred line between sporting and casual wear has resulted in a fundamental demand shift in the footwear market. According to the data, athletic-inspired casual styles increased 17% year on year in the United States alone in 2023 [6]. Consumers now expect a single shoe to perform both at the gym and in a cafรฉ, prompting brands to invest in crossover designs that combine cushioning technology with street-ready aesthetics.

ย 

D2C and E-Commerce Expansion

Brands like Allbirds, On Running, and Nike Direct have shown that circumventing wholesale intermediaries may increase gross margins by 15-20 percentage points [2]. Shopify-powered storefronts and Instagram checkout have made it easier for rising labels to reach consumers throughout the world, increasing competitiveness and growing the addressable footwear market.

ย 

Urbanization in Emerging Economies

The World Bank projects that 68% of the global population will reside in cities by 2050, with the sharpest growth in Sub-Saharan Africa and South Asia [7]. Urban lifestyles correlate directly with higher footwear consumption per capita โ€” city dwellers own an average of 6.2 pairs versus 3.1 pairs in rural households, according to estimates.

Sustainability Regulation

The EU's ESPR, effective from 2024, mandates Digital Product Passports for footwear sold within the bloc by 2027, requiring full supply-chain traceability [1]. Compliance costs are estimated at EUR 0.80โ€“1.50 per pair, but early adopters see a marketing advantage as eco-conscious consumers are willing to pay a 12โ€“15% premium for verified sustainable products [11].

ย 

Restraints Impact Analysis

The restraint impacts below are directional estimates of headwinds that could slow the Footwear Market's expansion. They do not subtract linearly from the CAGR.

Restraint ~% Impact on CAGR Geographic Relevance Impact Timeline
Raw-material price volatility โˆ’0.35% Global Short-term (โ‰ค2 yr)
Counterfeit product proliferation โˆ’0.30% Asia-Pacific, MEA Medium-term (2โ€“4 yr)
Trade tariffs and geopolitical disruptions โˆ’0.25% North America, Asia-Pacific Medium-term (2โ€“4 yr)
Consumer spending compression (inflation) โˆ’0.20% Europe, South America Short-term (โ‰ค2 yr)
Seasonal demand concentration โˆ’0.15% Global Long-term (โ‰ฅ4 yr)

ย 

Raw-Material Price Volatility

Natural rubber prices surged 28% between January and September 2024 due to weather disruptions in Thailand and Indonesia, which together supply over 60% of global rubber [12]. Leather hides have experienced similar pressure from tightening cattle supply in South America. These cost spikes compress manufacturer margins and force difficult pricing decisions that can dampen unit volumes across the Footwear Market.

Counterfeit Product Proliferation

The OECD anticipated that counterfeit footwear accounted for USD 12.4 billion in worldwide trade in 2023, undermining brand equity and lowering real sales [13]. Cross-border e-commerce platforms remain a significant distribution avenue for counterfeit goods, and regulation remains varied between states.

ย 

Trade Tariffs and Geopolitical Disruptions

The United States slapped tariffs of up to 67.5% on certain Chinese-made footwear categories, spurring supply-chain relocation to Vietnam and Indonesia [14]. While diversity minimizes single-country risk, the change raises short-term logistics costs and production ramp-up times, slowing the Footwear Market's near-term development.

ย 

ย 

Footwear Market Opportunities

Circular Economy and Resale Platforms

Recommerce platforms such as Trove and ThredUp have created a USD 2.5 Billion secondhand footwear segment, growing at roughly 15% annually [17]. Brands that launch certified pre-owned programs can capture margin on products they have already sold once, extending customer lifetime value and reducing landfill waste.

Smart and Connected Footwear

Sensor-embedded insoles and Bluetooth-enabled running shoes represent a nascent but rapidly growing niche. Under Armour's HOVR line and Nurvv's biomechanics tracker illustrate how data monetization can layer recurring subscription revenue on top of hardware sales in the Footwear Market.

Emerging-Market Penetration in Africa

Sub-Saharan Africa's footwear consumption per capita is roughly one-fifth of the global average, leaving substantial headroom [7]. Local manufacturing hubs โ€” such as Ethiopia's Huajian factory complex exporting to the US โ€” combine low labor costs with preferential trade access under AGOA, positioning the region as both a production base and consumption frontier [18].

Customization and On-Demand Manufacturing

Nike By You and New Balance's NB1 program demonstrate consumer appetite for personalized footwear. 3D-scanning kiosks that map foot geometry can reduce return rates by up to 40%, improving unit economics for e-commerce players and expanding the addressable Footwear Market [3].

Adaptive and Inclusive Footwear

Nike's FlyEase and Billy Footwear's zip-around design target the estimated 1.3 Billion people globally living with disabilities [19]. This underserved segment offers both social impact and commercial opportunity as regulatory attention around accessibility standards grows.

ย 

Footwear Market Future Outlook

AI-Driven Supply Chain and Demand Sensing

Machine-learning models that ingest point-of-sale, social media, and weather data are poised to cut inventory obsolescence by 20โ€“30% across the Footwear Market over the next decade [21]. Brands investing in predictive analytics platforms โ€” such as Celect (acquired by Nike) and Blue Yonder โ€” will gain a structural cost advantage as they reduce markdowns and overproduction.

Bio-Materials and the Post-Petroleum Shoe

Startups like Bolt Threads (Mylo mycelium leather) and Natural Fiber Welding (Mirum plant-based leather) are scaling alternatives to petroleum-derived synthetics. The IEA projects that petrochemical feedstock prices will rise 12โ€“18% by 2030 under carbon-pricing scenarios, making bio-materials cost-competitive and accelerating adoption in the Footwear Market [22].

Platform Economics and Marketplace Consolidation

Farfetch's acquisition by Coupang and the growth of StockX and GOAT signal that platform economics are reshaping footwear distribution. By 2030, an estimated 45% of global shoe transactions will pass through a digital marketplace or social-commerce channel, compressing traditional wholesale margins [23].

Wellness Integration and Health-Focused Design

The convergence of health monitoring and footwear presents a decade-long tailwind. Smart insoles capable of gait analysis, pressure mapping, and fall detection are being piloted in eldercare applications across Japan and Scandinavia. The global wearable health technology sector โ€” projected to reach USD 190 Billion by 2032 โ€” will increasingly intersect with the Footwear Market as sensor miniaturization and battery life improve.

ย 

Footwear Market Segmentation

By Product Type

Segment Key Metric Primary Demand Driver
Non-Athletic Footwear 61% share (2025) Formal and lifestyle occasions
Athletic Footwear CAGR 5.02% (2026โ€“2035) Fitness culture and athleisure crossover

ย 

Non-athletic footwear remains the larger segment of the Footwear Market, encompassing formal, casual, and specialty categories. Demand is steady in mature markets where workplace dress codes, though loosening, still require non-athletic options. Athletic footwear, meanwhile, is the clear growth leader. Running, training, and basketball shoe categories benefit from cultural momentum โ€” sneaker drops generate social-media engagement comparable to entertainment product launches, and the secondary resale market reinforces brand desirability.

By End User

Segment Key Metric Primary Demand Driver
Women 52% share (2025) Higher purchase frequency, fashion diversity
Men USD 164.10 Billion (2025) Performance and workwear requirements
Kids CAGR 4.89% (2026โ€“2035) Parental brand consciousness, fast growth cycles

ย 

Women drive the largest share of the Footwear Market due to a wider style repertoire and higher seasonal turnover. The kids segment is expanding fastest as parents trade up from unbranded options to performance and fashion-forward brands, particularly in Asia-Pacific and South America.

By Category

Segment Key Metric Primary Demand Driver
Mass 81% share (2025) Price sensitivity, volume-driven distribution
Premium CAGR 4.83% (2026โ€“2035) Brand aspiration, quality and durability focus

ย 

The mass category dominates the Footwear Market on volume, serving price-conscious consumers through hypermarkets, discount chains, and value e-commerce platforms. Premium footwear, though smaller, is growing faster as consumers in emerging markets trade up and luxury houses expand their sneaker and casual lines.

By Distribution Channel

Segment Key Metric Primary Demand Driver
Supermarkets / Hypermarkets 30% share (2025) Convenience, mass-market access
Specialty Stores USD 103.90 Billion (2025) Expert curation, brand experience
Online Retail Stores CAGR 5.45% (2026โ€“2035) Mobile commerce, D2C brand growth
Other Distribution Channels 12% share (2025) Department stores, pop-up retail

ย 

Online retail is the fastest-growing distribution channel in the Footwear Market, supported by improvements in virtual try-on technology, hassle-free return policies, and social-commerce integrations. Specialty stores maintain relevance through experiential retail and expert fitting services.

ย 

Regional Market Share Analysis

Region Key Metric Primary Investment Themes
North America 32% share (2025) D2C channels, premium athletic brands
Europe USD 108.00 Billion (2025) Sustainability compliance, luxury heritage
Asia-Pacific 28% share (2025) Manufacturing expansion, middle-class growth
South America Fastest CAGR (2026โ€“2035) Urbanization, local brand emergence
Middle East & Africa USD 25.00 Billion (2025) Youth demographics, retail modernization
Total USD 415.50 Billion (2025) โ€”

The Footwear Market spans diverse economic conditions and consumer profiles. Regional dynamics reflect local purchasing power, cultural preferences, climate considerations, and regulatory environments.

ย 

North America

Country Key Metric Key Driver
US 78% of regional revenue Athletic culture, sneaker resale ecosystem
Canada CAGR 3.40% Outdoor recreation, cold-weather boot demand
Mexico USD 8.70 Billion (2025) Domestic manufacturing, nearshoring trend

ย 

The US alone accounts for over three-quarters of North America's Footwear Market, supported by the world's most developed sneaker culture and a robust resale ecosystem valued at USD 6 Billion in 2024 [9]. Canada's cold-climate demand sustains premium winter and outdoor categories, while Mexico benefits from nearshoring as brands relocate production closer to the US consumer base.

Europe

Country Key Metric Key Driver
Germany 18% of regional share Performance sportswear, Adidas and Puma headquarters
UK CAGR 3.25% Fast-fashion footwear cycles, online retail penetration
France USD 12.80 Billion (2025) Luxury houses (LVMH, Kering footwear lines)
Italy 14% of regional share Artisan manufacturing, leather export hub
Spain CAGR 3.10% Tourism-driven retail, espadrille heritage
Nordic Countries USD 7.20 Billion (2025) Sustainability-first consumer base
Russia 8% of regional share Import substitution policies
Rest of Europe CAGR 2.95% Emerging Eastern European retail

ย 

Europe's Footwear Market is shaped by a dual identity: Western luxury and performance brands drive high-value exports, while Eastern European consumers increasingly adopt branded footwear over unbranded alternatives. The ESPR regulation will be a defining force across the region through 2027 [1].

Asia-Pacific

Country Key Metric Key Driver
China 42% of regional share World's largest producer and second-largest consumer
India CAGR 5.10% Youth demographics, Reliance/Tata retail expansion
Japan USD 14.50 Billion (2025) Functional and comfort-driven demand
South Korea 9% of regional share K-fashion influence, streetwear culture
ASEAN CAGR 4.75% Manufacturing relocation from China, rising wages
Rest of Asia-Pacific USD 6.30 Billion (2025) Urbanization in Central Asia

ย 

Asia-Pacific functions as the Footwear Market's production engine and a fast-expanding consumption zone. China produces roughly 60% of the world's shoes, yet domestic brands such as Anta and Li-Ning are gaining ground against Western incumbents with nationalistic "guochao" marketing [8].

South America

Country Key Metric Key Driver
Brazil 65% of regional revenue Havaianas-led casual culture, domestic leather supply
Argentina CAGR 4.20% Inflation-resistant spending on branded goods
Rest of South America USD 4.10 Billion (2025) Colombia and Chile urbanization

ย 

Brazil dominates South America's Footwear Market through a vertically integrated leather-and-rubber supply chain concentrated in Rio Grande do Sul. The Grendene and Alpargatas groups export to over 100 countries, giving the region outsized global influence relative to its GDP [20].

Middle East & Africa

Country Key Metric Key Driver
Saudi Arabia 28% of regional share Vision 2030 retail expansion
UAE CAGR 4.50% Tourism, luxury mall-driven sales
South Africa USD 3.80 Billion (2025) Largest formal retail sector in Sub-Saharan Africa
Egypt 15% of regional share Population size, local manufacturing
Rest of MEA CAGR 3.80% Youth bulge, informal-to-formal retail transition

ย 

The Middle East & Africa Footwear Market is characterized by a youthful demographic profile โ€” over 60% of the population is under 30 in many countries. Saudi Arabia's Vision 2030 is catalyzing mall and mixed-use retail development, while African markets are transitioning from open-air bazaars to modern retail formats [18].

ย 

Footwear Market By Region, 2025-2035

Competitive Benchmarking

The Footwear Market exhibits medium concentration, with the top five players holding an estimated 38โ€“44% combined revenue share. The Herfindahl-Hirschman Index (HHI) sits in the 600โ€“900 range, indicating a moderately competitive structure where scale advantages in marketing and supply-chain management coexist with a long tail of regional and niche brands.

Company Est. Revenue Share Range Key Offerings Strategic Positioning
Nike Inc. ~12โ€“15% Performance running, basketball, lifestyle sneakers Global brand leadership, D2C digital pivot
Adidas AG ~8โ€“11% Sport performance, Originals lifestyle, Yeezy successor lines European heritage, sustainability commitment
Skechers USA Inc. ~4โ€“6% Comfort-technology walking and casual shoes Value-performance positioning, global retail expansion
Puma SE ~3โ€“5% Motorsport, training, lifestyle categories Luxury-sport crossover (Kering heritage)
New Balance Athletics ~3โ€“5% Running, lifestyle, Made-in-USA premium line Heritage craftsmanship, limited-edition strategy
VF Corporation (Vans, Timberland) ~3โ€“4% Skateboarding, outdoor boots, casual lifestyle Multi-brand portfolio diversification
ASICS Corporation ~2โ€“4% Performance running, court sports Technology-driven biomechanics R&D
Deckers Brands (UGG, HOKA) ~2โ€“3% Comfort lifestyle (UGG), maximalist running (HOKA) Dual-brand growth engine, DTC focus
Crocs Inc. ~2โ€“3% Foam clogs, sandals, personalization platform Viral marketing, customization via Jibbitz
Under Armour Inc. ~1โ€“3% Training, running, team sports Performance innovation, North American recovery

ย 

ย 

Recent News & Developments

  • June 2025: Reebok introduces the Reebok FloatZig 2 running shoe. This new model has SuperFloat+ nitrogen-injected foam and a redesigned Zig Tech midsole, ensuring a springier and more stable ride. The company claims that these additions improve energy return and stability, making it excellent for daily workouts.
  • June 2025: Pair-ie-tales launches its women's footwear brand in India. The shoes are designed for comfort with the Cloud Comfortโ„ข sole technology, a triple-layered innovation for everyday wear. This solution is intended to provide improved cushioning, support, and durability, delivering a comfortable experience for users throughout the day.
  • June 2025: Nike and NorBlack NorWhite collaborated to launch a new women's footwear line in June 2025. The new collection includes four distinct footwear silhouettes: the Nike Air Max Craze, Motiva, Pegasus 41, and Calm slide. This collaboration exemplifies Nike's commitment to fusing innovative design with cultural inspirations, resulting in a distinct and elegant women's line.

ย 

ย 

ย 

ย 

ย 

ย 

ย 

ย 

ย 

Footwear Market Report Scope

Parameter Detail
Market Scope Global Footwear Market covering athletic and non-athletic segments across all distribution channels
Study Period 2021โ€“2035
CAGR (Forecast) 3.56% (2026โ€“2035)
Market Size โ€” 2025 USD 415.50 Billion
Market Size โ€” 2035 USD 589.50 Billion
Fastest Growing Segment Athletic Footwear (by product type); Kids (by end user); Online Retail (by channel)
Companies Profiled 10 (Nike, Adidas, Skechers, Puma, New Balance, VF Corp, ASICS, Deckers, Crocs, Under Armour)
Valuation Currency USD Billion

ย 

ย 

FAQs

How do tariff structures affect sourcing decisions for footwear importers?
US tariffs on Chinese footwear range from 8.5% to 67.5% depending on construction and material, pushing importers toward Vietnam and Indonesia. Sourcing diversification adds logistical complexity but reduces single-country exposure [14].
What role does 3D printing play in reducing footwear production costs?
Additive manufacturing cuts midsole tooling costs by up to 75% and eliminates weeks of mold development time. Adoption remains concentrated among premium brands but is expected to expand as printer throughput improves [3].
How are resale platforms influencing brand pricing strategies?
Secondary-market prices signal real-time demand, enabling brands to calibrate production runs and limit-edition drops. Certified resale programs also let brands capture margin on pre-owned inventory [17].
What compliance steps are required under the EU's Digital Product Passport mandate for footwear?
Brands must embed QR-linked lifecycle data โ€” covering materials, factory origin, carbon footprint, and recyclability โ€” into each pair sold in the EU by 2027. Early investment in traceability systems eases the compliance burden [1].
How does the kids segment differ in purchase-cycle dynamics from adult footwear?
Children outgrow shoes every 3โ€“4 months on average, creating replacement cycles 3โ€“4 times faster than adult categories. This frequency drives volume but compresses price tolerance among parents [10].
What competitive advantage does vertical integration offer in the Footwear Market?
Companies controlling raw-material sourcing through retail (like Brazil's Grendene) achieve 8โ€“12 percentage points higher gross margins than wholesale-dependent peers. Vertical integration also reduces lead times from months to weeks [20].
How is augmented reality changing the online shoe-buying experience?
AR-powered virtual try-on tools have reduced e-commerce return rates by 25โ€“35% for early adopters like Gucci and Nike. Lower returns directly improve unit economics for online-first brands [5]. ย  ย 
Author
Author
Author Profile
Pradeep Nandi LinkedIn
Senior Research Analyst
I have a bachelor's degree in mechanical engineering and an MBA. I have more than two years of expertise in the retail, food, and beverage, chemical, and material industries, and hence have developed a sound cross-domain expertise. A firm believer in lifelong learning and sharing of knowledge. Having a proclivity for hatching ideas and trying to absorb as much information as possible in a short amount of time. Introducing corporates to the data and insight, which enables them to move from probability to possibility, has been my key areas of interest.ย 
Download Free Sample

Kindly complete the form below to receive a free sample of this Report

Download PDF ×

We do not share your information with anyone. However, we may send you emails based on your report interest from time to time. You may contact us at any time to opt-out.