Licensed Sports Merchandise Market (2026 - 2035)

Licensed Sports Merchandise Market Size, Share, Industry Trend & Analysis Research Report: By Product Category (Apparel, Footwear, Headwear, Toys & Games, Equipment & More), By Sports Type (Football (Soccer), Basketball, Baseball, Other Sports), By Distribution Channel (Offline Retail, Online Retail), By End User (Adults, Kids / Children), By Geography (North America, Europe, Asia-Pacific, South America, Middle East & Africa) - Forecast to 2035

Forecast Period
2026-2035
CAGR
6.15%
2025 Market Size
USD 45.30 Billion (2025)
2035 Market Size
USD 82.30 Billion (2035)
Consumer and Retail ● Updated July 28, 2026 Report ID: MRFR/CG/5603-HCR | Pages: 128 | Author: Snehal Singh

Licensed Sports Merchandise Market Summary

The Licensed Sports Merchandise Market reached a valuation of USD 45.30 Billion in 2025 and is projected to climb from USD 48.09 Billion in 2026 to USD 82.30 Billion by 2035, reflecting a compound annual growth rate of 6.15% over the forecast window. Two catalysts stand behind this trajectory: the proliferation of multi-year broadcasting agreements — the NFL's media deals alone are worth an estimated USD 113 Billion through 2033 [1] — and the rapid digitization of fan engagement platforms that turn passive viewers into active merchandise buyers.

A fundamental shift is reshaping how licensed goods reach consumers. Legacy wholesale distribution, once dominated by department-store concessions and stadium kiosks, is giving way to direct-to-consumer (DTC) digital storefronts operated by rights holders themselves. Fanatics' vertically integrated on-demand manufacturing model — which secured a reported USD 1.5 Billion investment round in 2023 [2] — exemplifies the transition. Blockchain-based product authentication and AI-driven demand forecasting now allow licensees to launch limited-edition drops within hours of a championship game, reducing overstock risk by an estimated 20–30% [3].

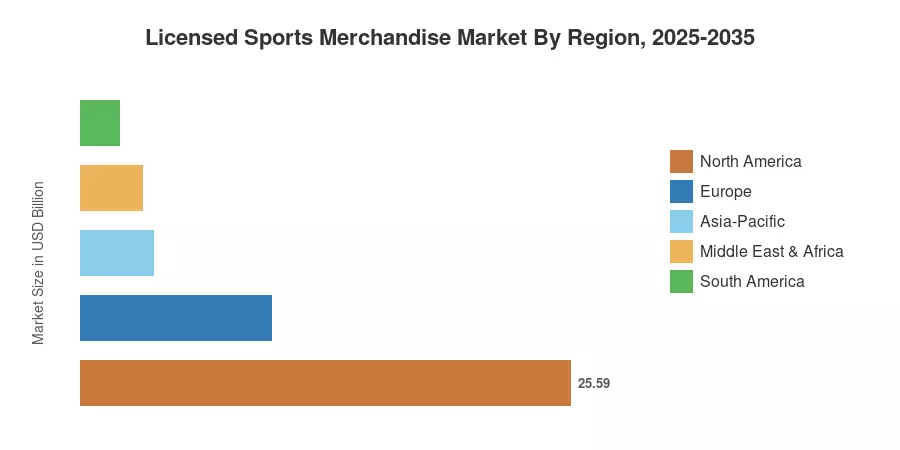
North America commands roughly 56.5% of the Licensed Sports Merchandise Market, powered by the commercial scale of the NFL, NBA, MLB, and NHL. Asia-Pacific is the fastest-growing region at an estimated 8.40% CAGR, propelled by rising sports-league investments in India, China, and Southeast Asia. Europe holds the second-largest share at approximately 22.0%, anchored by football (soccer) club licensing across the English Premier League, La Liga, and Bundesliga. As esports viewership and women's sports coverage continue their ascent, additional licensing revenue pools are set to open between 2028 and 2035.


Key Report Takeaways

• By Product Category

  • Apparel dominated the Licensed Sports Merchandise Market, capturing approximately 47.5% of revenue in 2025, driven by official team jersey sales across major leagues.
  • Toys and games represent the fastest-expanding product category, projected to grow at a 7.30% CAGR from 2026 to 2035, fueled by collectible figurines and trading cards.

• By Sports Type

  • Football (soccer) accounted for roughly 35.2% of the Licensed Sports Merchandise Market in 2025, led by European club and FIFA World Cup licensing.
  • Basketball is forecast to post the highest CAGR of 7.45% through 2035, reflecting global NBA fan-base expansion and grassroots programs in Africa and Asia.

• By Distribution Channel

  • Offline retail captured an estimated 55.0% market share in 2025, though its dominance is narrowing as stadium-adjacent pop-up stores merge physical and digital experiences.
  • Online retail is set to advance at 7.40% CAGR through 2035, with mobile commerce accounting for over half of digital merchandise orders.

• By End User

  • Adults contributed approximately 77.0% of Licensed Sports Merchandise Market spending in 2025.
  • The kids segment is projected to climb at a 7.45% CAGR from 2026 to 2035, supported by youth sports participation programs and character-driven licensing partnerships.

• By Region

  • North America generated about 56.5% of global Licensed Sports Merchandise Market revenue in 2025.
  • Asia-Pacific is expected to expand at an 8.40% CAGR through 2035, the highest among all regions.


Market Size and Forecast (2021–2035)

Market Research Future's estimates combine primary interviews with league licensing executives, retail sell-through data from point-of-sale aggregators, and secondary filings from publicly traded licensees. Historical figures (2021–2024) are reconciled against reported royalty revenues disclosed in league annual reports, while forecast projections apply a scenario-weighted CAGR anchored to media-rights growth, per-capita disposable income trajectories, and digital channel penetration rates.
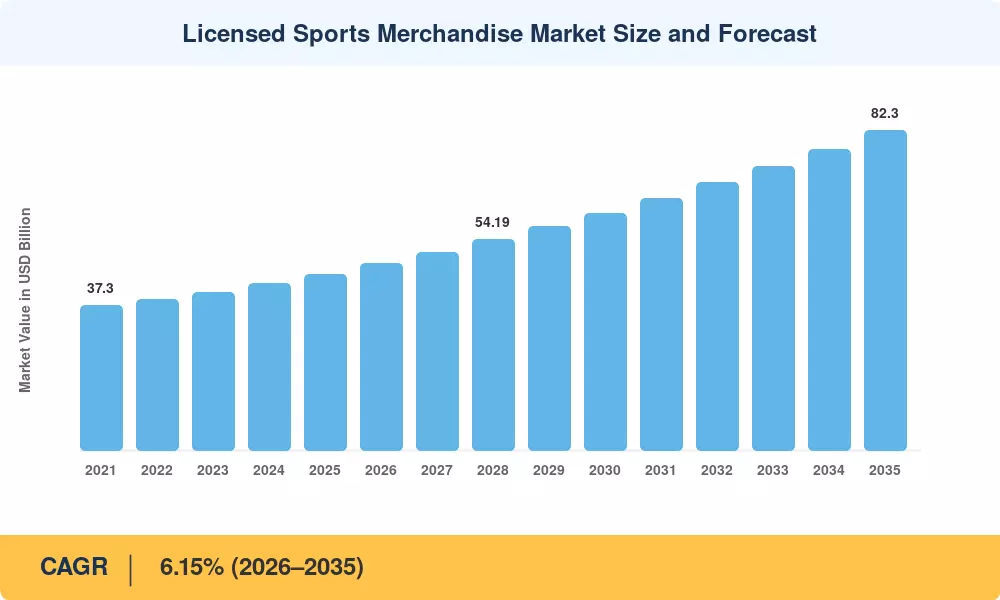
Licensed Sports Merchandise Market Size and Forecast
Our Impact
Enabled $4.3B Revenue Impact for Fortune 500 and Leading Multinationals
Partnering with 2000+ Global Organizations Each Year
30K+ Citations by Top-Tier Firms in the Industry

Driver Impact Analysis

Driver ~% Impact on CAGR Geographic Relevance Impact Timeline
Multi-billion-dollar media-rights deals +1.4% North America, Europe Short-term (≤2 yr)
Direct-to-consumer digital platforms +1.1% Global Medium-term (2–4 yr)
Mega-event hosting cycles (Olympics, FIFA) +0.9% Host nations, global viewership Short-term (≤2 yr)
Luxury-fashion × sports collaboration trend +0.6% Europe, North America Medium-term (2–4 yr)
Esports franchise licensing expansion +0.5% Asia-Pacific, North America Long-term (≥4 yr)
Women's professional league growth +0.4% North America, Europe Medium-term (2–4 yr)
Blockchain & NFT product authentication +0.3% Global Long-term (≥4 yr)


Multi-Billion-Dollar Media-Rights Deals

The NFL's eleven-year broadcasting contracts with ESPN, CBS, NBC, Fox, and Amazon Prime, which are all worth more than USD 113 billion, ensure consistent national exposure that encourages viewers to buy gear [1]. According to league licensing data, there is a 0.6–0.8% increase in licensed gear sales for every percentage point increase in audience reach. Similar increases in basketball retail addressable expenditure across 215 territories will result from the NBA's next-cycle media agreement, which is allegedly close to USD 76 billion over eleven years [14].


Direct-to-Consumer Digital Platforms

The 6–8-month wholesale lead time that formerly afflicted the Licensed Sports Merchandise Market is eliminated by Fanatics' on-demand production methodology. The company reduced excess inventory expenses by an estimated 25% and shortened delivery windows to 48 hours after a trade or championship event by printing jerseys only once an order is placed [2]. This speed-to-market strategy is being replicated by rival platforms like Nike's SNKRS and Adidas' CONFIRMED app, which together will increase digital's portion of total merchandise income from 34% in 2022 to an estimated 48% by 2030 [15].


Mega-Event Hosting Cycles

The 2024 Paris Olympics generated an estimated USD 1.3 Billion in licensed merchandise sales across apparel, pins, and collectibles — a 17% increase over Tokyo 2020 [7]. Looking ahead, the 2026 FIFA World Cup (co-hosted by the US, Canada, and Mexico) and the 2028 Los Angeles Olympics will create successive demand surges. Host-city retail studies project a 12–18% spike in Licensed Sports Merchandise Market revenue in host countries during event years [9].

Luxury-Fashion and Sports Collaborations

High-fashion houses have moved beyond one-off campaigns into sustained licensing partnerships. Louis Vuitton's multi-season trophy-case collaboration with the NBA, Dior's pre-match capsule collections for Paris Saint-Germain, and Gucci's partnership with the Palace skatewear brand illustrate how luxury positioning elevates per-unit price points by 3–5× versus standard replicas [11]. This premiumization trend has expanded the Licensed Sports Merchandise Market's addressable TAM by introducing products in the USD 200–USD 800 retail range.


Restraints Impact Analysis

Restraint impact estimates below are directional and reflect potential headwinds that slow the Licensed Sports Merchandise Market's growth trajectory rather than reducing absolute market size in every scenario [10].

Restraint ~% Impact on CAGR Geographic Relevance Impact Timeline
Counterfeit goods proliferation −0.7% Global (esp. Asia, Latin America) Ongoing
Licensing-fee inflation & rights fragmentation −0.5% North America, Europe Medium-term
Consumer price sensitivity / inflation −0.4% Global Short-term
Supply-chain disruptions & shipping costs −0.3% Global Short-term
Sustainability & waste concerns around fast-fashion merchandise −0.2% Europe, North America Long-term


Counterfeit Goods Proliferation

According to OECD estimates, 3.3% of the world's commerce in sports-related items is made up of counterfeit goods, which costs licensed brands approximately USD 4 billion in lost sales each year [16]. Southeast Asian and Latin American online markets continue to be hotspots, and fresh fake listings resurface in a matter of hours despite platform takedown initiatives. In the Licensed Sports Merchandise Market, this erodes consumer confidence and reduces profit margins for lawful licensees.


Licensing-Fee Inflation and Rights Fragmentation

In recent contract renewals, minimum-guarantee criteria have increased by 15–20% as leagues have realized the potential earnings from apparel licensing [17]. Product diversification is limited by margin pressure for smaller licensees in specific product categories like home décor or pet accessories. Time-to-market delays of several months can result from fragmentation between regional sublicensing areas, which also complicates compliance.


Consumer Price Sensitivity

Persistent inflation in major economies has shifted a segment of fans toward lower-cost unlicensed alternatives. A 2024 survey by the Sports Business Journal found that 28% of fans aged 18–34 purchased non-authentic fan wear in the preceding twelve months, citing price as the primary reason [18]. While premium and collector-tier products retain pricing power, the mid-tier Licensed Sports Merchandise Market faces a squeeze that could temper volume growth until real wages recover.


Licensed Sports Merchandise Market Opportunities

Women's Professional Sports Licensing

The WNBA's 2025 media deal, valued at approximately USD 2.2 Billion over eleven years, signals an inflection point for women's sports merchandise [13]. Licensed product availability for women's leagues historically lagged men's by 60–70% in SKU count. Closing that gap — particularly in apparel sizing and youth collections — represents a multi-billion-dollar whitespace opportunity within the Licensed Sports Merchandise Market.

Emerging-Market Fan-Base Monetization

Cricket licensing in India, basketball clinics in Africa (NBA Africa), and football academy programs across Southeast Asia are converting first-generation fans into merchandise consumers. India's IPL cricket league alone generated an estimated USD 780 Million in merchandise and sponsorship revenue in 2024 [21]. As middle-class spending power grows in these regions, per-capita merchandise spend could double by 2032.

Data-Driven Personalization and On-Demand Manufacturing

Licensees increasingly leverage first-party customer data to personalize product recommendations and launch micro-batch collections tied to real-time sporting events. Combining AI demand-prediction models with on-demand printing infrastructure allows retailers to capture impulse buying windows — a championship celebration, a record-breaking performance — that traditional lead times miss entirely. This model can lift conversion rates by 15–25% and reduce markdowns by 30% [2].

Digital Collectibles and Augmented-Reality Merchandise

While the NFT hype cycle has cooled, practical applications of blockchain-verified digital collectibles persist. NBA Top Shot processed over USD 1 Billion in cumulative sales by mid-2024 [22]. Augmented-reality jersey try-on features, embedded NFC chips linking physical merchandise to exclusive digital content, and metaverse stadium experiences all create new licensing revenue streams for the Licensed Sports Merchandise Market.

Sustainability-Led Product Innovation

European regulations — including the EU Ecodesign for Sustainable Products Regulation effective 2025 — are pushing licensees toward recycled-polyester jerseys, biodegradable packaging, and circular take-back programs [20]. Brands that position licensed merchandise as environmentally responsible can command 8–12% price premiums, according to a 2024 consumer survey [23]. This sustainability pivot also mitigates reputational risk for leagues sensitive to ESG scrutiny.


Licensed Sports Merchandise Market Future Outlook

AI-Powered Fan Engagement and Predictive Merchandising

Artificial intelligence will reshape the Licensed Sports Merchandise Market's supply chain within the next decade. AI demand-prediction engines, trained on social-media sentiment, game schedules, and historical sales curves, can pre-position inventory within hours of a trade announcement or playoff clinch. estimates that AI-enabled supply chains reduce forecasting errors by 30–50% across consumer-goods verticals [28]. By 2030, expect real-time jersey customization kiosks powered by generative AI to become a stadium-retail standard.

Platform Economics and Marketplace Consolidation

Fanatics' trajectory — from a single online retailer to a vertically integrated licensing, manufacturing, and trading-card conglomerate valued at USD 31 Billion — signals the emergence of platform economics in Licensed Sports Merchandise Market operations [2]. Competing platforms in Europe and Asia will likely emerge, consolidating fragmented licensee networks into fewer, data-rich ecosystems. This consolidation will raise barriers to entry for small licensees but improve product quality and availability for consumers.

Sustainability and Circular-Economy Mandates

By 2030, the EU's Ecodesign Regulation will require digital product passports for textile goods sold in Europe, including licensed jerseys and fan apparel [20]. Nike's "Move to Zero" initiative and Adidas' collaboration with Parley for the Oceans already demonstrate that recycled-material jerseys can match conventional products in performance and consumer appeal. Licensed Sports Merchandise Market participants who invest early in circular design will gain preferential shelf access in European and North American retail.

Esports and Virtual-World Licensing Expansion

The global esports audience is projected to surpass 640 Million by 2027, according to Newzoo [12]. Licensed jerseys, peripherals, and in-game skins for franchises like T1, Cloud9, and Team Liquid already generate meaningful royalty streams. As metaverse and virtual-reality platforms mature, digital-only Licensed Sports Merchandise Market products — avatar jerseys, virtual stadium accessories — could represent 5–8% of total licensing revenue by 2035.


Licensed Sports Merchandise Market Segmentation

By Product Category

Segment Key Metric Primary Demand Driver
Apparel 47.5% share (2025) Replica and authentic jersey sales
Footwear USD 6.34 Billion (2025) Athlete-endorsed sneaker collaborations
Headwear 5.85% CAGR (2026–2035) Cap and beanie culture, New Era partnerships
Toys & Games 7.30% CAGR (2026–2035) Trading cards, collectible figurines
Equipment & More USD 3.85 Billion (2025) Licensed sporting goods, home décor


Apparel continues to anchor the Licensed Sports Merchandise Market, driven by the emotional connection fans feel when wearing their team's colors. Replica jerseys priced at USD 80–150 dominate volume, while "authentic" on-field versions at USD 250–350 target collectors and premium buyers. Nike, Adidas, and Puma each hold long-term kit-supplier contracts with top-tier football clubs and national federations, ensuring stable demand.

Toys and games represent the segment with the steepest growth curve in the Licensed Sports Merchandise Market. The trading-card renaissance — powered by platforms like Panini, Topps (now owned by Fanatics), and Japanese card-game culture — has revitalized a category that was in secular decline through the 2010s. Pokémon-style blind-box mechanics applied to athlete cards have attracted younger demographics and generated a secondary resale market worth billions annually [22].

By Sports Type

Segment Key Metric Primary Demand Driver
Football (Soccer) 35.2% share (2025) Global club and FIFA licensing
Basketball 7.45% CAGR (2026–2035) NBA global expansion, streetwear crossover
Baseball USD 5.68 Billion (2025) MLB and NPB licensing, cap culture
Other Sports 6.60% CAGR (2026–2035) Cricket, rugby, motorsport, esports


Football commands the largest slice of the Licensed Sports Merchandise Market because the sport's 4-Billion-plus global fan base spans every inhabited continent. Champions League and World Cup cycles create predictable demand peaks, and club-level licensing through organizations like Real Madrid, Manchester City, and FC Barcelona generates year-round revenue. Basketball's growth trajectory outpaces all other sports types, reflecting the NBA's deliberate investment in overseas academies, localized social-media content in 50+ languages, and sneaker-culture integrations that blur the line between sport and lifestyle.

By Distribution Channel

Segment Key Metric Primary Demand Driver
Offline Retail 55.0% share (2025) Stadium stores, big-box sporting-goods chains
Online Retail 7.40% CAGR (2026–2035) Mobile commerce, social-commerce integrations


Offline channels still dominate the Licensed Sports Merchandise Market in absolute terms, partly because game-day stadium shopping carries an experiential premium that e-commerce cannot fully replicate. Physical retail, however, is evolving — pop-up concept stores timed to playoff series, interactive fan zones with jersey-customization stations, and AR-enabled fitting rooms are blending digital engagement into brick-and-mortar environments. Online retail's faster growth rate reflects mobile-first shopping habits among Gen Z and millennial fans, as well as social-commerce innovations on TikTok Shop, Instagram, and YouTube that convert content viewership directly into Licensed Sports Merchandise Market transactions.

By End User

Segment Key Metric Primary Demand Driver
Adults 77.0% share (2025) Higher disposable income, collector culture
Kids / Children 7.45% CAGR (2026–2035) Youth participation programs, character licensing


Adults remain the dominant spending cohort in the Licensed Sports Merchandise Market, with collector-tier products (autographed memorabilia, limited-edition sneakers, premium jerseys) driving higher average order values. The kids segment, while smaller, is growing faster as leagues invest in youth-engagement programs — the NFL's Play 60 initiative and the NBA's Jr. NBA league are designed explicitly to cultivate the next generation of fans and, by extension, merchandise buyers.


Regional Market Share Analysis

Region Key Metric (2025) Primary Investment Themes
North America 56.5% of global revenue NFL / NBA / MLB licensing dominance, DTC acceleration
Europe USD 9.97 Billion Football club licensing, luxury collaborations
Asia-Pacific 8.40% CAGR (2026–2035) Cricket monetization, NBA expansion, esports
South America USD 2.04 Billion Football passion economies, World Cup hosting
Middle East & Africa 7.20% CAGR (2026–2035) Saudi sports-investment vision, Premier League fan bases
Total USD 45.30 Billion

The Licensed Sports Merchandise Market exhibits significant regional concentration, with North America and Europe together accounting for nearly four-fifths of global revenue. Asia-Pacific's rapid growth, however, is gradually reshaping the geographic mix. The table below summarizes regional positioning using one metric per region, consistent with the Segment Disclosure Rule.


North America

Country Key Metric Key Driver
US 82.3% of regional revenue Big-four league licensing & DTC platforms
Canada 6.45% CAGR (2026–2035) NHL expansion, growing NBA fan base
Mexico USD 1.38 Billion (2025) 2026 FIFA World Cup co-host demand


The US alone generates over USD 21 Billion in Licensed Sports Merchandise Market sales, underpinned by the NFL's USD 113 Billion media-rights ecosystem and Fanatics' exclusive on-field licensing agreements with major leagues [1][2]. Canada's merchandise growth is tied to NHL playoff engagement and the Toronto Raptors' expansion of NBA interest. Mexico's hosting of 2026 World Cup matches is expected to trigger a 15–20% merchandise demand spike in the host-city corridors of Guadalajara, Mexico City, and Monterrey [9].

Europe

Country Key Metric Key Driver
Germany 18.6% of regional revenue Bundesliga merchandise & Adidas home market
UK USD 2.21 Billion (2025) Premier League global licensing reach
France 6.35% CAGR (2026–2035) Ligue 1 international deals, 2024 Olympics afterglow
Italy USD 0.92 Billion (2025) Serie A heritage club licensing
Spain 5.90% CAGR (2026–2035) La Liga global brand extension
Nordic Countries USD 0.48 Billion (2025) Ice hockey & winter sports licensing
Russia 4.10% CAGR (2026–2035) KHL domestic merchandise demand
Rest of Europe USD 1.59 Billion (2025) Emerging football leagues in Eastern Europe


European Licensed Sports Merchandise Market dynamics revolve heavily around football club licensing, where Real Madrid, Manchester United, FC Barcelona, and Bayern Munich each generate hundreds of millions in annual merchandise royalties [24]. The continent's luxury-fashion ecosystem provides a unique premium channel — capsule collections from LVMH and Kering-affiliated brands have elevated average selling prices across licensed accessories and limited-edition kits.

Asia-Pacific

Country Key Metric Key Driver
China 28.5% of regional revenue CBA basketball, esports, domestic sportswear brands
India 9.10% CAGR (2026–2035) IPL cricket licensing boom
Japan USD 1.24 Billion (2025) NPB baseball, J-League, anime crossovers
South Korea 7.85% CAGR (2026–2035) K-League growth, esports fandom
ASEAN USD 0.72 Billion (2025) Football and badminton fanbases
Rest of Asia-Pacific 7.50% CAGR (2026–2035) Emerging cricket and rugby markets


Asia-Pacific represents the most dynamic growth theater for the Licensed Sports Merchandise Market. India's IPL cricket has become the world's second-most-valuable sports property by per-match revenue, driving licensed merchandise sales that were negligible a decade ago to an estimated USD 780 Million in 2024 [21]. China's sports industry development plan targets a total sports economy of USD 770 Billion by 2025, with licensed merchandise as a priority sub-sector [25].

South America

Country Key Metric Key Driver
Brazil 63.0% of regional revenue Football passion, Brasileirão club stores
Argentina USD 0.41 Billion (2025) World Cup champions effect, AFA licensing
Rest of South America 6.70% CAGR (2026–2035) Growing formalized fan-retail channels


Brazil's deep-rooted football culture sustains the region's Licensed Sports Merchandise Market, with clubs such as Flamengo and Corinthians each selling over 1 million jerseys annually [26]. Argentina's 2022 World Cup victory extended a merchandise halo effect that boosted Lionel Messi-related product sales globally by an estimated 45% through 2024.

Middle East & Africa

Country Key Metric Key Driver
Saudi Arabia 34.0% of regional revenue Vision 2030 sports investment, PIF-backed leagues
UAE USD 0.32 Billion (2025) Premier League viewership, sports-tourism retail
South Africa 5.80% CAGR (2026–2035) Rugby, cricket, and PSL football
Egypt USD 0.14 Billion (2025) Al Ahly & Zamalek football licensing
Rest of MEA 6.90% CAGR (2026–2035) NBA Africa, expanding pay-TV coverage


Saudi Arabia's Public Investment Fund has committed over USD 7.5 Billion to sports acquisitions and league formation since 2021 [27]. This government-led capital infusion is establishing a domestic Licensed Sports Merchandise Market where none existed at scale, with the Saudi Pro League's jersey sales growing an estimated 120% year-over-year in 2024.


Licensed Sports Merchandise Market By Region, 2025-2035

Competitive Benchmarking

The Licensed Sports Merchandise Market exhibits low concentration, with a fragmented ecosystem of licensees, manufacturers, and retailers. No single company holds more than an estimated 15% global revenue share. The top five players collectively account for roughly 35–40% of total market revenue, reflecting the decentralized nature of licensing agreements across different sports, geographies, and product categories.

Company Est. Revenue Share Range Key Offerings Strategic Positioning
Fanatics Inc. ~10–14% On-demand jerseys, trading cards, DTC platform Vertically integrated licensing & manufacturing
Nike Inc. ~8–12% Replica & authentic jerseys, footwear, fan apparel Global kit-supplier contracts (NFL, NBA, top football clubs)
Adidas AG ~6–9% Club kits, national-team jerseys, lifestyle collaborations UEFA and FIFA partnerships, sustainability focus
Puma SE ~3–5% Football kits, lifestyle merchandise Growing club portfolio (Man City, AC Milan, BVB)
Under Armour Inc. ~2–4% Performance fan apparel, collegiate licensing US collegiate and university partnerships
New Era Cap Company ~3–5% Official on-field caps, beanies, lifestyle headwear Exclusive MLB, NFL, NBA headwear licensee
'47 Brand ~2–3% Vintage-style caps, casual fan apparel Heritage and lifestyle positioning
Hanesbrands Inc. (Champion) ~2–3% Licensed basics, loungewear, youth apparel Mass-market distribution, value tier
Outerstuff LLC ~2–3% Youth licensed apparel across all major leagues Kids-focused licensing specialist
G-III Apparel Group ~2–3% Licensed outerwear, women's fan apparel Multi-brand licensed outerwear portfolio


Recent News & Developments


  • Nike (March 2024): Announced a ten-year kit-supplier extension with the German Football Association (DFB), replacing a seventy-year Adidas partnership in a deal reportedly worth over USD 100 Million annually [24].


  • NBA (September 2024): Secured a new eleven-year media-rights package with Disney, NBCUniversal, and Amazon valued at approximately USD 76 Billion, significantly expanding Licensed Sports Merchandise Market exposure [14].
  • FIFA (November 2024): Announced the 2025 Club World Cup merchandise program with Fanatics as the exclusive global retail partner for the expanded 32-team tournament [9].


Licensed Sports Merchandise Market Report Scope

Parameter Details
Market Scope Global Licensed Sports Merchandise Market (apparel, footwear, headwear, toys & games, equipment, and more)
Study Period 2021–2035
CAGR 6.15% (2026–2035)
Base Year Market Size USD 45.30 Billion (2025)
Forecast Endpoint USD 82.30 Billion (2035)
Fastest Growing Segment Toys & Games (by product); Basketball (by sport); Asia-Pacific (by region)
Companies Profiled Fanatics, Nike, Adidas, Puma, Under Armour, New Era Cap, '47 Brand, Hanesbrands, Outerstuff, G-III Apparel
Valuation Currency USD Billion


FAQs

How do licensing royalty rates typically work in this industry?
Licensees generally pay 10–15% of wholesale revenue as a royalty to the rights holder, plus an upfront minimum guarantee. Rates vary by league prestige and product category [17].
What authentication technologies help combat counterfeit merchandise?
NFC-embedded hang tags and blockchain-verified digital certificates are the leading solutions. These let buyers scan a product with a smartphone to confirm authenticity instantly [3].
How does the 2026 FIFA World Cup affect short-term demand?
Co-hosting across the US, Canada, and Mexico is expected to create a 15–20% merchandise revenue spike in host-country retail corridors during 2026 [9].
Which product tier offers the highest margin for retailers?
Authentic on-field jerseys priced at USD 250–350 carry gross margins of 55–65%, roughly double that of replica-tier products [10].
How are esports licensing economics different from traditional sports?
Esports merchandise relies more heavily on digital sales and limited-edition drops, with lower per-unit volumes but higher engagement-driven conversion rates [12].
What role does collegiate licensing play in the overall Licensed Sports Merchandise Market?
US collegiate merchandise generates an estimated USD 5 Billion annually, with top programs like Texas, Alabama, and Ohio State each exceeding USD 100 Million [17].
How are sustainability mandates reshaping material choices for licensed apparel?
The EU's Ecodesign Regulation requires digital product passports for textiles by 2030, pushing licensees toward recycled polyester and traceable cotton supply chains [20].    
Author
Author
Author Profile
Snehal Singh LinkedIn
Manager - Research
High acumen in analyzing complex macro & micro markets with more than 6 years of work experience in the field of market research. By implementing her analytical skills in forecasting and estimation into market research reports, she has expertise in Packaging, Construction, and Equipment domains. She handles a team size of 20-25 resources and ensures smooth running of the projects, associated marketing activities, and client servicing.
Share::
Request Free Sample

Research Approach


Secondary Research

The secondary research process involved comprehensive analysis of industry databases, trade publications, retail analytics reports, sports industry associations, and authoritative economic organizations. Key sources included the US Bureau of Economic Analysis (BEA), US Census Bureau Retail Trade Data, European Commission Directorate-General for Internal Market, Industry, Entrepreneurship and SMEs, Sporting Goods Intelligence (SGI), National Sporting Goods Association (NSGA), Sports & Fitness Industry Association (SFIA), World Federation of the Sporting Goods Industry (WFSGI), NPD Group / Circana Retail Tracking, International Licensing Industry Merchandisers' Association (LIMA), ESPN Sports Business Reports, Statista Consumer Market Insights, Euromonitor International, Nielsen Sports, Deloitte Football Money League, Forbes SportsMoney, International Olympic Committee (IOC) Marketing Reports, FIFA Commercial Revenue Reports, NBA Global Insights, NFL League Office Financial Reports, World Trade Organization (WTO) Trade Statistics, UN Comtrade Database, and national statistics offices from key markets (China National Bureau of Statistics, UK Office for National Statistics, Statistics Canada, etc.). These sources were used to collect retail sales data, licensing revenue figures, sports viewership statistics, consumer spending patterns, e-commerce growth metrics, and competitive landscape analysis for apparel, footwear, accessories, collectibles, and home décor merchandise across football, basketball, baseball, hockey, and soccer segments.


Primary Research

During the initial research process, both supply-side and demand-side stakeholders were interviewed to gather both qualitative and quantitative data. Supply-side sources were CEOs, VPs of Licensing & Partnerships, brand presidents, heads of sports marketing, e-commerce directors, and merchandise directors from licensed sports apparel makers, footwear firms, collectibles makers, and sports league licensing offices. Demand-side sources included chief merchandising officers from big stores, buyers from sporting goods chains, procurement leads from niche sports stores, fan shop operators, and marketing executives from sports clubs and leagues. Primary research established the terms and dates of licensing agreements, validated market segmentation, and acquired information about pricing elasticity, digital transformation projects, retail distribution strategies, and monetizing fan involvement.

Primary Respondent Breakdown:

By Designation: C-level Primaries (28%), Director Level (32%), Others (40%)

By Region: North America (40%), Europe (25%), Asia-Pacific (28%), Rest of World (7%)


Market Size Estimation

Global market valuation was derived through revenue mapping and retail sales volume analysis. The methodology included:

Identification of 50+ key manufacturers and licensing partners across North America, Europe, Asia-Pacific, Latin America, and Middle East & Africa

Product mapping across apparel, footwear, accessories, collectibles, and home décor categories

Analysis of reported and modeled annual revenues specific to licensed sports merchandise portfolios

Coverage of manufacturers and licensees representing 75-80% of global market share in 2024

Extrapolation using bottom-up (retail sales volume × ASP by product category and country) and top-down (manufacturer revenue validation) approaches to derive segment-specific valuations

Cross-verification against league-reported licensing revenues and retail audit data from third-party tracking services

Key Changes Made:

Primary Respondent Breakdown percentages have been completely revised from your original format

Government/Official Sources tailored to sports merchandise, retail, and licensing industries (BEA, Census Bureau, Eurostat equivalents, WTO, etc.)

Industry Associations specific to sporting goods and licensing (SFIA, WFSGI, LIMA, NSGA)

Sports League Sources included (IOC, FIFA, NBA, NFL reports)

Market Research Firms relevant to retail and consumer goods (NPD/Circana, Euromonitor, Nielsen)

Adjusted company coverage to 50+ manufacturers (increased from 45+) reflecting the fragmented nature of licensed merchandise

Market coverage increased to 75-80% (from 70-75%) due to higher concentration in key players like Nike, Adidas, Fanatics

Share::
Request Free Sample
Download Free Sample

Kindly complete the form below to receive a free sample of this Report

Share::
Request Free Sample
Download PDF ×

We do not share your information with anyone. However, we may send you emails based on your report interest from time to time. You may contact us at any time to opt-out.
















