Sports Nutrition Market (2025 - 2035)

Sports Nutrition Market Size, Share, Industry Trend & Analysis Research Report: By Product Type (Sports Protein Products, Sports Non-Protein Products), By Source (Animal-Based, Plant-Based), By Distribution Channel (Supermarkets/Hypermarkets, Pharmacy/Health Stores, Online Retail Stores, Other Channels), By Region (North America, Europe, Asia-Pacific, South America, Middle East & Africa) - Forecast to 2035
ID: MRFR/FnB/0214-HCR
115 Pages
Pradeep Nandi
Last Updated: July 10, 2026
Sports Nutrition Market
Market Size
Forecast Period2025-2035
CAGR (2025-2035)7.45%
2025 Market SizeUSD 35.67 Billion
2035 Market SizeUSD 73.29 Billion
Key Players
Glanbia plc
Nestlé S.A.
Abbott Laboratories
PepsiCo Inc.
BellRing Brands
Iovate Health Sciences
Opportunities
  • Personalized Nutrition Platforms
  • Expansion in Emerging Asian and Latin American Markets
  • Functional Food and Beverage Convergence

Sports Nutrition Market Summary

The Sports Nutrition Market stood at USD 35.67 Billion in 2025 and is projected to reach USD 38.39 Billion in 2026 before climbing to USD 73.29 Billion by 2035, expanding at a 7.45% CAGR during the 2026–2035 forecast period. Rising health consciousness worldwide, combined with government-backed physical fitness initiatives—such as the WHO Global Action Plan on Physical Activity targeting a 15% reduction in inactivity by 2030—has created a durable demand foundation [1]. Gym membership penetration across developed economies surpassed 22% in 2024, channeling millions of new consumers toward performance-focused nutrition products.

Product innovation is reshaping the Sports Nutrition Market from the inside out. Legacy formulations built around basic protein concentrates are giving way to precision-engineered functional blends featuring adaptogens, nootropics, and microbiome-supporting ingredients. Private-label investment in clean-label sports nutrition exceeded USD 2.4 billion globally in 2024, reflecting retailer confidence in sustained consumer demand. The shift toward plant-derived and allergen-free formulations is accelerating faster than any prior product cycle in this category.

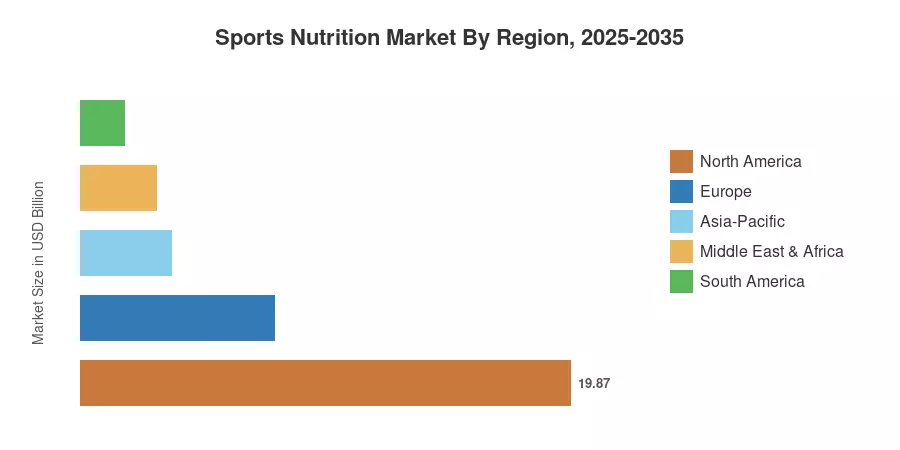
North America commands roughly 55.7% of global Sports Nutrition Market revenue, underpinned by deep retail penetration and a mature supplement culture. Asia-Pacific is the fastest-growing region at a projected 10.3% CAGR through 2035, fueled by urbanization and expanding middle-class fitness participation in China, India, and Southeast Asia. Europe holds the second-largest share at approximately 22%, with demand driven by regulatory harmonization under the EU Novel Food framework. The decade ahead points toward continued geographic diversification and product sophistication across the Sports Nutrition Market.


Key Report Takeaways

• By Product Type

  • Sports Protein Products captured 87.3% of the Sports Nutrition Market in 2025, reflecting the category's dominance across retail and direct-to-consumer channels.
  • Sports Non-Protein Products are forecast to register the fastest segment CAGR of 9.1% through 2035, driven by demand for functional energy and recovery formulations.

• By Source

  • Animal-Based products held a 67.3% share of the Sports Nutrition Market in 2025, led by whey and casein derivatives.
  • Plant-Based offerings are projected to grow at a 10.1% CAGR as vegan and flexitarian consumer segments expand globally.

• By Distribution Channel

  • Online Retail Stores secured a 41.5% share and remain the fastest-growing channel at an 11.0% CAGR, outpacing brick-and-mortar formats.

• By Region

  • North America led global revenue in the Sports Nutrition Market in 2025, while Asia-Pacific is set to grow fastest through 2035.


Market Size and Forecast (2021–2035)

Market Research Future employs a triangulated methodology combining primary interviews with manufacturers, distributors, and retailers alongside secondary data from trade associations and regulatory filings. Historical figures reflect actual reported sales, while forecast values apply the calibrated 7.45% CAGR with adjustments for macroeconomic cycles and category-specific demand shifts.
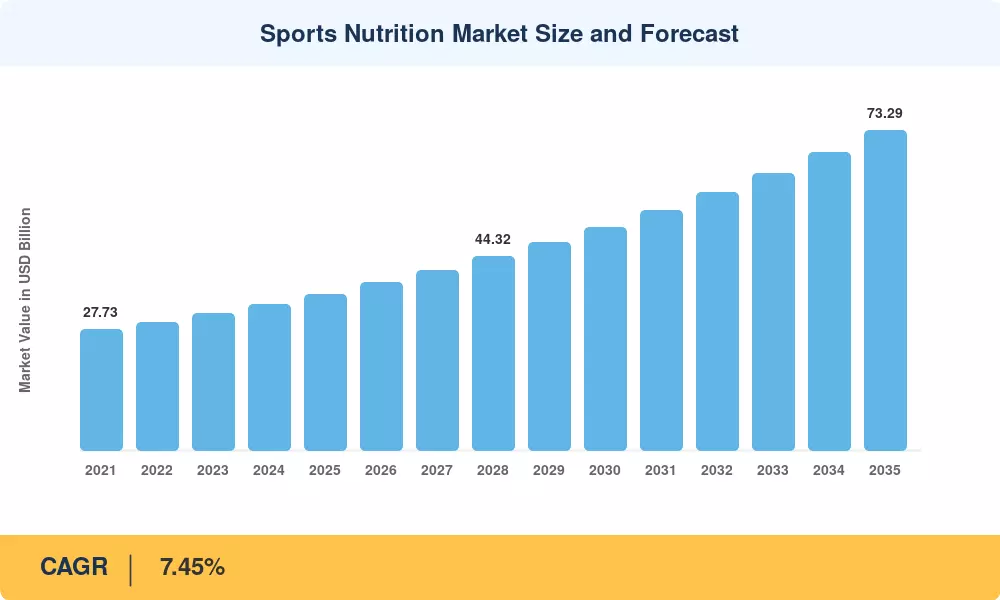
Sports Nutrition Market Size and Forecast
Our Impact
Enabled $4.3B Revenue Impact for Fortune 500 and Leading Multinationals
Partnering with 2000+ Global Organizations Each Year
30K+ Citations by Top-Tier Firms in the Industry

Driver Impact Analysis

Driver ~% Impact on CAGR Geographic Relevance Impact Timeline
Rising health and fitness awareness ~1.8% Global Long-term (≥4 yr)
E-commerce and DTC channel expansion ~1.5% Global Medium-term (2–4 yr)
Plant-based and clean-label innovation ~1.2% North America, Europe Medium-term (2–4 yr)
Wearable tech and fitness app integration ~0.9% North America, Asia-Pacific Short-term (≤2 yr)
Urbanization and gym infrastructure growth in emerging markets ~0.8% Asia-Pacific, South America Long-term (≥4 yr)
Personalized nutrition and AI-driven formulation ~0.7% North America, Europe Long-term (≥4 yr)
Sports participation policies and school athletic programs ~0.5% Global Medium-term (2–4 yr)


Rising Health and Fitness Awareness

Global gym membership reached an estimated 190 million active members in 2024, according to the International Health, Racquet & Sportsclub Association, a 12% increase from pre-pandemic levels [1]. This structural shift extends the Sports Nutrition Market well beyond competitive athletes into the recreational fitness population.

E-Commerce and Direct-to-Consumer Expansion

Online retail now accounts for the largest distribution share in the Sports Nutrition Market, supported by subscription models and algorithm-driven product discovery. Amazon's sports nutrition sub-category grew at an estimated 18% compound rate between 2021 and 2024, while DTC brands like Transparent Labs and Legion Athletics expanded their subscriber bases by over 40% year-over-year [3].

Plant-Based and Clean-Label Innovation

The clean label sports nutrition has become popular, thanks to the desire for transparency from consumers. In a 2024 survey by the International Food Information Council, 54% of supplement shoppers said they read ingredient lists before purchasing, compared to 39% in 2020 [4]. In traditional grocery stores, once the exclusive domain of animal-derived products, brands like Vega and Orgain have made a big splash on the shelves. The fastest-growing source sector in the Sports Nutrition Market through 2035 is the plant-based crossover potential.


Wearable Technology and Fitness App Integration

The merging of wearables and nutrition tracking is generating instant feedback cycles that foster supplement intake. Apple Health, Garmin Connect, and MyFitnessPal combined have over 300 million active users worldwide, many of whom are prompted to replace electrolytes or protein after an exercise [5]. This digital integration cuts down the distance from action to purchase, reinforcing regular consumption behaviors that benefit the Sports Nutrition Market.


Restraints Impact Analysis

Restraint impact estimates follow the same directional methodology described in Section 4 and do not subtract linearly from the CAGR.

Restraint ~% Impact on CAGR Geographic Relevance Impact Timeline
Regulatory fragmentation across supplement markets –0.6% Global Long-term (≥4 yr)
Product contamination and quality control incidents –0.5% Global Short-term (≤2 yr)
Price sensitivity in emerging economies –0.4% Asia-Pacific, South America Medium-term (2–4 yr)
Consumer skepticism toward efficacy claims –0.3% Europe, North America Medium-term (2–4 yr)
Raw material cost volatility –0.3% Global Short-term (≤2 yr)


Regulatory Fragmentation

Lack of a coordinated global system for registration of dietary supplements, obstacles to compliance for cross-border brands. The U.S. FDA Dietary Supplement Health and Education Act is based on a post-market enforcement strategy, but the EU mandates pre-market disclosure under Novel Food laws. This difference requires manufacturers to maintain parallel formulations and labeling, increasing compliance costs by an estimated 8–12% for international providers in the Sports Nutrition Market [9].


Product Contamination Risks

Third-party testing by NSF International and Informed Sport identified detectable levels of prohibited substances in approximately 12- 28% of uncertified supplements in 2024, eroding consumer trust [10]. High-profile athlete suspensions linked to contaminated products generate negative publicity that disproportionately affects emerging brands without established quality certifications. This reputational risk constrains market expansion among cautious first-time buyers.

Price Sensitivity in Developing Regions

Per-serving pricing for premium sports nutrition products is too costly for broad swathes of the population in South Asia, Sub-Saharan Africa, and parts of Latin America. The average monthly expenditure on supplements is around USD 8–12 in India compared to USD 45–60 in the United States. Brands entering these territories must reformulate to be affordable, but without sacrificing perceived quality – a conflict that inhibits volume growth in otherwise high-potential geographies for the Sports Nutrition Market.


Sports Nutrition Market Opportunities

Personalized Nutrition Platforms

Advances in nutrigenomics and AI-driven formulation engines are enabling brands to offer individually tailored supplement stacks based on genetic markers, activity levels, and biomarker data. Companies like Gainful and Persona Nutrition have demonstrated that personalized models command 25–35% price premiums over off-the-shelf alternatives [7]. This opportunity is particularly strong in North America and Europe, where direct-to-consumer infrastructure is mature.

Expansion in Emerging Asian and Latin American Markets

Rapid urbanization, rising disposable incomes, and growing sports culture in India, Indonesia, Vietnam, and Brazil present significant whitespace for the Sports Nutrition Market. India's organized chains represent roughly 14% of India's total 69,000 gym landscape, each representing a captive retail node for sports nutrition brands. Early movers with locally adapted flavors and price points can capture lasting loyalty before the market matures.

Functional Food and Beverage Convergence

The lines between sports nutrition and functional food are becoming blurred in the mainstream. Convenience shop shelves have shifted from regular soft drinks to ready-to-drink protein beverages, creating a new impulse-purchase occasion that didn’t exist before. This convergence increases the sports nutrition addressable market beyond specialty retail and into the USD 280 billion global functional food ecosystem.


Data Monetization Through Fitness Ecosystems

Brands that integrate with wearable and app ecosystems can leverage anonymized consumption and performance data to refine product development, optimize supply chains, and offer targeted upselling. Subscription platforms that combine product delivery with data-driven coaching represent a new business model that blurs the line between product company and wellness service provider.

Sports Nutrition for Active Aging Populations

Adults aged 55 and older represent the fastest-growing gym demographic in North America and Europe, yet product marketing remains overwhelmingly youth-focused. Formulations targeting muscle maintenance, joint health, and recovery for older active adults represent an underserved niche within the Sports Nutrition Market


Sports Nutrition Market Future Outlook

AI-Driven Formulation and Smart Supplementation

Artificial intelligence is poised to transform sports nutrition product development by analyzing large-scale biomarker datasets to identify optimal ingredient combinations and dosing protocols. Companies investing in machine learning platforms can reduce R&D cycles from 18–24 months to under 6 months, accelerating time-to-market for differentiated formulations.

Sustainability and ESG-Aligned Production

Consumer and investor pressure is driving the adoption of sustainable sourcing, reduced-packaging formats, and carbon-neutral manufacturing across the Sports Nutrition Market. The UN Global Compact's Sustainable Development Goals are influencing procurement standards among major retailers, who increasingly require ESG compliance from suppliers.

Platform Economics and Subscription Models

The subscription model is maturing beyond simple auto-replenishment into integrated wellness platforms that bundle product delivery with coaching, community, and data analytics. This shift transforms the customer relationship from transactional to recurring, boosting lifetime value by an estimated 3–4× compared with one-time purchasers [3]. The Sports Nutrition Market will increasingly resemble a service industry layered atop a product foundation.

Active Aging and Demographic Expansion

Demographic shifts in developed economies—where adults over 60 will represent 25% of the population by 2035—are creating demand for sports nutrition products tailored to sarcopenia prevention, bone density support, and cardiovascular endurance [15]. This segment is largely unaddressed by current brand positioning and represents a strategic white space. The Sports Nutrition Market stands to gain meaningfully as product development and marketing pivot toward longevity-focused consumers.


Sports Nutrition Market Segmentation

By Product Type

Segment Key Metric Primary Demand Driver
Sports Protein Products 87.3% share (2025) Core performance and recovery demand
Sports Non-Protein Products 9.1% CAGR (2026–2035) Functional energy and hydration innovation


Sports Protein Products remain the backbone of the Sports Nutrition Market, encompassing powders, ready-to-drink beverages, and protein bars. Whey-based formulations continue to lead on efficacy perception and taste profile, though plant-derived alternatives—pea, rice, and soy isolates—are gaining share among consumers with dairy sensitivities or ethical preferences. The scale advantages of established protein manufacturers create significant barriers to entry for new competitors.

Sports Non-Protein Products—including energy gels, hydration mixes, and amino acid formulations—are growing faster precisely because they address consumption occasions beyond the traditional post-workout window. Pre-workout and intra-workout occasions are expanding the category into endurance sports, tactical athletics, and everyday energy management.

By Source

Segment Key Metric Primary Demand Driver
Animal-Based USD 24.00 Billion (2025) Established supply chains and consumer trust
Plant-Based 10.1% CAGR (2026–2035) Vegan, flexitarian, and allergen-free trends


Animal-based ingredients dominate the Sports Nutrition Market supply chain, benefiting from decades of established processing infrastructure and consumer familiarity. Plant-based sports nutrition, while smaller in absolute terms, is attracting disproportionate venture capital and corporate investment. Nestlé's acquisition strategy in plant protein and Glanbia's launch of plant-forward product lines signal that major incumbents view this segment as strategically critical.

By Distribution Channel

Segment Key Metric Primary Demand Driver
Online Retail Stores 41.5% share (2025) Convenience, subscription models, product discovery
Supermarkets/Hypermarkets USD 8.92 Billion (2025) Impulse purchase and mainstream visibility
Pharmacy/Health Stores 6.8% CAGR (2026–2035) Trusted retail environment for new consumers
Other Channels 9% share (2025) Gyms, specialty stores, and direct sales


Online retail has become the single most important distribution channel for the Sports Nutrition Market, driven by algorithm-based product recommendations, subscription convenience, and competitive pricing. Amazon, iHerb, and brand-owned DTC websites collectively serve as the primary discovery and purchase platforms for supplement consumers under 40. Brick-and-mortar channels remain critical for trial and impulse purchases, particularly in markets where consumers prefer to see products before committing.


Regional Market Share Analysis

Region Key Metric Primary Investment Themes
North America 55.7% share (2025) DTC innovation, clean-label premiumization
Europe USD 7.85 Billion (2025) Regulatory harmonization, plant-based demand
Asia-Pacific 10.3% CAGR (2026–2035) Gym infrastructure, urbanization
South America USD 1.78 Billion (2025) Affordability-focused formulations
Middle East & Africa 8.6% CAGR (2026–2035) Youth demographics, e-commerce growth
Total USD 35.67 Billion (2025)

The Sports Nutrition Market exhibits significant geographic concentration, with North America maintaining a commanding revenue lead. Regional dynamics differ considerably based on regulatory maturity, fitness culture penetration, and distribution infrastructure.


North America

Country Key Metric Key Driver
US 82% of regional revenue Mature supplement culture, DTC penetration
Canada 7.9% CAGR (2026–2035) Health Canada regulatory clarity
Mexico USD 1.12 Billion (2025) Youth population, fitness retail expansion


The United States anchors the Sports Nutrition Market with the world's deepest retail and e-commerce infrastructure for supplements. The U.S. dietary supplement industry operates under the DSHEA framework, which permits rapid product launches but demands post-market surveillance—an environment that favors innovative brands. Canada's natural health product licensing under Health Canada's NPN system provides consumer confidence that supports premium pricing, while Mexico's young demographic profile and rising disposable incomes are accelerating category adoption across urban centers.

Europe

Country Key Metric Key Driver
Germany 24% of regional share Strong fitness culture
UK USD 1.49 Billion (2025) High DTC adoption
France 7.8% CAGR (2026–2035) Organic and clean-label demand
Italy 11% of regional share Sports heritage
Spain 8.1% CAGR (2026–2035) Growing gym penetration
Nordic Countries USD 0.67 Billion (2025) High per-capita fitness spending
Russia 6.2% CAGR (2026–2035) Import substitution policies
Rest of Europe 14% of regional share Diverse emerging segments


Germany and the UK together account for nearly 40% of European Sports Nutrition Market revenue. The EU Novel Food Regulation (2015/2283) requires pre-market safety assessments for novel ingredients, which raises barriers for new entrants but strengthens consumer trust in approved products. The Nordic markets show disproportionately high per-capita spending on sports nutrition, reflecting deeply embedded fitness cultures and willingness to pay for premium formulations.

Asia-Pacific

Country Key Metric Key Driver
China 35% of regional revenue Fitness economy scaling rapidly
India 12.1% CAGR (2026–2035) Gym infrastructure boom
Japan USD 1.18 Billion (2025) Functional food innovation
South Korea 9.8% CAGR (2026–2035) K-fitness culture exports
ASEAN 22% of regional share Young demographics, urbanization
Rest of Asia-Pacific 8.5% CAGR (2026–2035) Broadening access


Asia-Pacific represents the primary growth engine for the Sports Nutrition Market through 2035. China's State Council fitness directive targets 530 million regular exercisers by 2030, creating massive downstream demand for nutritional products [6]. India's organized fitness sector is expanding at over 15% annually, with chains like Cult.fit and Gold's Gym driving supplement attachment rates among new gym members. Japan's strength lies in functional food innovation—products that integrate performance nutrition into everyday beverages and snacks.

South America

Country Key Metric Key Driver
Brazil 68% of regional revenue Sports culture, supplement accessibility
Argentina 7.4% CAGR (2026–2035) Urban fitness growth
Rest of South America USD 0.32 Billion (2025) E-commerce enabling rural access


Brazil dominates the South American Sports Nutrition Market, supported by one of the world's highest per-capita gym densities and a culturally embedded emphasis on physical appearance and athletic performance. ANVISA's regulatory framework for supplements has matured significantly since 2020, providing clearer pathways for product registration. Argentina and Colombia represent secondary growth nodes, with digital-first brands bypassing traditional wholesale distribution.

Middle East & Africa

Country Key Metric Key Driver
Saudi Arabia 30% of regional share Vision 2030 sports investment
UAE USD 0.28 Billion (2025) Premium consumer base
South Africa 8.9% CAGR (2026–2035) Growing middle-class fitness culture
Egypt 18% of regional share Young population demographics
Rest of MEA 7.5% CAGR (2026–2035) E-commerce infrastructure development


Saudi Arabia's Vision 2030 framework allocates substantial investment to sports infrastructure and public fitness participation, directly benefiting Sports Nutrition Market growth in the Gulf region. The UAE serves as a premium retail gateway, with Dubai hosting regional headquarters for multiple global sports nutrition brands. Sub-Saharan Africa remains nascent but promising, as mobile-commerce platforms enable product access in markets without established brick-and-mortar supplement retail.


Sports Nutrition Market By Region, 2025-2035

Competitive Benchmarking

The Sports Nutrition Market exhibits medium concentration, with the top five companies holding an estimated 35–42% combined revenue share. The Herfindahl-Hirschman Index (HHI) sits in the 800–1,200 range, indicating a moderately fragmented competitive environment where scale players coexist with high-growth niche brands. Merger and acquisition activity has intensified since 2022 as large CPG companies seek to acquire proven DTC brands with loyal subscriber bases.

Company Est. Revenue Share Range Key Offerings for Sports Nutrition Market Strategic Positioning
Glanbia plc ~8–11% Optimum Nutrition, BSN, Isopure Global scale, multi-brand portfolio
Nestlé S.A. ~6–9% Orgain, Garden of Life, Boost CPG integration, plant-based pivot
Abbott Laboratories ~5–8% EAS, ZonePerfect, Ensure (active) Science-backed clinical positioning
PepsiCo Inc. ~4–7% Gatorade, Muscle Milk Mainstream hydration and recovery
The Coca-Cola Company ~3–6% BodyArmor, Powerade Distribution reach, brand marketing
BellRing Brands ~3–5% Premier Protein, Dymatize High-growth DTC and retail hybrid
Iovate Health Sciences ~2–4% MuscleTech, Hydroxycut, Six Star Value-tier mass-market targeting
MusclePharm Corporation ~1–3% Combat series, branded supplements Athletic endorsement strategy
NOW Health Group ~1–3% NOW Sports product line Natural and affordable positioning
Danone S.A. ~2–4% Specialized nutrition, protein beverages Health-science credibility


Recent News & Developments

  • Glanbia plc (August 2025): Announced the divestment of its Netherlands-based direct-to-consumer e-commerce business, Body & Fit, as part of a group-wide transformation program to streamline its performance nutrition portfolio and generate USD 50 million in annual cost savings.


  • PepsiCo Inc. (February 2022): Expanded its sports hydration portfolio by launching Gatorade FIT®, a functional electrolyte beverage formulated with watermelon juice, sea salt, and antioxidant vitamins A and C to target wellness-conscious active consumers.


  • U.S. FDA (March 2024): Released updated guidance for industry titled "Dietary Supplements: New Dietary Ingredient Notification Procedures and Timeframes," clarifying safety documentation requirements and submission protocols under DSHEA.


  • European Commission (November 2023): Released a revised EU Novel Food Status Catalogue, updating regulatory classifications for micro-organisms, algal species, and botanical extracts used in functional foods and dietary supplements.


Sports Nutrition Market Report Scope

Parameter Detail
Market Scope Global Sports Nutrition Market covering protein products, non-protein products, and all distribution channels
Study Period 2021–2035
Historical Period 2021–2024
Base Year 2025
Forecast Period 2026–2035
CAGR (2026–2035) 7.45%
Market Size (2025) USD 35.67 Billion
Market Size (2035) USD 73.29 Billion
Fastest Growing Segment Sports Non-Protein Products (by Product Type); Plant-Based (by Source); Online Retail Stores (by Channel)
Companies Profiled 10 (minimum)
Valuation Currency USD Billion


FAQs

How does third-party certification (NSF, Informed Sport) influence brand selection in the Sports Nutrition Market?
Certified brands command 15–20% retail price premiums and see higher repeat-purchase rates. Certification reduces perceived contamination risk, which is decisive for competitive athletes subject to anti-doping testing [10].
What role do private-label products play in reshaping the Sports Nutrition Market?
Retailers like Costco and Amazon Basics now offer private-label protein at 30–40% discounts to branded equivalents. This pressures mid-tier brands on margin while expanding category accessibility to price-sensitive consumers [3].
How are regulatory differences between the U.S. and EU affecting cross-border Sports Nutrition Market strategies?
Dual-registration costs add 8–12% to compliance budgets for multinational brands. Companies increasingly maintain separate formulations rather than pursuing single global SKUs [9].
What is the outlook for ready-to-drink formats within the Sports Nutrition Market?
RTD protein beverages are the fastest-growing format sub-segment, driven by convenience-store distribution. They attract non-traditional supplement consumers who avoid powder preparation [19].
How do subscription models compare to one-time purchases in customer lifetime value for the Sports Nutrition Market?
Subscribers deliver 3–4× higher lifetime value and exhibit 60–70% lower churn than one-time buyers. Subscription data also improves demand forecasting accuracy for manufacturers [3].
Which emerging ingredient categories pose disruption potential in the Sports Nutrition Market?
Adaptogens, nootropics, and postbiotics are gaining clinical validation and consumer interest. Brands integrating these into performance stacks can differentiate beyond commodity protein [7].
How is the Sports Nutrition Market addressing sustainability concerns in packaging and sourcing?
Leading brands are transitioning to PCR plastics and refillable pouch formats. Sustainably certified products earn measurable shelf-placement advantages with major retailers [16].    
Author
Author
Author Profile
Pradeep Nandi LinkedIn
Senior Research Analyst
I have a bachelor's degree in mechanical engineering and an MBA. I have more than two years of expertise in the retail, food, and beverage, chemical, and material industries, and hence have developed a sound cross-domain expertise. A firm believer in lifelong learning and sharing of knowledge. Having a proclivity for hatching ideas and trying to absorb as much information as possible in a short amount of time. Introducing corporates to the data and insight, which enables them to move from probability to possibility, has been my key areas of interest. 

Research Approach


Secondary Research

The secondary research process involved comprehensive analysis of regulatory databases, peer-reviewed sports science journals, nutrition publications, and authoritative health organizations. Key sources included the US Food & Drug Administration (FDA), European Food Safety Authority (EFSA), Food Standards Australia New Zealand (FSANZ), Health Canada, International Society of Sports Nutrition (ISSN), European Specialist Sports Nutrition Alliance (ESSNA), Council for Responsible Nutrition (CRN), American College of Sports Medicine (ACSM), International Olympic Committee (IOC) Nutrition Commission, National Collegiate Athletic Association (NCAA) Sports Science Institute, World Health Organization (WHO) Physical Activity Database, National Institutes of Health (NIH) Office of Dietary Supplements, National Center for Biotechnology Information (NCBI/PubMed), CDC National Health and Nutrition Examination Survey (NHANES), Eurostat Consumer Goods Database, and national food regulatory authority reports from key markets.

GRAS approval data, clinical efficacy studies, demographic fitness trends, consumption statistics, and competitive landscape analysis for protein supplements, vitamin/mineral formulations, energy and endurance goods, and meal replacement technologies were all gathered from these sources.


Primary Research

To gather both qualitative and quantitative insights, supply-side and demand-side stakeholders were interviewed during the primary research process. CEOs, VPs of product development, heads of regulatory affairs, and commercial directors from sports nutrition producers, contract manufacturers, and ingredient suppliers were examples of supply-side sources. Sports dietitians, strength and conditioning instructors, gym owners, procurement leaders from fitness and health clubs, sports academies, and specialized retail buyers were examples of demand-side suppliers. Market segmentation was validated, product pipeline timelines were verified, and information on pricing strategies, distribution dynamics, and consumer adoption trends was obtained through primary research.

Primary Respondent Breakdown:

By Designation: C-level Primaries (32%), Director Level (30%), Others (38%)

By Region: North America (32%), Europe (30%), Asia-Pacific (28%), Rest of World (10%)


Market Size Estimation

Revenue mapping and consumption volume analysis were used to get the global market valuation. The following were part of the methodology:

Finding more than forty-five important firms in Latin America, Asia-Pacific, Europe, and North America

Product mapping for meal replacements, vitamins and minerals, protein supplements, and energy and endurance goods

Examination of annual sales for sports nutrition portfolios, both reported and estimated

coverage of producers who will account for 70–75% of the world market in 2024

Extrapolation to get segment-specific valuations utilizing top-down (manufacturer revenue validation) and bottom-up (consumption volume × ASP by nation) methods

Download Free Sample

Kindly complete the form below to receive a free sample of this Report

Download PDF ×

We do not share your information with anyone. However, we may send you emails based on your report interest from time to time. You may contact us at any time to opt-out.
















