• Cat-intel
  • MedIntelliX
  • Resources
  • About Us
  • Hero Background
    English
    Chinese
    French
    Japanese
    Korean
    German
    Spanish

    Formic Acid Market Analysis

    ID: MRFR/CnM/0626-CR
    109 Pages
    Chitranshi Jaiswal
    February 2021

    Formic Acid Market Research Report Information By Production Method (Oxalic Acid, Carbonylation of Methanol), By Application (Rubber, Leather Production, Cleaning Agent, Finishing Textile, Preservatives, Dyeing, Animal Feed, Others), And By Region (North America, Europe, Asia-Pacific, And Rest Of The World) – Market Forecast Till 2035

    Share:
    Download PDF ×

    We do not share your information with anyone. However, we may send you emails based on your report interest from time to time. You may contact us at any time to opt-out.

    Formic Acid Market Infographic
    Purchase Options

    Market Analysis

    In-depth Analysis of Formic Acid Market Industry Landscape

    Leading companies in the market are concentrating on various strategies like mergers, acquisitions, expansions, collaborations, and new production development to sustain their market presence. For instance, BASF inaugurated a new formic acid production facility in Geismar, Louisiana, boasting an annual production capacity of 50,000 tons. This move allows the company to meet the demand in both North and South American markets. In 2013, Taminco Corp. entered into an agreement to acquire the formic acid business of Kemira Oyj, focusing on enhancing sales in niche business segments like feed and airport runway deicing. Key players are actively influencing market share, with China holding the majority at 60%, followed by Germany.

    This dominance is attributed to the increasing number of patent registrations, such as Perstorp Ab's 'Apparatus for the production of formic acid' and BASF Aktiengesellschaft's patented preparation of formic acid. These developments by major players are creating opportunities across the value chain, benefitting manufacturers to suppliers. The dynamic market landscape reflects the industry's continuous growth and innovation.

    To maintain a competitive edge, companies are investing in cutting-edge technologies and expanding their global footprint. These strategic moves not only ensure market stability but also contribute to the overall development of the formic acid industry. With a focus on market expansion and technological advancements, major players are actively shaping the future of the formic acid market. As the formic acid market continues to evolve, collaborations and partnerships are becoming integral for industry leaders. Companies are exploring synergies that allow them to leverage each other's strengths and create a more robust market presence. These collaborations not only enhance research and development capabilities but also contribute to the overall growth and sustainability of the formic acid market.

    In conclusion, the formic acid market is witnessing significant developments driven by key players adopting diverse strategies. Whether through mergers, expansions, or novel production facilities, major companies are actively shaping the formic acid landscape. The increasing number of patents and strategic alliances indicate a thriving market with ample opportunities across the value chain, benefiting all stakeholders from manufacturers to suppliers.

    Author
    Chitranshi Jaiswal
    Research Analyst Level I

    In her 3 years of experience in the market research field, she has handled critical cross-domain projects. She has an in-depth knowledge of market estimation & analysis, problem-solving, primary as well as secondary research, and team management.She holds an engineering degree and is an MBA professional from a well-known university, capable of evaluating the market and competitive conditions. An exceptional strategist with excellent communication skills and a passion for delivering cutting-edge & practical insights for the market. Proficient in multi-tasking, and can successfully deal with competing demands, while maintaining complete confidentiality. Generated business through active client and project development, networking, and high-quality responses. Her knowledge and skills have helped in making solid business decisions, securing funding from investors, and avoiding business failures.

    Leave a Comment

    FAQs

    How much is the Formic Acid market?

    Formic Acid Market was valued at USD 2.29 Billion in 2024

    What is the growth rate of the Formic Acid market?

    Formic Acid Market is projected to register a CAGR of 9.53% from 2025-2035

    Which region held the largest market share in the Formic Acid market?

    Asia Pacific had the largest share of the Formic Acid Market.

    Who are the key players in the Formic Acid market?

    The key players in the market are BASF SE, Perstorp, Eastman Chemical Company, Luxi Chemical Group Co. Ltd, Anhui Asahi Kasei Chemical, Feicheng Acid Chemical, Gujarat Narmada Valley Fertilizers & Chemicals Limited, Chongqing Chuandong Chemical Co, Perstorp.

    Which Production Method led the market of Formic Acid?

    Formic Acid Market size was valued at USD 2.29 Billion in 2024

    Which Application had the largest market share in the market?

    Animal Feed had the largest share in the global market for Formic Acid.

    Market Summary

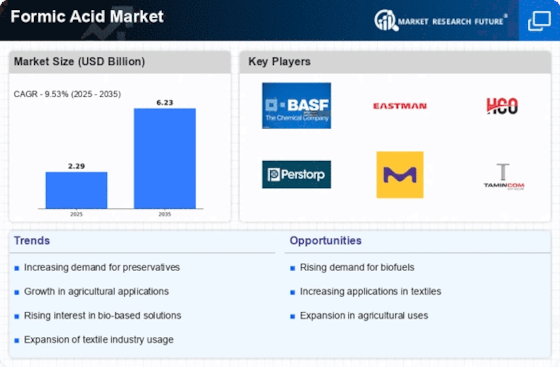
    As per Market Research Future Analysis, the Global Formic Acid Market was valued at USD 2.29 Billion in 2024 and is projected to reach USD 6.23 Billion by 2035, growing at a CAGR of 9.53% from 2025 to 2035. Formic acid, a colorless and corrosive organic acid, is widely used in agriculture, textiles, leather, and rubber manufacturing. Its demand is driven by its applications as a preservative and antibacterial agent in animal feed, particularly in the dairy sector. The Asia-Pacific region is the largest market, with China being the top producer and consumer, fueled by rising demand for animal feed additives and industrial applications.

    Key Market Trends & Highlights

    The market is witnessing significant growth due to various factors.

    • Formic Acid Market Size in 2024: USD 2.29 Billion. Projected Market Size by 2035: USD 6.23 Billion. CAGR from 2025 to 2035: 9.53%. Asia-Pacific is the largest and fastest-growing market.

    Market Size & Forecast

    2024 Market Size USD 2.29 Billion
    2035 Market Size USD 6.23 Billion
    CAGR (2024-2035) 9.53%
    Largest Regional Market Asia-Pacific.

    Major Players

    <p>Key players include BASF SE, Eastman Chemical Company, Luxi Chemical Group Co. Ltd, Anhui Asahi Kasei Chemical, and Perstorp.</p>

    Market Trends

    Rising Demand for Preservatives from Agricultural Sectors to Drive Market Growth

    The market is anticipated to see exponential development due to the steadily rising demand for formic acid, a preservative. Formic acid is also employed as an anti-bacterial agent, which benefits animal feedstock without degrading its nutritional content and raises demand from the dairy sector. Its acid property will boost the expansion of the market. The use of this acid in the chemical and industrial sectors will also contribute to the market's growth.

    <p>The Global Formic Acid Market is poised for growth, driven by increasing demand in various applications such as agriculture and textiles, which suggests a robust trajectory for the industry.</p>

    U.S. Geological Survey

    Formic Acid Market Market Drivers

    Growth in Leather Processing

    The leather industry significantly contributes to the Global Formic Acid Market Industry, utilizing formic acid in the tanning process. This chemical aids in the preservation and treatment of hides, enhancing their durability and quality. As the global demand for leather products continues to expand, particularly in emerging markets, the consumption of formic acid is expected to rise correspondingly. The market's growth trajectory indicates a potential increase to 6.06 USD Billion by 2035, driven by the leather sector's ongoing evolution and the need for high-quality materials.

    Rising Demand in Agriculture

    The Global Formic Acid Market Industry experiences a notable surge in demand from the agricultural sector, primarily due to its application as a preservative and feed additive. Formic acid enhances the nutritional value of animal feed, which is increasingly vital as global meat consumption rises. In 2024, the market is projected to reach 2.29 USD Billion, reflecting the growing reliance on chemical solutions in agriculture. Additionally, the increasing focus on sustainable farming practices may further bolster the demand for formic acid, as it is considered a more environmentally friendly alternative to traditional preservatives.

    Increasing Use in Textile Industry

    Formic acid plays a crucial role in the textile industry, particularly in dyeing and finishing processes. The Global Formic Acid Market Industry benefits from the rising demand for synthetic fibers, which often require formic acid for effective processing. As fashion trends evolve and the global population grows, the textile sector is likely to expand, thereby increasing the need for formic acid. This trend suggests a robust growth rate, with a projected CAGR of 9.25% from 2025 to 2035, highlighting the chemical's integral role in modern textile manufacturing.

    Advancements in Chemical Manufacturing

    The Global Formic Acid Market Industry is poised for growth due to advancements in chemical manufacturing processes. Innovations in production techniques, such as more efficient synthesis methods, are likely to reduce costs and enhance the quality of formic acid. As industries seek to optimize their supply chains and improve product offerings, the demand for high-purity formic acid is expected to rise. This trend may lead to increased market penetration and expansion, further solidifying formic acid's position in various applications across multiple sectors.

    Regulatory Support for Sustainable Chemicals

    Regulatory frameworks increasingly favor the use of sustainable chemicals, positively impacting the Global Formic Acid Market Industry. Governments worldwide are implementing policies that promote environmentally friendly alternatives, encouraging industries to adopt formic acid as a safer option. This regulatory support is likely to drive demand, as companies seek to comply with stringent environmental standards. The market's growth potential is evident, with projections indicating a significant increase in value as industries transition towards greener practices, aligning with global sustainability goals.

    Market Segment Insights

    Formic Acid Production Method Insights

    <p>The market segmentation, based on Production Method, includes Oxalic Acid and Carbonylation of Methanol. The Carbonylation of the Methanol segment may dominate the market. In this process, carbon monoxide and methanol are reacted in the presence of a catalyst to produce formic acid. This method offers several advantages, including higher yield, lower production costs, and more environmentally friendly compared to traditional methods of formic acid production, such as oxidation of formaldehyde.</p>

    Formic Acid Application Insights

    <p>Based on Application, the global market segmentation includes Rubber, Leather Production, Cleaning Agent, Finishing Textiles, Preservatives, Dyeing, Animal Feed, and Others. The Animal Feed application is holding the largest and fastest market. The use of formic acid in animal feed has been increasing due to the growing demand for meat and other animal products, particularly in developing countries. This has led to a greater focus on animal health and nutrition, which has increased the demand for feed additives such as formic acid.</p>

    <p>Figure 2: &nbsp;Formic Acid Market, by Production Method, 2022 &amp; 2030 (USD Billion)</p>

    <p>Source: Secondary Research, Primary Research, Market Research Future Database, and Analyst Review</p>

    Get more detailed insights about Formic Acid Market Research Report- Forecast to 2035

    Regional Insights

    By region, the study provides market insights into North America, Europe, Asia-Pacific, and the Rest of the World. Asia Pacific is currently the largest and fastest-growing market for formic acid. The region accounts for a significant share of the market, driven by factors such as increasing demand for animal feed additives, growth in the leather and textile industries, and rising demand for formic acid in various other applications. China is the largest producer and consumer of formic acid globally, accounting for a significant share of the Asia-Pacific market.

    The country's large and growing population, coupled with increasing demand for meat and other animal products, is driving the growth of the animal feed industry and, in turn, the demand for formic acid as a preservative and antibacterial agent. Other countries in the region, such as India, Japan, and South Korea, are also experiencing significant growth in the market, driven by factors such as increasing industrialization and the growing demand for sustainable and environmentally friendly products.

    Figure 3:  FORMIC ACID MARKET SHARE BY REGION 2022 (%)

    FORMIC ACID MARKET SHARE BY REGION

    Source: Secondary Research, Primary Research, Market Research Future Database, and Analyst Review

    The demand for formic acid in other regions, such as North America and Europe, is also increasing but at a slower pace compared to the Asia Pacific. However, the development of new applications and the growing trend towards using natural and bio-based products is expected to drive the growth of the formic acid market in these regions.

    Key Players and Competitive Insights

    The major market players are investing a lot of money in R&D to expand their product lines, which will spur further market growth. With significant market development like new product releases, contractual agreements, mergers and acquisitions, increased investments, and collaboration with other organizations, market participants are also undertaking various strategic activities to expand their global presence. To grow and thrive in a market climate that is becoming more competitive and growing, competitors in the Formic Acid industry must offer affordable products.

    Manufacturing locally to cut operating costs is one of the main business tactics manufacturers use in the global Formic Acid industry to benefit customers and expand the market sector. Major market players, including BASF SE, Perstorp, Eastman Chemical Company, Luxi Chemical Group Co Ltd, Anhui Asahi Kasei Chemical, and others, are attempting to increase market demand by funding R&D initiatives.

    BASF produces and distributes intermediates, petrochemicals, performance materials, monomers, performance chemicals, dispersions and pigments, catalysts, coatings, and care chemicals. The conducts its operations through six business segments: Nutrition and Care, Chemicals, Industrial Solutions, Materials, Surface Technologies, and Agricultural Solutions. The company serves electronics, transportation, construction, energy and resources, consumer goods, health and nutrition, and agriculture industries.

    Luxi Chemical Group is a chemical and fertilizer manufacturing and distribution corporation. Coal, salt, fluoro silicone, polycarbonate, caprolactam, hydrogen peroxide, polyols, and other materials.

    Key Companies in the Formic Acid Market market include

    Industry Developments

    In May 2023, scientists at the Indian Institute of Technology (IIT) Guwahati, innovated a catalyst that can produce hydrogen gas for wood alcohol, without the production of carbon dioxide. With the environmentally safe process, it also produces formic acid which can be useful for various end users in industrial chemicals.

    In July 2022, biotechnology company Ingenza stated that the company has formed a strategic partnership with Johnson Matthey to form a formic acid from the various industrial carbon dioxide emission for the use of several industries like pharmaceuticals and agriculture and as future prospects for the feedstock for bioprocess.

    March 2021: BASF SE announced an increase in formic acid prices in North America for all grades, which would be USD 0.05 per pound.

    Future Outlook

    Formic Acid Market Future Outlook

    <p>The Global Formic Acid Market is projected to grow at a 9.53% CAGR from 2025 to 2035, driven by increasing demand in agriculture, textiles, and pharmaceuticals.</p>

    New opportunities lie in:

    • <p>Expand production capabilities to meet rising demand in agricultural applications. Invest in R&amp;D for sustainable production methods to enhance market competitiveness. Develop strategic partnerships with key industries to leverage formic acid's versatility.</p>

    <p>By 2035, the Global Formic Acid Market is expected to achieve substantial growth, reflecting evolving industrial needs.</p>

    Market Segmentation

    Formic Acid Application Outlook

    • Rubber
    • Leather Production
    • Cleaning Agent
    • Finishing Textile
    • Preservatives
    • Dyeing
    • Animal Feed
    • Others
    • North America US Canada
    • US
    • Canada
    • Europe Germany France UK Italy Spain Rest of Europe
    • Germany
    • France
    • UK
    • Italy
    • Spain
    • Rest of Europe
    • Asia-Pacific China Japan India Australia South Korea Australia Rest of Asia-Pacific
    • China
    • Japan
    • India
    • Australia
    • South Korea
    • Rest of Asia-Pacific
    • Rest of the World Middle East Africa Latin America
    • Middle East
    • Africa
    • Latin America

    Formic Acid Production Method Outlook

    • Oxalic Acid
    • Carbonylation of Methanol

    Report Scope

    Attribute/MetricDetails
    Market Size 2024USD 2.29 Billion
    Market Size 20356.23 (Value (USD Million))
    Compound Annual Growth Rate (CAGR)9.53% (2025 - 2035)
    Base Year2024
    Market Forecast Period2025 - 2035
    Historical Data2018 & 2022
    Market Forecast UnitsValue (USD Million)
    Report CoverageRevenue Forecast, Market Competitive Landscape, Growth Factors, and Trends
    Segments CoveredProduction Method, Application, and Region
    Geographies CoveredNorth America, Europe, Asia Pacific, and Rest of the World
    Countries CoveredThe U.S, Canada, Germany, France, UK, Italy, Spain, China, Japan, India, Australia, South Korea, and Brazil
    Key Companies ProfiledBASF SE, Perstorp, Eastman Chemical Company, Luxi Chemical Group Co. Ltd, Anhui Asahi Kasei Chemical, Feicheng Acid Chemical, Gujarat Narmada Valley Fertilizers & Chemicals Limited, Chongqing Chuandong Chemical Co, Perstorp
    Key Market Opportunities·         Growing Awareness of the Sustainability Factor of Formic Acid to Improve Application
    Key Market Dynamics·         Growing Applications and Superior Properties of Formic Acid to Fuel Market Growth
    Market Size 20252.51 (Value (USD Million))

    FAQs

    How much is the Formic Acid market?

    Formic Acid Market was valued at USD 2.29 Billion in 2024

    What is the growth rate of the Formic Acid market?

    Formic Acid Market is projected to register a CAGR of 9.53% from 2025-2035

    Which region held the largest market share in the Formic Acid market?

    Asia Pacific had the largest share of the Formic Acid Market.

    Who are the key players in the Formic Acid market?

    The key players in the market are BASF SE, Perstorp, Eastman Chemical Company, Luxi Chemical Group Co. Ltd, Anhui Asahi Kasei Chemical, Feicheng Acid Chemical, Gujarat Narmada Valley Fertilizers &amp; Chemicals Limited, Chongqing Chuandong Chemical Co, Perstorp.

    Which Production Method led the market of Formic Acid?

    Formic Acid Market size was valued at USD 2.29 Billion in 2024

    Which Application had the largest market share in the market?

    Animal Feed had the largest share in the global market for Formic Acid.

    1. SECTION I: EXECUTIVE SUMMARY AND KEY HIGHLIGHTS
      1. | 1.1 EXECUTIVE SUMMARY
      2. | | 1.1.1 Market Overview
      3. | | 1.1.2 Key Findings
      4. | | 1.1.3 Market Segmentation
      5. | | 1.1.4 Competitive Landscape
      6. | | 1.1.5 Challenges and Opportunities
      7. | | 1.1.6 Future Outlook
    2. SECTION II: SCOPING, METHODOLOGY AND MARKET STRUCTURE
      1. | 2.1 MARKET INTRODUCTION
      2. | | 2.1.1 Definition
      3. | | 2.1.2 Scope of the study
      4. | | | 2.1.2.1 Research Objective
      5. | | | 2.1.2.2 Assumption
      6. | | | 2.1.2.3 Limitations
      7. | 2.2 RESEARCH METHODOLOGY
      8. | | 2.2.1 Overview
      9. | | 2.2.2 Data Mining
      10. | | 2.2.3 Secondary Research
      11. | | 2.2.4 Primary Research
      12. | | | 2.2.4.1 Primary Interviews and Information Gathering Process
      13. | | | 2.2.4.2 Breakdown of Primary Respondents
      14. | | 2.2.5 Forecasting Model
      15. | | 2.2.6 Market Size Estimation
      16. | | | 2.2.6.1 Bottom-Up Approach
      17. | | | 2.2.6.2 Top-Down Approach
      18. | | 2.2.7 Data Triangulation
      19. | | 2.2.8 Validation
    3. SECTION III: QUALITATIVE ANALYSIS
      1. | 3.1 MARKET DYNAMICS
      2. | | 3.1.1 Overview
      3. | | 3.1.2 Drivers
      4. | | 3.1.3 Restraints
      5. | | 3.1.4 Opportunities
      6. | 3.2 MARKET FACTOR ANALYSIS
      7. | | 3.2.1 Value chain Analysis
      8. | | 3.2.2 Porter's Five Forces Analysis
      9. | | | 3.2.2.1 Bargaining Power of Suppliers
      10. | | | 3.2.2.2 Bargaining Power of Buyers
      11. | | | 3.2.2.3 Threat of New Entrants
      12. | | | 3.2.2.4 Threat of Substitutes
      13. | | | 3.2.2.5 Intensity of Rivalry
      14. | | 3.2.3 COVID-19 Impact Analysis
      15. | | | 3.2.3.1 Market Impact Analysis
      16. | | | 3.2.3.2 Regional Impact
      17. | | | 3.2.3.3 Opportunity and Threat Analysis
    4. SECTION IV: QUANTITATIVE ANALYSIS
      1. | 4.1 Chemicals and Materials, BY Production Method (USD Billion)
      2. | | 4.1.1 Oxalic Acid
      3. | | 4.1.2 Carbonylation of Methanol
      4. | 4.2 Chemicals and Materials, BY Application (USD Billion)
      5. | | 4.2.1 Rubber
      6. | | 4.2.2 Leather Production
      7. | | 4.2.3 Cleaning Agent
      8. | | 4.2.4 Finishing Textile
      9. | | 4.2.5 Preservatives
      10. | | 4.2.6 Dyeing
      11. | | 4.2.7 Animal Feed
      12. | | 4.2.8 Others
      13. | 4.3 Chemicals and Materials, BY Region (USD Billion)
      14. | | 4.3.1 North America
      15. | | | 4.3.1.1 US
      16. | | | 4.3.1.2 Canada
      17. | | 4.3.2 Europe
      18. | | | 4.3.2.1 Germany
      19. | | | 4.3.2.2 UK
      20. | | | 4.3.2.3 France
      21. | | | 4.3.2.4 Russia
      22. | | | 4.3.2.5 Italy
      23. | | | 4.3.2.6 Spain
      24. | | | 4.3.2.7 Rest of Europe
      25. | | 4.3.3 APAC
      26. | | | 4.3.3.1 China
      27. | | | 4.3.3.2 India
      28. | | | 4.3.3.3 Japan
      29. | | | 4.3.3.4 South Korea
      30. | | | 4.3.3.5 Malaysia
      31. | | | 4.3.3.6 Thailand
      32. | | | 4.3.3.7 Indonesia
      33. | | | 4.3.3.8 Rest of APAC
      34. | | 4.3.4 South America
      35. | | | 4.3.4.1 Brazil
      36. | | | 4.3.4.2 Mexico
      37. | | | 4.3.4.3 Argentina
      38. | | | 4.3.4.4 Rest of South America
      39. | | 4.3.5 MEA
      40. | | | 4.3.5.1 GCC Countries
      41. | | | 4.3.5.2 South Africa
      42. | | | 4.3.5.3 Rest of MEA
    5. SECTION V: COMPETITIVE ANALYSIS
      1. | 5.1 Competitive Landscape
      2. | | 5.1.1 Overview
      3. | | 5.1.2 Competitive Analysis
      4. | | 5.1.3 Market share Analysis
      5. | | 5.1.4 Major Growth Strategy in the Chemicals and Materials
      6. | | 5.1.5 Competitive Benchmarking
      7. | | 5.1.6 Leading Players in Terms of Number of Developments in the Chemicals and Materials
      8. | | 5.1.7 Key developments and growth strategies
      9. | | | 5.1.7.1 New Product Launch/Service Deployment
      10. | | | 5.1.7.2 Merger & Acquisitions
      11. | | | 5.1.7.3 Joint Ventures
      12. | | 5.1.8 Major Players Financial Matrix
      13. | | | 5.1.8.1 Sales and Operating Income
      14. | | | 5.1.8.2 Major Players R&D Expenditure. 2023
      15. | 5.2 Company Profiles
      16. | | 5.2.1 BASF SE (DE)
      17. | | | 5.2.1.1 Financial Overview
      18. | | | 5.2.1.2 Products Offered
      19. | | | 5.2.1.3 Key Developments
      20. | | | 5.2.1.4 SWOT Analysis
      21. | | | 5.2.1.5 Key Strategies
      22. | | 5.2.2 Eastman Chemical Company (US)
      23. | | | 5.2.2.1 Financial Overview
      24. | | | 5.2.2.2 Products Offered
      25. | | | 5.2.2.3 Key Developments
      26. | | | 5.2.2.4 SWOT Analysis
      27. | | | 5.2.2.5 Key Strategies
      28. | | 5.2.3 HCO (Hubei) Chemical Co., Ltd. (CN)
      29. | | | 5.2.3.1 Financial Overview
      30. | | | 5.2.3.2 Products Offered
      31. | | | 5.2.3.3 Key Developments
      32. | | | 5.2.3.4 SWOT Analysis
      33. | | | 5.2.3.5 Key Strategies
      34. | | 5.2.4 Perstorp Holding AB (SE)
      35. | | | 5.2.4.1 Financial Overview
      36. | | | 5.2.4.2 Products Offered
      37. | | | 5.2.4.3 Key Developments
      38. | | | 5.2.4.4 SWOT Analysis
      39. | | | 5.2.4.5 Key Strategies
      40. | | 5.2.5 Merck KGaA (DE)
      41. | | | 5.2.5.1 Financial Overview
      42. | | | 5.2.5.2 Products Offered
      43. | | | 5.2.5.3 Key Developments
      44. | | | 5.2.5.4 SWOT Analysis
      45. | | | 5.2.5.5 Key Strategies
      46. | | 5.2.6 Taminco (BE)
      47. | | | 5.2.6.1 Financial Overview
      48. | | | 5.2.6.2 Products Offered
      49. | | | 5.2.6.3 Key Developments
      50. | | | 5.2.6.4 SWOT Analysis
      51. | | | 5.2.6.5 Key Strategies
      52. | | 5.2.7 Shandong Jinling Chemical Co., Ltd. (CN)
      53. | | | 5.2.7.1 Financial Overview
      54. | | | 5.2.7.2 Products Offered
      55. | | | 5.2.7.3 Key Developments
      56. | | | 5.2.7.4 SWOT Analysis
      57. | | | 5.2.7.5 Key Strategies
      58. | | 5.2.8 Ferro Corporation (US)
      59. | | | 5.2.8.1 Financial Overview
      60. | | | 5.2.8.2 Products Offered
      61. | | | 5.2.8.3 Key Developments
      62. | | | 5.2.8.4 SWOT Analysis
      63. | | | 5.2.8.5 Key Strategies
      64. | 5.3 Appendix
      65. | | 5.3.1 References
      66. | | 5.3.2 Related Reports
    6. LIST OF FIGURES
      1. | 6.1 MARKET SYNOPSIS
      2. | 6.2 NORTH AMERICA MARKET ANALYSIS
      3. | 6.3 US MARKET ANALYSIS BY PRODUCTION METHOD
      4. | 6.4 US MARKET ANALYSIS BY APPLICATION
      5. | 6.5 CANADA MARKET ANALYSIS BY PRODUCTION METHOD
      6. | 6.6 CANADA MARKET ANALYSIS BY APPLICATION
      7. | 6.7 EUROPE MARKET ANALYSIS
      8. | 6.8 GERMANY MARKET ANALYSIS BY PRODUCTION METHOD
      9. | 6.9 GERMANY MARKET ANALYSIS BY APPLICATION
      10. | 6.10 UK MARKET ANALYSIS BY PRODUCTION METHOD
      11. | 6.11 UK MARKET ANALYSIS BY APPLICATION
      12. | 6.12 FRANCE MARKET ANALYSIS BY PRODUCTION METHOD
      13. | 6.13 FRANCE MARKET ANALYSIS BY APPLICATION
      14. | 6.14 RUSSIA MARKET ANALYSIS BY PRODUCTION METHOD
      15. | 6.15 RUSSIA MARKET ANALYSIS BY APPLICATION
      16. | 6.16 ITALY MARKET ANALYSIS BY PRODUCTION METHOD
      17. | 6.17 ITALY MARKET ANALYSIS BY APPLICATION
      18. | 6.18 SPAIN MARKET ANALYSIS BY PRODUCTION METHOD
      19. | 6.19 SPAIN MARKET ANALYSIS BY APPLICATION
      20. | 6.20 REST OF EUROPE MARKET ANALYSIS BY PRODUCTION METHOD
      21. | 6.21 REST OF EUROPE MARKET ANALYSIS BY APPLICATION
      22. | 6.22 APAC MARKET ANALYSIS
      23. | 6.23 CHINA MARKET ANALYSIS BY PRODUCTION METHOD
      24. | 6.24 CHINA MARKET ANALYSIS BY APPLICATION
      25. | 6.25 INDIA MARKET ANALYSIS BY PRODUCTION METHOD
      26. | 6.26 INDIA MARKET ANALYSIS BY APPLICATION
      27. | 6.27 JAPAN MARKET ANALYSIS BY PRODUCTION METHOD
      28. | 6.28 JAPAN MARKET ANALYSIS BY APPLICATION
      29. | 6.29 SOUTH KOREA MARKET ANALYSIS BY PRODUCTION METHOD
      30. | 6.30 SOUTH KOREA MARKET ANALYSIS BY APPLICATION
      31. | 6.31 MALAYSIA MARKET ANALYSIS BY PRODUCTION METHOD
      32. | 6.32 MALAYSIA MARKET ANALYSIS BY APPLICATION
      33. | 6.33 THAILAND MARKET ANALYSIS BY PRODUCTION METHOD
      34. | 6.34 THAILAND MARKET ANALYSIS BY APPLICATION
      35. | 6.35 INDONESIA MARKET ANALYSIS BY PRODUCTION METHOD
      36. | 6.36 INDONESIA MARKET ANALYSIS BY APPLICATION
      37. | 6.37 REST OF APAC MARKET ANALYSIS BY PRODUCTION METHOD
      38. | 6.38 REST OF APAC MARKET ANALYSIS BY APPLICATION
      39. | 6.39 SOUTH AMERICA MARKET ANALYSIS
      40. | 6.40 BRAZIL MARKET ANALYSIS BY PRODUCTION METHOD
      41. | 6.41 BRAZIL MARKET ANALYSIS BY APPLICATION
      42. | 6.42 MEXICO MARKET ANALYSIS BY PRODUCTION METHOD
      43. | 6.43 MEXICO MARKET ANALYSIS BY APPLICATION
      44. | 6.44 ARGENTINA MARKET ANALYSIS BY PRODUCTION METHOD
      45. | 6.45 ARGENTINA MARKET ANALYSIS BY APPLICATION
      46. | 6.46 REST OF SOUTH AMERICA MARKET ANALYSIS BY PRODUCTION METHOD
      47. | 6.47 REST OF SOUTH AMERICA MARKET ANALYSIS BY APPLICATION
      48. | 6.48 MEA MARKET ANALYSIS
      49. | 6.49 GCC COUNTRIES MARKET ANALYSIS BY PRODUCTION METHOD
      50. | 6.50 GCC COUNTRIES MARKET ANALYSIS BY APPLICATION
      51. | 6.51 SOUTH AFRICA MARKET ANALYSIS BY PRODUCTION METHOD
      52. | 6.52 SOUTH AFRICA MARKET ANALYSIS BY APPLICATION
      53. | 6.53 REST OF MEA MARKET ANALYSIS BY PRODUCTION METHOD
      54. | 6.54 REST OF MEA MARKET ANALYSIS BY APPLICATION
      55. | 6.55 KEY BUYING CRITERIA OF CHEMICALS AND MATERIALS
      56. | 6.56 RESEARCH PROCESS OF MRFR
      57. | 6.57 DRO ANALYSIS OF CHEMICALS AND MATERIALS
      58. | 6.58 DRIVERS IMPACT ANALYSIS: CHEMICALS AND MATERIALS
      59. | 6.59 RESTRAINTS IMPACT ANALYSIS: CHEMICALS AND MATERIALS
      60. | 6.60 SUPPLY / VALUE CHAIN: CHEMICALS AND MATERIALS
      61. | 6.61 CHEMICALS AND MATERIALS, BY PRODUCTION METHOD, 2024 (% SHARE)
      62. | 6.62 CHEMICALS AND MATERIALS, BY PRODUCTION METHOD, 2024 TO 2035 (USD Billion)
      63. | 6.63 CHEMICALS AND MATERIALS, BY APPLICATION, 2024 (% SHARE)
      64. | 6.64 CHEMICALS AND MATERIALS, BY APPLICATION, 2024 TO 2035 (USD Billion)
      65. | 6.65 BENCHMARKING OF MAJOR COMPETITORS
    7. LIST OF TABLES
      1. | 7.1 LIST OF ASSUMPTIONS
      2. | | 7.1.1
      3. | 7.2 North America MARKET SIZE ESTIMATES; FORECAST
      4. | | 7.2.1 BY PRODUCTION METHOD, 2025-2035 (USD Billion)
      5. | | 7.2.2 BY APPLICATION, 2025-2035 (USD Billion)
      6. | 7.3 US MARKET SIZE ESTIMATES; FORECAST
      7. | | 7.3.1 BY PRODUCTION METHOD, 2025-2035 (USD Billion)
      8. | | 7.3.2 BY APPLICATION, 2025-2035 (USD Billion)
      9. | 7.4 Canada MARKET SIZE ESTIMATES; FORECAST
      10. | | 7.4.1 BY PRODUCTION METHOD, 2025-2035 (USD Billion)
      11. | | 7.4.2 BY APPLICATION, 2025-2035 (USD Billion)
      12. | 7.5 Europe MARKET SIZE ESTIMATES; FORECAST
      13. | | 7.5.1 BY PRODUCTION METHOD, 2025-2035 (USD Billion)
      14. | | 7.5.2 BY APPLICATION, 2025-2035 (USD Billion)
      15. | 7.6 Germany MARKET SIZE ESTIMATES; FORECAST
      16. | | 7.6.1 BY PRODUCTION METHOD, 2025-2035 (USD Billion)
      17. | | 7.6.2 BY APPLICATION, 2025-2035 (USD Billion)
      18. | 7.7 UK MARKET SIZE ESTIMATES; FORECAST
      19. | | 7.7.1 BY PRODUCTION METHOD, 2025-2035 (USD Billion)
      20. | | 7.7.2 BY APPLICATION, 2025-2035 (USD Billion)
      21. | 7.8 France MARKET SIZE ESTIMATES; FORECAST
      22. | | 7.8.1 BY PRODUCTION METHOD, 2025-2035 (USD Billion)
      23. | | 7.8.2 BY APPLICATION, 2025-2035 (USD Billion)
      24. | 7.9 Russia MARKET SIZE ESTIMATES; FORECAST
      25. | | 7.9.1 BY PRODUCTION METHOD, 2025-2035 (USD Billion)
      26. | | 7.9.2 BY APPLICATION, 2025-2035 (USD Billion)
      27. | 7.10 Italy MARKET SIZE ESTIMATES; FORECAST
      28. | | 7.10.1 BY PRODUCTION METHOD, 2025-2035 (USD Billion)
      29. | | 7.10.2 BY APPLICATION, 2025-2035 (USD Billion)
      30. | 7.11 Spain MARKET SIZE ESTIMATES; FORECAST
      31. | | 7.11.1 BY PRODUCTION METHOD, 2025-2035 (USD Billion)
      32. | | 7.11.2 BY APPLICATION, 2025-2035 (USD Billion)
      33. | 7.12 Rest of Europe MARKET SIZE ESTIMATES; FORECAST
      34. | | 7.12.1 BY PRODUCTION METHOD, 2025-2035 (USD Billion)
      35. | | 7.12.2 BY APPLICATION, 2025-2035 (USD Billion)
      36. | 7.13 APAC MARKET SIZE ESTIMATES; FORECAST
      37. | | 7.13.1 BY PRODUCTION METHOD, 2025-2035 (USD Billion)
      38. | | 7.13.2 BY APPLICATION, 2025-2035 (USD Billion)
      39. | 7.14 China MARKET SIZE ESTIMATES; FORECAST
      40. | | 7.14.1 BY PRODUCTION METHOD, 2025-2035 (USD Billion)
      41. | | 7.14.2 BY APPLICATION, 2025-2035 (USD Billion)
      42. | 7.15 India MARKET SIZE ESTIMATES; FORECAST
      43. | | 7.15.1 BY PRODUCTION METHOD, 2025-2035 (USD Billion)
      44. | | 7.15.2 BY APPLICATION, 2025-2035 (USD Billion)
      45. | 7.16 Japan MARKET SIZE ESTIMATES; FORECAST
      46. | | 7.16.1 BY PRODUCTION METHOD, 2025-2035 (USD Billion)
      47. | | 7.16.2 BY APPLICATION, 2025-2035 (USD Billion)
      48. | 7.17 South Korea MARKET SIZE ESTIMATES; FORECAST
      49. | | 7.17.1 BY PRODUCTION METHOD, 2025-2035 (USD Billion)
      50. | | 7.17.2 BY APPLICATION, 2025-2035 (USD Billion)
      51. | 7.18 Malaysia MARKET SIZE ESTIMATES; FORECAST
      52. | | 7.18.1 BY PRODUCTION METHOD, 2025-2035 (USD Billion)
      53. | | 7.18.2 BY APPLICATION, 2025-2035 (USD Billion)
      54. | 7.19 Thailand MARKET SIZE ESTIMATES; FORECAST
      55. | | 7.19.1 BY PRODUCTION METHOD, 2025-2035 (USD Billion)
      56. | | 7.19.2 BY APPLICATION, 2025-2035 (USD Billion)
      57. | 7.20 Indonesia MARKET SIZE ESTIMATES; FORECAST
      58. | | 7.20.1 BY PRODUCTION METHOD, 2025-2035 (USD Billion)
      59. | | 7.20.2 BY APPLICATION, 2025-2035 (USD Billion)
      60. | 7.21 Rest of APAC MARKET SIZE ESTIMATES; FORECAST
      61. | | 7.21.1 BY PRODUCTION METHOD, 2025-2035 (USD Billion)
      62. | | 7.21.2 BY APPLICATION, 2025-2035 (USD Billion)
      63. | 7.22 South America MARKET SIZE ESTIMATES; FORECAST
      64. | | 7.22.1 BY PRODUCTION METHOD, 2025-2035 (USD Billion)
      65. | | 7.22.2 BY APPLICATION, 2025-2035 (USD Billion)
      66. | 7.23 Brazil MARKET SIZE ESTIMATES; FORECAST
      67. | | 7.23.1 BY PRODUCTION METHOD, 2025-2035 (USD Billion)
      68. | | 7.23.2 BY APPLICATION, 2025-2035 (USD Billion)
      69. | 7.24 Mexico MARKET SIZE ESTIMATES; FORECAST
      70. | | 7.24.1 BY PRODUCTION METHOD, 2025-2035 (USD Billion)
      71. | | 7.24.2 BY APPLICATION, 2025-2035 (USD Billion)
      72. | 7.25 Argentina MARKET SIZE ESTIMATES; FORECAST
      73. | | 7.25.1 BY PRODUCTION METHOD, 2025-2035 (USD Billion)
      74. | | 7.25.2 BY APPLICATION, 2025-2035 (USD Billion)
      75. | 7.26 Rest of South America MARKET SIZE ESTIMATES; FORECAST
      76. | | 7.26.1 BY PRODUCTION METHOD, 2025-2035 (USD Billion)
      77. | | 7.26.2 BY APPLICATION, 2025-2035 (USD Billion)
      78. | 7.27 MEA MARKET SIZE ESTIMATES; FORECAST
      79. | | 7.27.1 BY PRODUCTION METHOD, 2025-2035 (USD Billion)
      80. | | 7.27.2 BY APPLICATION, 2025-2035 (USD Billion)
      81. | 7.28 GCC Countries MARKET SIZE ESTIMATES; FORECAST
      82. | | 7.28.1 BY PRODUCTION METHOD, 2025-2035 (USD Billion)
      83. | | 7.28.2 BY APPLICATION, 2025-2035 (USD Billion)
      84. | 7.29 South Africa MARKET SIZE ESTIMATES; FORECAST
      85. | | 7.29.1 BY PRODUCTION METHOD, 2025-2035 (USD Billion)
      86. | | 7.29.2 BY APPLICATION, 2025-2035 (USD Billion)
      87. | 7.30 Rest of MEA MARKET SIZE ESTIMATES; FORECAST
      88. | | 7.30.1 BY PRODUCTION METHOD, 2025-2035 (USD Billion)
      89. | | 7.30.2 BY APPLICATION, 2025-2035 (USD Billion)
      90. | 7.31 PRODUCT LAUNCH/PRODUCT DEVELOPMENT/APPROVAL
      91. | | 7.31.1
      92. | 7.32 ACQUISITION/PARTNERSHIP
      93. | | 7.32.1

    Formic Acid Market Segmentation

    Market Segmentation Overview

    • Detailed segmentation data will be available in the full report
    • Comprehensive analysis by multiple parameters
    • Regional and country-level breakdowns
    • Market size forecasts by segment
    Infographic

    Free Sample Request

    Kindly complete the form below to receive a free sample of this Report

    Get Free Sample

    Customer Strories

    “I am very pleased with how market segments have been defined in a relevant way for my purposes (such as "Portable Freezers & refrigerators" and "last-mile"). In general the report is well structured. Thanks very much for your efforts.”

    Victoria Milne

    Founder
    Case Study
    Chemicals and Materials

    Compare Licence

    ×
    Features License Type
    Single User Multiuser License Enterprise User
    Price $4,950 $5,950 $7,250
    Maximum User Access Limit 1 User Upto 10 Users Unrestricted Access Throughout the Organization
    Free Customization
    Direct Access to Analyst
    Deliverable Format
    Platform Access
    Discount on Next Purchase 10% 15% 15%
    Printable Versions