Formic Acid Market

Key Players: BASF SE, Perstorp Holding AB, Luxi Chemical Group, Gujarat Narmada Valley Fertilizers & Chemicals (GNFC), Rashtriya Chemicals and Fertilizers (RCF), Feicheng Acid Chemicals Co., Helm AG, Chongqing Chuandong Chemical Group

Formic Acid Market

Formic Acid Market Research Report Information By Production Method (Oxalic Acid, Carbonylation of Methanol), By Application (Rubber, Leather Production, Cleaning Agent, Finishing Textile, Preservatives, Dyeing, Animal Feed, Others), And By Region (North America, Europe, Asia-Pacific, And Rest Of The World) – Market Forecast Till 2035
ID: MRFR/CnM/0626-CR
109 Pages
Chitranshi Jaiswal
Last Updated: June 09, 2026
 

Formic Acid Market Summary

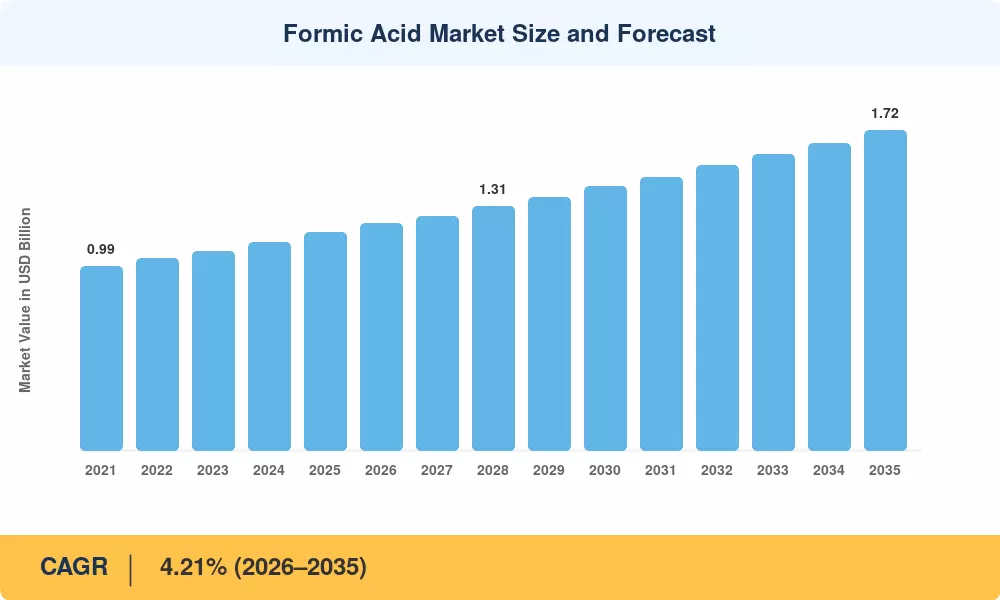
The global Formic Acid Market reached an estimated 1.17 million tons in 2025 and is projected to expand from 1.21 million tons in 2026 to 1.72 million tons by 2035, registering a CAGR of 4.21% during the forecast period. This growth trajectory is anchored in two structural catalysts: the accelerating global shift toward antibiotic-free livestock production—driven by the EU's 2022 ban on prophylactic antibiotic use in feed and similar regulatory pressure from the U.S. FDA's Veterinary Feed Directive—and the rising wave of investment in bio-based chemical intermediates as part of broader decarbonization mandates[2].

A transformation in production technology is reshaping the Formic Acid Market supply chain. Conventional methyl formate hydrolysis, which still accounts for the majority of global output, is increasingly complemented by electrochemical CO₂-to-formic acid conversion pathways. Pilot-scale projects in Germany and Japan have attracted over USD 320 million in combined public-private funding since 2023, signaling a medium-term shift in supply economics for specialty chemical compounds [3][4]. Bio-based production routes for feed preservatives and leather processing chemicals are expanding rapidly, with several European producers targeting carbon-neutral formic acid output by 2030.

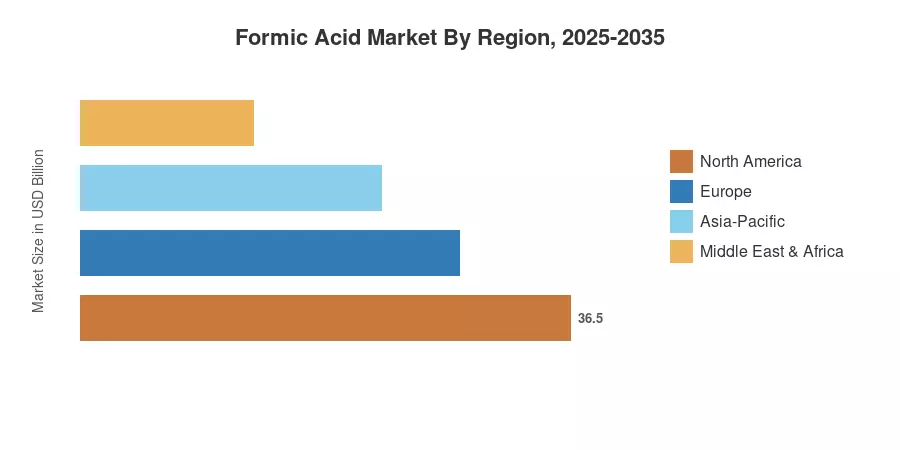
Asia-Pacific commands the dominant position in the Formic Acid Market, holding roughly 56.8% of global consumption in 2025, powered by China's expansive manufacturing base and India's growing demand for agricultural chemicals and rubber processing chemicals. The region is also the fastest-growing, advancing at a 4.89% CAGR through 2035. Europe remains the second-largest consuming region at approximately 21% share, where strict feed safety standards and leather processing chemicals regulations sustain steady demand. North America follows, driven by rising adoption of preservative chemicals and industrial organic acids in livestock and pharmaceutical applications [5][6].


Key Report Takeaways

• By Application

  • Animal feed & silage additives led with a 4.48% CAGR through 2035, driven by the global regulatory push to replace antibiotics with acid-based preservatives in livestock nutrition
  • Leather tanning accounted for the second-largest share of the Formic Acid Market in 2025, underpinned by expanding footwear production across South and Southeast Asia
  • Textile dyeing chemicals applications are gaining traction, particularly in pH-adjustment processes for synthetic fiber manufacturing

• By Production Method

  • Methyl formate hydrolysis held 62.4% of the Formic Acid Market share in 2025, reflecting its dominant position in large-scale industrial organic acids production
  • Bio-based pathways are projected to grow at 5.02% CAGR, the fastest among all production routes, as producers invest in lower-carbon chemical intermediates

• By Region

  • Asia-Pacific dominated the Formic Acid Market with 56.8% volume share in 2025
  • Europe is advancing at a 3.72% CAGR, supported by stringent EU regulations on feed preservatives and leather processing chemicals
  • North America's demand for preservative chemicals in animal nutrition is rising steadily


Formic Acid Market Size and Forecast (2021–2035)

MRFR's market sizing combines primary interviews with over 45 industry participants, trade data from UN Comtrade and national chemical industry associations, and proprietary demand modeling validated against company filings. Historical figures (2021–2024) reflect reported production and consumption data; the base year (2025) is estimated from H1 actuals extrapolated to full-year totals. Forecast values (2026–2035) apply MRFR's calibrated CAGR with adjustments for anticipated capacity additions and regulatory shifts.

Formic Acid Market Size and Forecast
Our Impact
Enabled $4.3B Revenue Impact for Fortune 500 and Leading Multinationals
Partnering with 2000+ Global Organizations Each Year
30K+ Citations by Top-Tier Firms in the Industry
 

Driver Impact Analysis

Driver ~% Impact on CAGR Geographic Relevance Impact Timeline
Antibiotic-free feed mandates +0.85% Global Short-term (≤2 yr)
Bio-based production investment +0.70% Europe, North America Medium-term (2–4 yr)
Leather & footwear production expansion +0.55% Asia-Pacific Medium-term (2–4 yr)
Electrochemical CO₂ conversion scale-up +0.40% Europe, Japan Long-term (≥4 yr)
Rubber processing demand growth +0.35% Asia-Pacific, South America Medium-term (2–4 yr)
Textile dyeing pH regulation needs +0.25% ASEAN, India Short-term (≤2 yr)
Pharmaceutical intermediate applications +0.20% North America, Europe Long-term (≥4 yr)


Antibiotic-Free Feed Mandates Accelerate Feed Preservatives Demand

The EU's Regulation 2019/6, which banned prophylactic use of antibiotics in animal feed effective January 2022, has catalyzed a structural shift toward organic acid-based feed preservatives across European livestock operations. Over 38% of EU poultry and swine producers have reformulated feed programs to incorporate formic acid-based additives, according to FEFAC's 2024 annual survey. The U.S. FDA's Veterinary Feed Directive has produced a parallel—though slower—migration in North American markets. This regulatory push is the single largest short-term driver for the Formic Acid Market, directly expanding demand for acid based preservatives in animal nutrition [2][9].

Bio-Based Production Investment Reshapes Supply Economics

Public and private investment in bio-based formic acid production surpassed USD 480 million globally between 2022 and 2025, according to European Chemical Industry Council (CEFIC) tracking data. Finland's Fortum and Germany's BASF have both announced pilot facilities targeting bio-based chemical intermediates, with commercial output expected by 2028. These facilities reduce lifecycle carbon emissions by 45–60% compared to conventional methyl formate hydrolysis, positioning bio-based formic acid as a preferred input for sustainability-conscious buyers of specialty chemical compounds [3][7].

Leather and Footwear Production Expansion in Asia-Pacific

Asia-Pacific's leather processing chemicals demand is growing at roughly 5.1% annually, driven by Vietnam, Bangladesh, and India—three countries that collectively accounted for over 42% of global footwear exports in 2024. Formic acid is critical in chrome-free tanning processes, which are expanding as European and North American fashion brands impose stricter supply-chain sustainability requirements. India's Council for Leather Exports reported a 7.2% increase in formic acid procurement by tanneries in FY2024-25, underscoring the Formic Acid Market growth trajectory in this segment [6][10].

Electrochemical CO₂ Conversion Pilots

Electrochemical conversion of CO₂ to formic acid has moved from laboratory curiosity to pilot-scale demonstration. Germany's Fraunhofer Institute and Japan's AIST have each operated continuous-flow reactors since 2023, achieving conversion efficiencies above 70%. If these processes reach commercial viability by 2030, they could supply up to 8% of global formic acid volumes at production costs competitive with methyl formate hydrolysis, fundamentally altering the supply landscape for industrial organic acids [4][13].


Restraints Impact Analysis

Restraint ~% Impact on CAGR Geographic Relevance Impact Timeline
Volatile methanol feedstock pricing –0.45% Global Short-term (≤2 yr)
Stringent chemical handling regulations –0.35% Europe, North America Medium-term (2–4 yr)
Substitution by propionic and acetic acid –0.30% North America, Europe Long-term (≥4 yr)
Environmental disposal constraints –0.20% Europe Medium-term (2–4 yr)
Concentrated supplier base risk –0.15% Global Short-term (≤2 yr)


Volatile Methanol Feedstock Pricing

Methanol is the primary feedstock for methyl formate hydrolysis, accounting for approximately 55–60% of variable production costs for formic acid. Global methanol spot prices fluctuated between USD 280 and USD 450 per ton during 2023–2025, driven by natural gas price volatility and Chinese coal-to-methanol capacity cycling. These swings directly compress producer margins and introduce pricing uncertainty that dampens downstream demand planning for preservative chemicals and leather processing chemicals alike [14][17].

Substitution Pressure from Alternative Organic Acids

Propionic acid and acetic acid compete directly with formic acid in feed preservatives and textile dyeing chemicals applications. Propionic acid's broader antimicrobial spectrum makes it preferred in certain silage preservation contexts, while acetic acid's lower cost per ton gives it an edge in price-sensitive rubber processing chemicals formulations. Although formic acid retains advantages in leather tanning and specific pharmaceutical chemical intermediates, this competitive overlap constrains pricing power and limits share gains in the Formic Acid Market[16].

Stringent Chemical Handling and REACH Compliance

Under REACH regulations, formic acid (concentration >90%) is classified as a corrosive substance requiring specialized storage, transport, and PPE protocols. Compliance costs for small and mid-sized distributors in Europe can exceed EUR 150,000 annually, creating barriers to entry and limiting the addressable customer base for specialty chemical compounds. These regulatory burdens are particularly acute for new entrants seeking to supply agricultural chemicals markets [11].


Formic Acid Market Opportunities

Carbon-Neutral Formic Acid as a Hydrogen Carrier

In fact, the promise of formic acid as a liquid organic hydrogen carrier (LOHC) is drawing major R&D interest. A liter of formic acid may yield ~53 grams of hydrogen by catalytic breakdown, making it a possibility for distributed hydrogen storage systems. The EU Hydrogen Strategy aims 10 million tons of renewable hydrogen till 2030, and formic acid based storage can replace 3–5% of that delivery infrastructure, a huge new demand channel for the Formic Acid Market [4][18].


Expansion of Antibiotic-Free Poultry in Emerging Markets

Brazil, India and Thailand are all tightening up laws on antibiotic use in poultry farming producing a new wave of demand for acid based preservatives. In 2024, Brazil’s MAPA announced draft guidance that proposes restrictions on growth-promoting antibiotics in broiler feed and may unlock an incremental 35,000-40,000 tons of annual formic acid demand from South America alone. This is a high-growth opportunity for feed preservatives suppliers targeting emerging agricultural chemicals markets [12][19].


Chrome-Free Leather Tanning Transition

Fashion giants including H&M, Kering and LVMH have promised to eradicate chrome tanning from their supply chains by 2030. Formic-acid based tanning techniques are the most prominent chrome-free option, producing leather of equal quality at a cost premium of 10–15%. The leather processing chemicals industry could see an increase in formic acid use of 20–25% in the coming decade [6][20].


Digital Supply Chain Optimization and Data Monetization

Chemical distributors are using AI-driven demand forecasting and IoT-powered inventory management solutions that lower working capital needs by 12–18%. Companies that include real-time consumption data from feed mills, tanneries and rubber processing facilities can provide subscription-based replenishment models, generating recurring income streams and enhancing customer retention. This digitalization trend is an opportunity of a new business model in the preservative chemicals value chain.


Pharmaceutical Intermediate Growth in North America

The U.S. Biosecure Act and reshoring incentives are driving domestic API manufacturing capacity additions, increasing demand for formic acid as a chemical intermediate in synthesis reactions. Over USD 2.8 billion in new pharmaceutical manufacturing investment was announced in the U.S. during 2024, and formic acid consumption in this segment is expected to grow at 4.7% CAGR through 2035 [9][22].


Formic Acid Market Future Outlook

Bio-Based and Circular Production Models

The next decade will see bio-based formic acid transition from niche to mainstream. CEFIC projects that bio-based routes will account for 15–20% of European output by 2032, up from less than 5% in 2025. Producers leveraging biomass gasification and enzymatic conversion are targeting cost parity with methyl formate hydrolysis by 2029, which would reshape competitive dynamics across the specialty chemical compounds landscape. The IEA's 2025 Industrial Decarbonization Roadmap identifies formic acid as one of twelve priority chemical intermediates for green transition support [3][7][18].

Hydrogen Economy Integration

Formic acid's role as a liquid organic hydrogen carrier is poised to create an entirely new demand vertical. IRENA estimates that distributed hydrogen storage could reach 4.5 million tons annually by 2035, and formic acid-based systems offer advantages in safety and energy density over compressed gas alternatives. Demonstration projects in the Netherlands and Japan are targeting commercial deployment by 2028, potentially adding 50,000–80,000 tons of annual formic acid demand globally—a material uplift for the Formic Acid Market [4][18].

Precision Livestock Nutrition and Digital Feed Management

AI-driven precision feeding systems are enabling livestock producers to optimize formic acid dosing in real time, reducing waste by 15–20% while maintaining antimicrobial efficacy. This trend supports higher-value, lower-volume feed preservatives consumption patterns. Companies integrating IoT sensors with acid based preservatives delivery systems are establishing subscription-based models that improve customer stickiness and provide continuous demand visibility for the Formic Acid Market.

Sustainability Reporting and ESG-Driven Procurement

Growing ESG disclosure requirements—including the EU's Corporate Sustainability Reporting Directive (CSRD)—are pushing downstream buyers to favor suppliers with transparent, low-carbon production processes. Formic acid producers with verified lifecycle assessments and bio-based product certifications are positioned to command 8–12% price premiums over conventional industrial organic acids, creating a structural incentive for green capacity investment through 2035 [11][20].


Formic Acid Market Segmentation

By Application

Segment Share of Market (2025) Primary Demand Driver
Animal Feed & Silage Additives 39.2% Antibiotic-free mandates driving feed preservatives adoption
Leather Tanning 22.8% Chrome-free tanning transition using leather processing chemicals
Textile Dyeing & Finishing 12.4% pH regulation in textile dyeing chemicals processes
Rubber Processing 10.6% Coagulant use in natural rubber processing chemicals
Pharmaceuticals 7.5% Chemical intermediates in API synthesis
Others (Cleaning, De-icing, Oil Drilling) 7.5% Diversified industrial organic acids use cases


The Formic Acid Market is shaped decisively by the animal feed & silage additives segment, which alone absorbs nearly two-fifths of global volumes. The regulatory elimination of prophylactic antibiotics in livestock nutrition across the EU and emerging restrictions in Brazil, Thailand, and India are driving producers to adopt formic acid-based feed preservatives as the primary antimicrobial alternative. This segment is projected to grow at 4.48% CAGR through 2035, outpacing the overall market as antibiotic phase-outs broaden geographically.

Leather tanning represents the second-largest application for the Formic Acid Market. Formic acid serves as a critical de-liming and pickling agent in the tanning process, and the global fashion industry's pivot toward chrome-free leather processing chemicals is reinforcing demand. Italy, India, and Vietnam are the primary consumption centers for tanning-grade formic acid, with Indian tanneries alone consuming over 85,000 tons annually. Textile dyeing chemicals applications are growing, particularly in ASEAN, where synthetic fiber production is expanding and formic acid's role in pH adjustment makes it a preferred auxiliary chemical [6][8].

By Production Method

Segment CAGR (2026–2035) Primary Demand Driver
Methyl Formate Hydrolysis 3.85% Established infrastructure, cost efficiency in industrial organic acids
Carbonylation Technology 3.62% High-purity output for pharmaceutical chemical intermediates
Bio-Based Pathways 5.02% Carbon-neutral production of specialty chemical compounds
Other Production Methods 3.10% Niche electrochemical and enzymatic processes


Methyl formate hydrolysis continues to dominate global formic acid production, representing the most cost-effective route for large-scale manufacturing of industrial organic acids. Chinese and European producers operate integrated methanol-to-formic acid complexes that benefit from scale economies and established supply chains. Bio-based pathways are the fastest-growing production segment in the Formic Acid Market, expanding at 5.02% CAGR as European and North American producers pursue lower-carbon chemical intermediates. Finland's UPM and Germany's BASF are leading commercial-scale bio-based projects, with combined planned capacity exceeding 80,000 tons per year by 2030 [3][7].

By End-Use Industry

Segment Market Volume (2025, '000 tons) Primary Demand Driver
Agriculture 465 Feed preservatives and silage treatment with acid based preservatives
Leather & Footwear 268 Leather processing chemicals for tanning and finishing
Textiles 142 Textile dyeing chemicals and pH adjustment
Rubber & Latex 124 Rubber processing chemicals for coagulation
Pharmaceuticals 88 Chemical intermediates for drug synthesis
Other Industries 83 De-icing, oil drilling, cleaning formulations


Agriculture is the cornerstone end-use industry for the Formic Acid Market, driven by the global livestock sector's consumption of feed preservatives and silage additives. Pharmaceuticals represent the fastest-growing end-use segment at an estimated 4.75% CAGR, as the reshoring of API manufacturing in North America and Europe increases demand for high-purity formic acid as a chemical intermediate. The rubber & latex segment benefits from steady growth in tire manufacturing across Asia-Pacific, where formic acid functions as a coagulant in natural rubber processing chemicals [5][9][10].


Regional Market Share Analysis

Region Share of Global Market (2025) Primary Investment Themes
Asia-Pacific 56.8% Manufacturing expansion, rubber processing chemicals, agricultural chemicals
Europe 21.0% Feed safety regulation, bio-based chemical intermediates, chrome-free tanning
North America 13.5% Pharmaceutical reshoring, antibiotic-free feed preservatives
South America 5.2% Poultry sector growth, acid based preservatives adoption
Middle East & Africa 3.5% Industrial diversification, specialty chemical compounds imports
Total 100%  

The Formic Acid Market exhibits a pronounced Asia-Pacific concentration, with the region's low-cost manufacturing base and large agricultural sector sustaining a dominant share. Europe's stringent regulatory environment for feed preservatives and leather processing chemicals keeps it as a stable second pillar, while North America's pharmaceutical and agricultural chemicals demand adds a third growth vector.


North America

Country CAGR (2026–2035) Key Driver
US 3.92% Pharmaceutical chemical intermediates and feed preservatives demand
Canada 3.48% Livestock sector modernization and preservative chemicals adoption
Mexico 4.15% Leather and footwear manufacturing expansion


North America's Formic Acid Market is shaped by two parallel trends: the pharmaceutical reshoring wave, which is increasing domestic demand for high-purity formic acid as a chemical intermediate, and the steady conversion of livestock operations to antibiotic-free programs requiring acid based preservatives. The U.S. accounts for over 72% of regional consumption, with major feed additive blenders sourcing from both domestic producers and European imports. Mexico's growing leather processing chemicals sector, centered in León and Guadalajara, is emerging as a secondary demand driver [9][22].

Europe

Country Share of Regional Market (2025) Key Driver
Germany 28.4% BASF and Eastman production hubs; industrial organic acids leadership
UK 14.2% Pharmaceutical and specialty chemical compounds applications
France 12.8% Agricultural chemicals in livestock and viticulture
Italy 11.5% Leather processing chemicals for fashion and footwear
Spain 8.1% Feed preservatives for swine and poultry
Nordic Countries 7.6% Bio-based production innovation
Russia 6.2% Rubber processing chemicals for tire manufacturing
Rest of Europe 11.2% Diversified industrial demand


Europe's regulatory landscape—particularly REACH compliance and the post-2022 antibiotic feed ban—shapes the Formic Acid Market more decisively here than in any other region. Germany serves as both the largest producer and consumer, with BASF's Ludwigshafen complex alone representing a significant share of European output. Italy's Tuscany and Veneto regions drive demand for leather processing chemicals in premium tanning, while France and Spain sustain steady consumption of feed preservatives in intensive livestock operations. The Nordic countries, led by Finland, are pioneering bio-based formic acid production through partnerships between chemical firms and forestry companies [3][7][11].

Asia-Pacific

Country Market Volume (2025, '000 tons) Key Driver
China 412 Largest global producer; rubber processing chemicals and textile dyeing chemicals
India 108 Leather processing chemicals and agricultural chemicals growth
Japan 52 Pharmaceutical chemical intermediates and electrochemical R&D
South Korea 34 Specialty chemical compounds for electronics and pharma
ASEAN 48 Feed preservatives and textile dyeing chemicals expansion
Rest of Asia-Pacific 10 Emerging industrial organic acids demand


Asia-Pacific's commanding position in the Formic Acid Market reflects China's integrated production advantage—the country operates over 65% of global methyl formate hydrolysis capacity—combined with India's rapidly expanding leather tanning and livestock sectors. Chinese producers benefit from low methanol costs and proximity to downstream rubber processing chemicals and textile dyeing chemicals customers. India's formic acid consumption grew at 6.3% annually between 2021 and 2025, driven by both leather processing chemicals demand from its massive tanning cluster in Tamil Nadu and rising adoption of feed preservatives in the poultry sector. Japan's contribution centers on high-value pharmaceutical chemical intermediates and cutting-edge electrochemical CO₂ conversion research [5][6][10].

South America

Country CAGR (2026–2035) Key Driver
Brazil 4.62% Poultry and swine feed preservatives, acid based preservatives adoption
Argentina 3.88% Agricultural chemicals for grain and silage preservation
Rest of South America 3.45% Leather processing chemicals for artisanal tanning


Brazil is the engine of South America's Formic Acid Market, where the country's position as the world's largest poultry exporter creates inherent demand for feed preservatives. MAPA's draft 2024 restrictions on growth-promoting antibiotics, if finalized, would accelerate the transition to acid based preservatives and could add 35,000–40,000 tons of annual formic acid consumption by 2030. Argentina's vast grain storage infrastructure relies on preservative chemicals for silage quality, supporting a secondary but consistent demand stream [12][19].

Middle East & Africa

Country Share of Regional Market (2025) Key Driver
Saudi Arabia 27.5% Industrial diversification; specialty chemical compounds imports
UAE 22.8% Re-export hub for industrial organic acids
South Africa 18.4% Leather processing chemicals and mining applications
Egypt 14.6% Agricultural chemicals for livestock feed
Rest of MEA 16.7% Emerging demand for rubber processing chemicals


The Middle East & Africa accounts for the smallest share of the global Formic Acid Market, but Saudi Arabia's Vision 2030 industrial diversification program and the UAE's chemical trading hub status are gradually building a base of regional demand. South Africa's established leather tanning industry and Egypt's expanding poultry sector provide additional pockets of growth for feed preservatives and leather processing chemicals. Import dependence remains high, as the region lacks significant domestic formic acid production capacity [23].


Formic Acid Market By Region, 2025-2035
 

Competitive Benchmarking

The Formic Acid Market exhibits high concentration, with the top five producers controlling an estimated 58–65% of global capacity. The Herfindahl-Hirschman Index (HHI) for this market falls in the moderately concentrated range (~1,800–2,200), reflecting the dominance of large integrated chemical companies alongside a tier of regional specialty producers. Strategic positioning varies between vertically integrated producers who control methanol-to-formic acid value chains and specialty distributors who serve niche applications in leather processing chemicals and pharmaceutical chemical intermediates.

Company Est. Revenue Share Range Key Offerings for Formic Acid Market Strategic Positioning
BASF SE ~14–18% Technical and food-grade formic acid; feed preservatives blends Vertically integrated; largest European producer of industrial organic acids
Eastman Chemical Company ~8–12% High-purity formic acid for chemical intermediates and pharmaceutical use Diversified specialty chemical compounds portfolio
Perstorp Holding AB ~7–10% Pro-grade formic acid for feed preservatives and leather processing chemicals Sustainability leader; bio-based production pioneer
Luxi Chemical Group ~8–11% Commodity-grade formic acid; rubber processing chemicals Cost leader in Chinese domestic market
Gujarat Narmada Valley Fertilizers & Chemicals (GNFC) ~5–8% Agricultural chemicals-grade formic acid for Indian market Integrated ammonia-methanol-formic acid value chain
Rashtriya Chemicals and Fertilizers (RCF) ~3–5% Feed-grade and industrial-grade acid based preservatives Government-owned; strong distribution in Indian agricultural chemicals
Feicheng Acid Chemicals Co. ~4–6% Bulk formic acid for textile dyeing chemicals and rubber processing Scale-driven exporter from Shandong province
Helm AG ~3–5% Trading and distribution of specialty chemical compounds including formic acid Global chemical trading network with European hub
Chongqing Chuandong Chemical Group ~3–5% Industrial-grade formic acid; chemical intermediates Regional producer with integrated coal-chemical complex
Shandong Acid Technology Co. ~2–4% Commodity formic acid for preservative chemicals applications Emerging exporter targeting Southeast Asian markets


Recent News & Developments


  • Perstorp Holding AB (January 2025): Launched its "Pro-Environment" line of bio-based formic acid products, certified carbon-neutral through lifecycle assessment verification by TÜV Rheinland. The product targets leather processing chemicals buyers seeking ESG-compliant inputs [3].
  • European Commission (November 2024): Published updated guidance under REACH Regulation clarifying storage and handling requirements for concentrated formic acid (>85%), affecting specialty chemical compounds distributors across EU member states [11].


  • GNFC (July 2024): Completed commissioning of a 30,000-ton-per-year formic acid production line at Bharuch, Gujarat, increasing India's domestic manufacturing capacity for agricultural chemicals-grade product by approximately 18% [10].
  • Fraunhofer Institute (May 2024): Published results from a two-year pilot project demonstrating continuous electrochemical CO₂-to-formic acid conversion at 72% faradaic efficiency, marking a milestone for next-generation industrial organic acids production technology [4].
  • MAPA (Brazil Ministry of Agriculture) (February 2024): Released draft regulations proposing restrictions on prophylactic antibiotic use in poultry feed, signaling a potential structural shift toward acid based preservatives in South America's largest livestock market [19].
  • Luxi Chemical Group (December 2023): Announced a 50,000-ton capacity addition at its Shandong complex, strengthening its position as China's leading low-cost formic acid producer for rubber processing chemicals and textile dyeing chemicals markets [5].


Formic Acid Market Report Scope

Parameter Detail
Market Scope Global Formic Acid Market by Application, Production Method, End-Use Industry, and Geography
Study Period 2021–2035
CAGR 4.21% (2026–2035)
Market Size (2025) 1.17 Million tons
Market Size (2035) 1.72 Million tons
Fastest Growing Segment Bio-based production pathways (5.02% CAGR)
Companies Profiled 10 (BASF, Eastman, Perstorp, Luxi, GNFC, RCF, Feicheng, Helm, Chongqing Chuandong, Shandong Acid Technology)
Valuation Unit Volume (Million tons)


FAQs

How does formic acid compare to propionic acid in feed preservation cost-effectiveness?

Formic acid typically costs 10–15% less per ton than propionic acid and offers superior anti-Salmonella activity at lower inclusion rates. For poultry operations processing over 5,000 tons of feed monthly, the cost differential translates to annual savings of USD 18,000–25,000.

What purity grades of formic acid are required for pharmaceutical applications?

Pharmaceutical-grade formic acid requires a minimum purity of 98.5% with strict limits on heavy metals (<5 ppm) and chloride content. Producers like Eastman and BASF maintain dedicated high-purity lines that undergo ICH Q7 validation [22].

How does the Formic Acid Market outlook change if electrochemical CO₂ conversion reaches commercial scale?

Commercial-scale electrochemical production could reduce per-ton costs by 20–30% compared to methyl formate hydrolysis by 2032. This would expand addressable demand in hydrogen storage and de-icing applications currently constrained by price sensitivity [4].

What supply chain risks should procurement teams monitor in the Formic Acid Market?

Methanol feedstock concentration in China and the Middle East creates single-source vulnerability. Buyers should diversify across at least two geographic supplier bases and maintain 45–60 days of safety stock for critical feed preservatives applications [14][17].

How are ESG reporting requirements affecting sourcing decisions in the Formic Acid Market?

The EU's CSRD mandates Scope 3 emissions disclosure, pushing downstream buyers toward bio-based formic acid suppliers with verified carbon footprints. Bio-based product commands an 8–12% price premium but satisfies auditor requirements [11][20].

What role does formic acid play in natural rubber coagulation versus conventional acids?

Formic acid achieves faster latex coagulation at lower concentrations (1.5–2.0% v/v) than sulfuric acid, producing cleaner rubber with fewer impurities. Major tire manufacturers increasingly specify formic acid in rubber processing chemicals procurement standards [10].

How should investors evaluate capacity expansion announcements in the Formic Acid Market?

Focus on feedstock integration (methanol self-sufficiency), offtake commitments, and proximity to end-use clusters. Projects with over 60% pre-committed volumes and integrated methanol supply carry materially lower execution risk [7][17].


Author
Author
Author Profile
Chitranshi Jaiswal LinkedIn
Team Lead - Research
Chitranshi is a Team Leader in the Chemicals & Materials (CnM) and Energy & Power (EnP) domains, with 6+ years of experience in market research. She leads and mentors teams to deliver cross-domain projects that equip clients with actionable insights and growth strategies. She is skilled in market estimation, forecasting, competitive benchmarking, and both primary & secondary research, enabling her to turn complex data into decision-ready insights. An engineer and MBA professional, she combines technical expertise with strategic acumen to solve dynamic market challenges. Chitranshi has successfully managed projects that support market entry, investment planning, and competitive positioning, while building strong client relationships. Certified in Advanced Excel & Power BI she leverages data-driven approaches to ensure accuracy, clarity, and impactful outcomes.

Research Approach


Secondary Research

The secondary research process involved comprehensive analysis of chemical regulatory databases, industry trade publications, agricultural research journals, and authoritative chemical safety organizations. Key sources included the US Environmental Protection Agency (EPA), European Chemicals Agency (ECHA) REACH Database, US Food and Drug Administration (FDA) Feed Additive Guidelines, European Food Safety Authority (EFSA), US Department of Agriculture (USDA) National Agricultural Statistics Service, Food and Agriculture Organization (FAO) of the United Nations, Occupational Safety and Health Administration (OSHA) Chemical Safety Data, American Chemistry Council (ACC) Chemical Industry Reports, European Chemical Industry Council (Cefic), International Feed Industry Federation (IFIF), World Leather Organization, China Chemical Industry Association (CCIA), Indian Chemical Council, National Center for Biotechnology Information (NCBI/PubChem), Chemical Abstracts Service (CAS), United States Geological Survey (USGS) Mineral Commodity Summaries, Eurostat Chemical Production Statistics, and national chemical industry bureaus from key markets. Chemical production capacity data, feed additive regulatory standards, leather processing statistics, textile manufacturing trends, and market landscape analysis for oxalic acid-derived and methanol carbonylation formic acid production technologies were gathered using these sources.


Primary Research

Qualitative and quantitative insights were obtained by interviewing supply-side and demand-side stakeholders during the primary research process. Formic acid manufacturers, methanol suppliers, and chemical distribution companies were among the supply-side sources, which included CEOs, VPs of Manufacturing Operations, plant managers, regulatory affairs leaders, and commercial directors. Procurement heads from animal feed manufacturers, managers of leather tanning facilities, supervisors of textile processing plants, purchase managers of rubber chemicals, and research and development directors from agricultural chemical companies constituted demand-side sources. The primary research validated market segmentation across production methods, confirmed capacity expansion timelines, and garnered insights on the adoption patterns of feed-grade versus industrial-grade products, regional pricing dynamics, and regulatory compliance costs.

Primary Respondent Breakdown:

By Designation: C-level Primaries (32%), Director Level (30%), Others (38%)

By Region: North America (32%), Europe (30%), Asia-Pacific (28%), Rest of World (10%)


Market Size Estimation

Production capacity mapping and application volume analysis were implemented to determine global market valuation. The methodology comprised the following:

Identification of over 40 significant manufacturers in North America, Europe, Asia-Pacific (including China, India, and Japan), and Latin America

Product mapping for oxalic acid-based and methanol carbonylation production methods, segmented by feed grade (85% concentration) and industrial grade (90-99% concentration). Analysis of annual revenues that are specific to formic acid product portfolios, including capacity utilization rates at major production facilities, as reported and modeled

Manufacturers that account for 75-80% of the global market share in 2024 are included in the coverage.

To derive segment-specific valuations across rubber, leather, textiles, cleaning agents, preservatives, dyeing, and animal feed applications, extrapolation is employed using bottom-up (application volume × ASP by country, including animal feed tonnage, leather processing volumes, and textile finishing consumption) and top-down (manufacturer revenue validation and methanol feedstock consumption correlation) approaches.

Download Free Sample

Kindly complete the form below to receive a free sample of this Report

Download PDF ×

We do not share your information with anyone. However, we may send you emails based on your report interest from time to time. You may contact us at any time to opt-out.