Segmentation Quick Reference
| Dimension | Sub-Segments | Dominant Segment | Fastest Growing Segment |
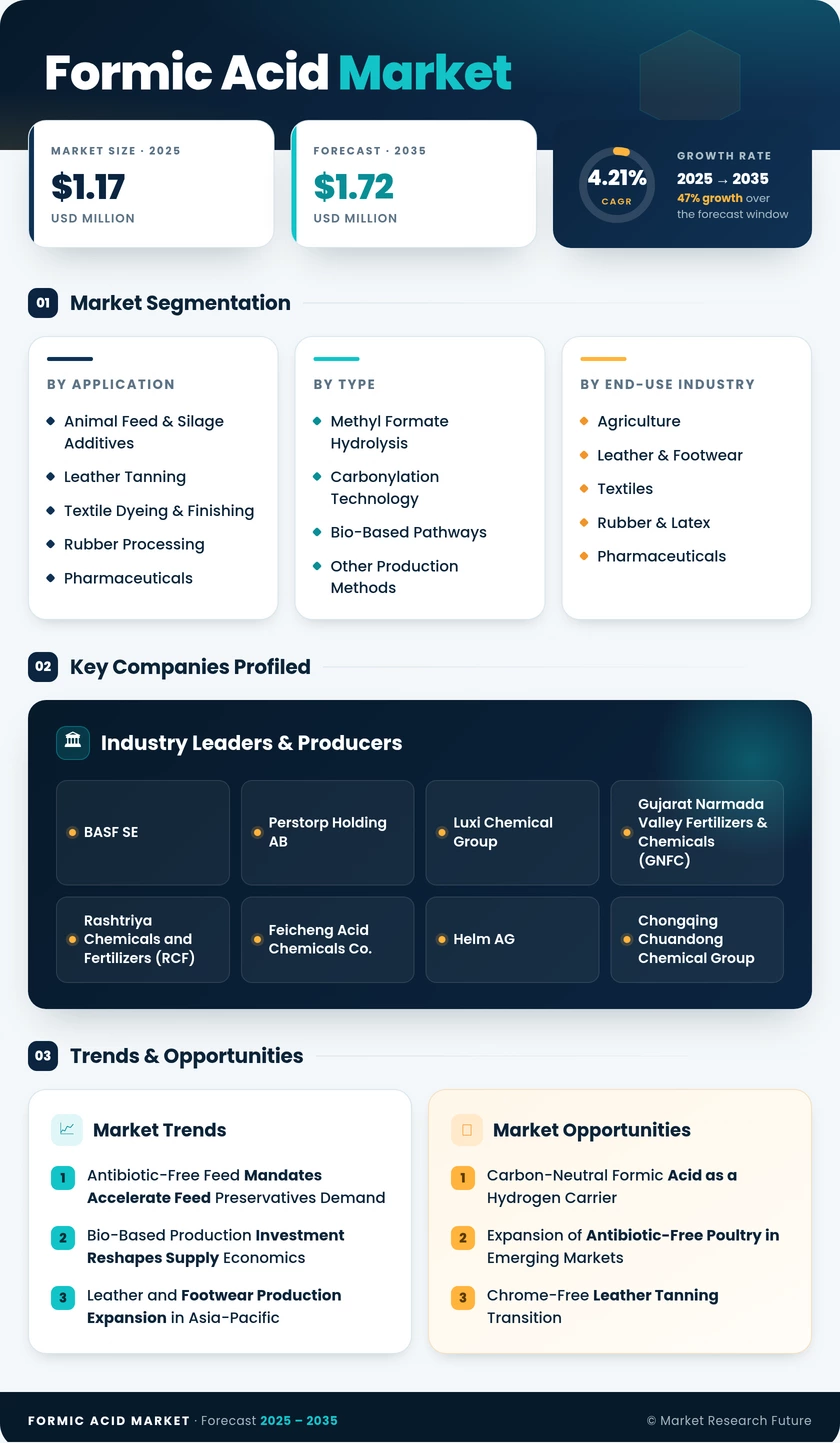
| By Application | Animal Feed & Silage Additives, Leather Tanning, Textile Dyeing & Finishing, Rubber Processing, Formic Acid Markets, Others | Animal Feed & Silage Additives | Animal Feed & Silage Additives |
| By Production Method | Methyl Formate Hydrolysis, Carbonylation Technology, Bio-Based Pathways, Other Production Methods | Methyl Formate Hydrolysis | Bio-Based Pathways |
| By End-Use Industry | Agriculture, Leather & Footwear, Textiles, Rubber & Latex, Formic Acid Markets, Other Industries | Agriculture | Formic Acid Markets |
Market Segmentation Overview
By Application
| Sub-Segment | Key Trend |
| Animal Feed & Silage Additives | Regulatory bans on prophylactic antibiotics drive acid based preservatives adoption globally |
| Leather Tanning | Chrome-free tanning mandates from luxury brands increase leather processing chemicals consumption |
| Textile Dyeing & Finishing | Expanding synthetic fiber output in ASEAN fuels textile dyeing chemicals demand |
| Rubber Processing | Natural rubber coagulation standards favor formic acid over sulfuric acid alternatives |
| Formic Acid Markets | API manufacturing reshoring lifts demand for high-purity chemical intermediates |
| Others | De-icing, oil drilling, and cleaning applications provide diversified demand base |
The application landscape of the Formic Acid Market is dominated by animal nutrition, where formic acid's dual function as a preservative and antimicrobial agent makes it indispensable in modern antibiotic-free livestock programs. Leather tanning and textile dyeing together account for over a third of remaining consumption, with growth trajectories tied to sustainability mandates in fashion supply chains and expanding fiber production in Southeast Asia.
By Production Method
| Sub-Segment | Key Trend |
| Methyl Formate Hydrolysis | Dominant process leveraging integrated methanol value chains in China and Europe |
| Carbonylation Technology | Preferred for high-purity pharmaceutical and electronic-grade specialty chemical compounds |
| Bio-Based Pathways | Fastest-growing route driven by biomass gasification and enzymatic conversion R&D |
| Other Production Methods | Electrochemical CO₂ conversion advancing from pilot to pre-commercial stage |
Production method dynamics in the Formic Acid Market are evolving from a methyl formate hydrolysis monoculture toward a diversified technology mix. Bio-based pathways and electrochemical conversion are emerging as credible alternatives, particularly in regions where carbon pricing and sustainability mandates increase the cost-competitiveness of low-emission industrial organic acids production.
By End-Use Industry
| Sub-Segment | Key Trend |
| Agriculture | Largest end-use sector; driven by global feed preservatives demand and silage treatment |
| Leather & Footwear | Chrome-free transition sustains leather processing chemicals volumes |
| Textiles | Growing role of formic acid in textile dyeing chemicals for pH control |
| Rubber & Latex | Natural rubber coagulation using rubber processing chemicals supports steady demand |
| Formic Acid Markets | Fastest-growing end use as pharmaceutical chemical intermediates demand rises |
| Other Industries | De-icing, cleaning, and oil drilling provide counter-cyclical demand support |
End-use industry segmentation reveals that agriculture and leather & footwear collectively absorb over 60% of global formic acid volumes, making these two sectors the structural anchors of the Formic Acid Market. Formic Acid Markets, while smaller in absolute terms, offer the highest growth trajectory and the strongest margin profile for producers of high-purity specialty chemical compounds.