×
  • Cat-intel
  • MedIntelliX
  • Resources
  • About Us
  • Hero Background
    English
    Chinese
    French
    Japanese
    Korean
    German
    Spanish

    Frozen Dessert Market Size

    ID: MRFR/FnB/0991-CR
    130 Pages
    Varsha More
    February 2021

    Frozen Dessert Market Research Report Information By Product Type (Ice Cream, Yogurts, Cakes, and Others), By Category (Conventional and Sugar-Free), By Distribution Channel (Store-Based and Non-Store Based), And By Region (North America, Europe, Asia-Pacific, And Rest Of The World) – Market Forecast Till 2035

    Share:
    Download PDF ×

    We do not share your information with anyone. However, we may send you emails based on your report interest from time to time. You may contact us at any time to opt-out.

    Frozen Dessert Market Infographic
    Purchase Options

    Frozen Dessert Size

    Frozen Dessert Market Growth Projections and Opportunities

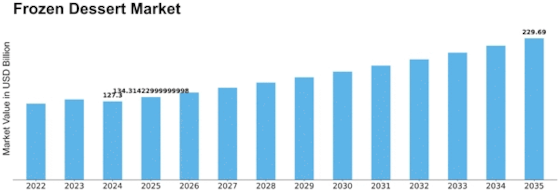
    The Frozen Desserts Market is influenced by a myriad of market factors that collectively shape its dynamics and growth trajectory. One pivotal factor adding to the expansiveness of the market is a change in consumer tastes and dietary patterns. The worldwide Frozen Dessert Market is anticipated to exhibit a Compound Annual Growth Rate (CAGR) of 5.82%, reaching a market value of USD 178.74 Billion by the year 2030. A wide range of frozen desserts encompassing liquids, semi-solid mixes, and even solid ones are made in this process. Furthermore, there is a huge impact on the market due to product innovation and differentiation trends, among other factors that have seen producers come up with new flavors, textures, and formats that will catch the attention of customers away from traditional ice creams alone up to pudding, custard, and ice cream cake as frozen desserts. This pursuit for innovation includes an array of products beyond just ice creams, such as puddings, custards, and ice cream cakes. Manufacturers are always experimenting with various flavors, textures, or formats which can attract consumers' interest. The reason behind this approach is that in addition to traditional ice cream, manufacturers offer an assortment of frozen desserts, including gelatins, puddings, flans custards, mousses semifreddos, sundaes, etc. The benefit offered by such rich product offering sources is increasing the consumer base or retaining customer loyalty. Another influential factor in this industry's growth concerns geographical distribution. Consequently, regional preferences, weather conditions, and economic factors generally govern growth within the frozen dessert markets. In hotter climates, there tends to be more demand for frozen treats since many people want something refreshing and cooling. Government regulations also play quite some role when it comes to shaping the Frozen Desserts Market. Among others, these include health & safety standards, labeling requirements, restrictions on certain ingredients that affect manufacturing distribution marketing, etc. Compliance with these regulations not only ensures product quality but also influences brand reputation. The retail landscape is also an influential factor in market dynamics. The frozen desserts being accessible and available through various retail channels such as supermarkets, convenience stores, and online platforms significantly determine their popularity. Furthermore, the impact of marketing and promotional strategies can never be underestimated regarding this issue. Effective marketing campaigns, branding initiatives, and promotional activities contribute to creating awareness and driving consumer preferences. Pricing is a primary economic factor in market dynamics as well. The Frozen Desserts Market is particularly sensitive to changes in ingredient prices, production costs, or other economic factors that may influence customers' purchasing power. Businesses must balance the availability of high-quality products with competitive pricing for sustainable growth.
    Frozen Dessert Market Size Graph
    Author
    Varsha More
    Research Analyst

    Experienced business professional with a demonstrated history of working in the CFnB industry. Skilled in market research, and market estimation. Strong professional with a Masters focused in marketing management.

    Leave a Comment

    FAQs

    What is the current valuation of the Frozen Dessert Market as of 2024?

    <p>The Frozen Dessert Market was valued at 127.3 USD Billion in 2024.</p>

    What is the projected market size for the Frozen Dessert Market in 2035?

    <p>The market is projected to reach 229.69 USD Billion by 2035.</p>

    What is the expected CAGR for the Frozen Dessert Market during the forecast period 2025 - 2035?

    <p>The expected CAGR for the Frozen Dessert Market during 2025 - 2035 is 5.51%.</p>

    Which product type holds the largest market share in the Frozen Dessert Market?

    <p>Ice Cream holds the largest market share, with a valuation range of 60.0 to 110.0 USD Billion.</p>

    How do sugar-free frozen desserts compare to conventional options in terms of market size?

    <p>Conventional frozen desserts are valued between 100.0 and 185.0 USD Billion, while sugar-free options range from 27.3 to 44.69 USD Billion.</p>

    What are the key distribution channels for frozen desserts?

    <p>The primary distribution channels include Store-Based, valued at 80.0 to 145.0 USD Billion, and Non-Store Based, valued at 47.3 to 84.69 USD Billion.</p>

    Market Summary

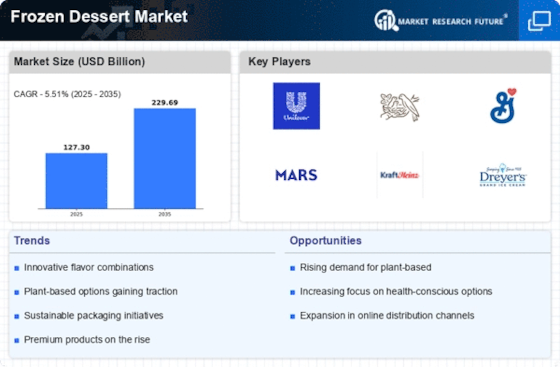
    As per MRFR analysis, the Frozen Dessert Market Size was estimated at 127.3 USD Billion in 2024. The Frozen Dessert industry is projected to grow from 134.32 USD Billion in 2025 to 229.69 USD Billion by 2035, exhibiting a compound annual growth rate (CAGR) of 5.51 during the forecast period 2025 - 2035.

    Key Market Trends & Highlights

    The Frozen Dessert Market is currently experiencing a dynamic shift towards health-conscious and premium offerings.

    • Health-conscious offerings are increasingly influencing consumer preferences in the Frozen Dessert Market.
    • North America remains the largest market, while the Asia-Pacific region is recognized as the fastest-growing area for frozen desserts.
    • Ice cream continues to dominate the market, yet sugar-free options are rapidly gaining traction among health-focused consumers.
    • Innovative flavors and convenience-driven products are key drivers propelling market growth in both conventional and sugar-free segments.

    Market Size & Forecast

    2024 Market Size 127.3 (USD Billion)
    2035 Market Size 229.69 (USD Billion)
    CAGR (2025 - 2035) 5.51%
    Largest Regional Market Share in 2024 Asia Pacific

    Major Players

    <p>Unilever (GB), Nestle (CH), General Mills (US), Mars, Incorporated (US), Kraft Heinz (US), Dreyer's Grand Ice Cream (US), Blue Bell Creameries (US), Häagen-Dazs (US), Breyers (US)</p>

    Market Trends

    The Frozen Dessert Market is currently experiencing a dynamic evolution, driven by changing consumer preferences and an increasing demand for innovative products. As health consciousness rises, consumers are gravitating towards options that offer lower sugar content, natural ingredients, and dairy-free alternatives. This shift is prompting manufacturers to explore new formulations and flavors, thereby expanding their product lines to cater to diverse dietary needs. Additionally, the market is witnessing a surge in the popularity of premium and artisanal frozen desserts, which are perceived as indulgent yet sophisticated choices. These trends suggest a potential for growth as brands strive to differentiate themselves in a competitive landscape. Moreover, the Frozen Dessert Market is also influenced by the growing trend of sustainability. Consumers are becoming more aware of environmental issues, leading to a preference for brands that prioritize eco-friendly practices. This includes sustainable sourcing of ingredients, environmentally friendly packaging, and transparent supply chains. As a result, companies are likely to invest in sustainable practices to appeal to this conscientious consumer base. Overall, the Frozen Dessert Market appears poised for continued expansion, with innovation and sustainability at the forefront of its development.

    Health-Conscious Offerings

    The Frozen Dessert Market is increasingly catering to health-conscious consumers. This trend encompasses the introduction of products with reduced sugar, organic ingredients, and dairy-free options. Manufacturers are responding to the demand for healthier alternatives by reformulating existing products and creating new ones that align with dietary preferences.

    Premium and Artisanal Products

    There is a noticeable shift towards premium and artisanal frozen desserts within the market. Consumers are seeking unique flavors and high-quality ingredients, which has led to the emergence of small-batch producers. This trend reflects a desire for indulgence and a willingness to pay more for perceived quality.

    Sustainability Initiatives

    Sustainability is becoming a critical focus in the Frozen Dessert Market. Brands are increasingly adopting eco-friendly practices, such as sustainable sourcing and environmentally responsible packaging. This trend indicates a growing consumer preference for products that align with their values regarding environmental stewardship.

    Frozen Dessert Market Market Drivers

    Health and Wellness Trends

    The Frozen Dessert Market is experiencing a notable shift towards health and wellness. Consumers are increasingly seeking frozen desserts that align with their dietary preferences, such as low-calorie, low-sugar, and dairy-free options. This trend is supported by market data indicating that the sales of healthier frozen dessert alternatives have increased by approximately 25 percent in recent years. As awareness of health issues rises, brands that innovate to create guilt-free indulgences are likely to capture a larger share of the market. The Frozen Dessert Market is thus evolving to meet the demands of health-conscious consumers, who desire treats that do not compromise their wellness goals.

    Innovative Flavors and Ingredients

    The Frozen Dessert Market is witnessing a surge in demand for innovative flavors and unique ingredients. Consumers are increasingly seeking out exotic and unconventional options, such as matcha, lavender, and even savory flavors. This trend is driven by a desire for novel culinary experiences and the influence of social media, where visually appealing desserts gain traction. According to recent data, the introduction of new flavors has contributed to a 15 percent increase in sales within the industry over the past year. As brands experiment with ingredients like superfoods and plant-based alternatives, the Frozen Dessert Market is likely to expand its consumer base, appealing to adventurous eaters and health-conscious individuals alike.

    Sustainability and Ethical Sourcing

    The Frozen Dessert Market is increasingly influenced by consumer demand for sustainability and ethical sourcing. As awareness of environmental issues grows, consumers are gravitating towards brands that prioritize eco-friendly practices and responsibly sourced ingredients. This trend is reflected in market data, which shows that products marketed as sustainable have seen a 40 percent increase in sales. Brands that adopt sustainable packaging and transparent sourcing practices are likely to resonate with environmentally conscious consumers. The Frozen Dessert Market is thus evolving to meet these expectations, as companies strive to balance profitability with social responsibility.

    Convenience and On-the-Go Consumption

    The Frozen Dessert Market is adapting to the fast-paced lifestyle of modern consumers, who increasingly prioritize convenience. Ready-to-eat frozen desserts, such as single-serve cups and portable ice cream bars, are gaining popularity. This shift is reflected in market data, which indicates that products designed for on-the-go consumption have seen a 20 percent growth in sales. As busy lifestyles become the norm, the demand for quick and easy dessert options is expected to rise. Brands that effectively cater to this need by offering convenient packaging and portion sizes are likely to thrive in the Frozen Dessert Market, appealing to families, young professionals, and students.

    Seasonal and Limited-Edition Offerings

    The Frozen Dessert Market is capitalizing on the appeal of seasonal and limited-edition products. Brands are increasingly launching special flavors and products tied to holidays or seasonal events, creating a sense of urgency among consumers. This strategy not only boosts sales but also enhances brand loyalty as customers eagerly anticipate new offerings. Market data suggests that limited-edition products can lead to a 30 percent increase in sales during peak seasons. As the Frozen Dessert Market continues to innovate, the introduction of seasonal flavors is likely to remain a key driver, enticing consumers to try new products and share their experiences.

    Market Segment Insights

    Frozen Desserts Product Type Insights

    <p>The Frozen Desserts market segmentation, based on product type, includes ice cream,</p>

    <p>, cakes, and others. The ice cream segment held the majority share in 2022 contributing to around 45-47% in respect to the Frozen Desserts market revenue. Due to ice cream's rising popularity across all generations, the demand for it is significantly rising. The United States ice cream producers produced more than 1.3 billion gallons of ice cream in 2021. According to IDFA's Dairy Delivers, the ice cream industry has a $13.1 billion impact on the American economy, supports 28,800 direct jobs, and generates $1.8 billion in direct wages.</p>

    <p>The yogurts segment is anticipated to grow at the fastest CAGR during the forecast period.</p>

    Frozen Desserts Category Insights

    <p>The Frozen Desserts market segmentation, based on category, includes Conventional and Sugar-Free. The Conventional segment dominated the market in 2022 The demand for the segment would be driven in the forecast period by rising millennial demand for convenience food products along with new launches in this segment with varied flavors to attract customers. Such factors are anticipated to have a positive impact on market growth. Sugar-free is projected to be the faster-growing segment during the forecast period, 2022-2030. Due to their health advantages, handcrafted and sugar-free ice creams are both growing in popularity.</p>

    <p>Moreover, the rise of health-conscious consumers looking for a low-carb, low-sugar diet with nutritional advantages will be good for market expansion.</p>

    Frozen Desserts Distribution Channel Insights

    <p>The Frozen Desserts market data has been bifurcated by distribution channels into store-based and non-store-based. The store-based segment dominated the market in 2022. Numerous cafes and bakeries that sell frozen desserts have opened as a result of the growing trend of buying products from specialty stores. They were forced by current trends to incorporate wholesome desserts into their menus, which has improved their product selection. In addition, several online delivery partners are developing creative ways to deliver frozen desserts to various locations that are just as fresh as their source points. Frozen dessert purchases have increased online sales.</p>

    Get more detailed insights about Frozen Dessert Market Research Report - Forecast till 2035

    Regional Insights

    North America : Market Leader in Frozen Desserts

    North America is the largest market for frozen desserts, accounting for approximately 45% of the global market share. The region's growth is driven by increasing consumer demand for premium and innovative frozen dessert options, alongside a rising trend towards healthier alternatives. Regulatory support for food safety and quality standards further catalyzes market expansion, ensuring consumer trust and product integrity. The competitive landscape is characterized by major players such as Unilever, Nestle, and General Mills, which dominate the market with a diverse range of products. The U.S. leads the market, followed by Canada, which contributes significantly to the overall demand. The presence of established brands and continuous product innovation are key factors that maintain the region's leadership in the frozen dessert sector.

    Europe : Emerging Trends in Frozen Desserts

    Europe is witnessing a significant shift in the frozen dessert market, holding approximately 30% of the global share. The growth is primarily driven by increasing health consciousness among consumers, leading to a demand for low-calorie and organic options. Regulatory frameworks in the EU promote transparency in labeling and ingredient sourcing, which enhances consumer confidence and supports market growth. Leading countries in this region include Germany, France, and the UK, where established brands like Häagen-Dazs and Mars are prominent. The competitive landscape is evolving, with new entrants focusing on niche markets such as vegan and gluten-free frozen desserts. This diversification is crucial for capturing the attention of health-conscious consumers and adapting to changing market dynamics.

    Asia-Pacific : Rapid Growth in Emerging Markets

    Asia-Pacific is rapidly emerging as a key player in the frozen dessert market, accounting for about 20% of the global share. The region's growth is fueled by rising disposable incomes, urbanization, and changing consumer lifestyles that favor convenience and indulgence. Additionally, government initiatives to improve food distribution and safety standards are enhancing market accessibility and consumer trust. Countries like China, India, and Japan are leading the charge, with local and international brands competing for market share. The presence of key players such as Nestle and Unilever, along with local manufacturers, creates a competitive landscape that is both dynamic and diverse. Innovations in flavors and product offerings tailored to local tastes are essential for capturing the growing consumer base in this region.

    Middle East and Africa : Untapped Potential in Frozen Desserts

    The Middle East and Africa region is gradually emerging in the frozen dessert market, holding approximately 5% of the global share. The growth is driven by increasing urbanization, a young population, and a growing middle class that is more inclined towards indulgent treats. Regulatory improvements in food safety and quality are also paving the way for market expansion, enhancing consumer confidence in frozen products. Leading countries in this region include South Africa, UAE, and Nigeria, where local and international brands are beginning to establish a foothold. The competitive landscape is characterized by a mix of established players and new entrants, focusing on unique flavors and culturally relevant products. As the market matures, opportunities for growth are significant, particularly in the premium segment of frozen desserts.

    Key Players and Competitive Insights

    The Major market players are focused on diversifying their product portfolios by investing heavily within their R&D departments. Additionally, players are focused on integrating various market developments such as new product launches, contractual agreements, mergers and acquisitions, increased investments, and collaboration with other companies in the market to widen their presence further. The dominant players in the Frozen Desserts industry further offer to optimize their supply chains to widen their profit margins.

    To reduce operating costs, the market leaders in the Frozen Desserts industry are offering their products at a moderate price. During the forecast period, the Frozen Desserts industry has produced highly viable products. The Frozen Desserts market major player such as The Hain Celestial Group (US), Halo Top Creamery (US),

    (US), Unilever (UK), Nestlé SA (Switzerland), Kellogg Company (US), DD IP Holder LLC (US), Conagra Brands Inc. (US), London Dairy Co. Ltd (UK), Danone SA (France), Dairy Queen (US), Ferrero (Luxembourg), Daiya Foods Inc. (Canada), Archer Daniels Midland Company (US), Nestlé S.A. (Switzerland), Arla Foods amba (Denmark), and Unilever (UK), and others are working to expand the market demand by investing in research and development activities.

    Unilever is a company that manufactures and distributes products in the nutrition, hygiene, and personal care sector. In January 2021, Unilever introduced a few frozen treats namely Breyers, Good Humor, Klondike, Magnum Ice Cream, Popsicle, and Talenti. Breyers Double Chocolate Brownie Batter, Breyers Chocolate Pretzel Swirl, and Breyers Reese's Peanut Butter Snack Cups are all new items under the Breyers brand that complement the existing Breyers and Reese's product line. The portfolio also gains Breyers Coconut Fudge Breeze, a new seasonal flavor.

    Archer Daniels Midland is a pioneer in the field of nutrition, using the power of nature to imagine, develop, and combine flavors and ingredients for food and beverages, supplements, animal feed, and more. In August 2022, New Culture, a maker of cheese without using any animals, and Archer Daniels Midland have announced a partnership for strategic development and commercialization. As the company expands its commercial reach, ADM's fermentation and dairy processing operations will assist in producing cheese for New Culture.

    Key Companies in the Frozen Dessert Market market include

    Industry Developments

    On March 15, 2024

    , Ben & Jerry’s tapped into an exploding demand for vegan and dairy-free frozen desserts with their introduction of a new range of desserts made from Almond, oat and coconut milk in their existing line.

    In February 2024,

    Häagen-Dazs and Godiva’s limited-edition releases catered to an audience that seeks luxury frozen treats as the collaboration merged premium chocolates with gelato bases.

    In January 2024

    , Halo Top Creamery broadened their frozen dessert line with reduced fat and sugar products featuring probiotics and fibers for an audience looking for a healthy sating option.

    In December 2023

    , Baskin-Robbins ventured into Southeast Asia and the Middle Eastern market with a new strategy of combining western style ice cream with region specific products like matcha and rosewater to cater to the rise in demand for westernised desserts.

    In November 2023

    , Sorbabes advanced their production through additional funding as they look into launching other exotic rich flavors including dragon fruit in their sorbets and passionfruit in their gelato.

    In October of 2023

    , Unilever, amongst other brands looking to push the issue of sustainability, announced their concern for the ice cream industry with the usage of biodegradable alternatives in their brand’s such as Magnum and Cornetto. This policy also helps the company to achieve its objective which is to lessen harm to the environment and win over customers who care for the environment.

    In September 2023

    , Wal mart also launched its own brand of ice creams and ice lollies alongside dairy free products. The line was positioned for budget shoppers without compromising on assortment and value.

    In August 2023

    , the cold stone creamery introduced a promotional holiday collection of ice creams with pumpkin spice, peppermint mocha, and gingerbread flavors. These were meant to enhance the festive mood and increase seasonal sales.

    Future Outlook

    Frozen Dessert Market Future Outlook

    <p>The Frozen Dessert Market is projected to grow at a 5.51% CAGR from 2024 to 2035, driven by increasing consumer demand for innovative flavors and healthier options.</p>

    New opportunities lie in:

    • <p>Expansion of plant-based frozen dessert lines</p>
    • <p>Development of personalized frozen dessert subscription services</p>
    • <p>Investment in sustainable packaging solutions for frozen products</p>

    <p>By 2035, the Frozen Dessert Market is expected to achieve robust growth, reflecting evolving consumer preferences.</p>

    Market Segmentation

    Frozen Desserts Category Outlook

    • Conventional
    • Sugar-Free

    Frozen Desserts Product Type Outlook

    • Ice Cream
    • Yogurts
    • Cakes
    • Others

    Frozen Desserts Distribution Channel Outlook

    • Store-Based
    • Non-Store Based

    Report Scope

    MARKET SIZE 2024127.3(USD Billion)
    MARKET SIZE 2025134.32(USD Billion)
    MARKET SIZE 2035229.69(USD Billion)
    COMPOUND ANNUAL GROWTH RATE (CAGR)5.51% (2024 - 2035)
    REPORT COVERAGERevenue Forecast, Competitive Landscape, Growth Factors, and Trends
    BASE YEAR2024
    Market Forecast Period2025 - 2035
    Historical Data2019 - 2024
    Market Forecast UnitsUSD Billion
    Key Companies ProfiledMarket analysis in progress
    Segments CoveredMarket segmentation analysis in progress
    Key Market OpportunitiesGrowing demand for plant-based and healthier options in the Frozen Dessert Market presents significant opportunities.
    Key Market DynamicsRising consumer demand for plant-based options drives innovation and competition in the frozen dessert market.
    Countries CoveredNorth America, Europe, APAC, South America, MEA

    FAQs

    What is the current valuation of the Frozen Dessert Market as of 2024?

    <p>The Frozen Dessert Market was valued at 127.3 USD Billion in 2024.</p>

    What is the projected market size for the Frozen Dessert Market in 2035?

    <p>The market is projected to reach 229.69 USD Billion by 2035.</p>

    What is the expected CAGR for the Frozen Dessert Market during the forecast period 2025 - 2035?

    <p>The expected CAGR for the Frozen Dessert Market during 2025 - 2035 is 5.51%.</p>

    Which product type holds the largest market share in the Frozen Dessert Market?

    <p>Ice Cream holds the largest market share, with a valuation range of 60.0 to 110.0 USD Billion.</p>

    How do sugar-free frozen desserts compare to conventional options in terms of market size?

    <p>Conventional frozen desserts are valued between 100.0 and 185.0 USD Billion, while sugar-free options range from 27.3 to 44.69 USD Billion.</p>

    What are the key distribution channels for frozen desserts?

    <p>The primary distribution channels include Store-Based, valued at 80.0 to 145.0 USD Billion, and Non-Store Based, valued at 47.3 to 84.69 USD Billion.</p>

    1. SECTION I: EXECUTIVE SUMMARY AND KEY HIGHLIGHTS
      1. | 1.1 EXECUTIVE SUMMARY
      2. | | 1.1.1 Market Overview
      3. | | 1.1.2 Key Findings
      4. | | 1.1.3 Market Segmentation
      5. | | 1.1.4 Competitive Landscape
      6. | | 1.1.5 Challenges and Opportunities
      7. | | 1.1.6 Future Outlook
    2. SECTION II: SCOPING, METHODOLOGY AND MARKET STRUCTURE
      1. | 2.1 MARKET INTRODUCTION
      2. | | 2.1.1 Definition
      3. | | 2.1.2 Scope of the study
      4. | | | 2.1.2.1 Research Objective
      5. | | | 2.1.2.2 Assumption
      6. | | | 2.1.2.3 Limitations
      7. | 2.2 RESEARCH METHODOLOGY
      8. | | 2.2.1 Overview
      9. | | 2.2.2 Data Mining
      10. | | 2.2.3 Secondary Research
      11. | | 2.2.4 Primary Research
      12. | | | 2.2.4.1 Primary Interviews and Information Gathering Process
      13. | | | 2.2.4.2 Breakdown of Primary Respondents
      14. | | 2.2.5 Forecasting Model
      15. | | 2.2.6 Market Size Estimation
      16. | | | 2.2.6.1 Bottom-Up Approach
      17. | | | 2.2.6.2 Top-Down Approach
      18. | | 2.2.7 Data Triangulation
      19. | | 2.2.8 Validation
    3. SECTION III: QUALITATIVE ANALYSIS
      1. | 3.1 MARKET DYNAMICS
      2. | | 3.1.1 Overview
      3. | | 3.1.2 Drivers
      4. | | 3.1.3 Restraints
      5. | | 3.1.4 Opportunities
      6. | 3.2 MARKET FACTOR ANALYSIS
      7. | | 3.2.1 Value chain Analysis
      8. | | 3.2.2 Porter's Five Forces Analysis
      9. | | | 3.2.2.1 Bargaining Power of Suppliers
      10. | | | 3.2.2.2 Bargaining Power of Buyers
      11. | | | 3.2.2.3 Threat of New Entrants
      12. | | | 3.2.2.4 Threat of Substitutes
      13. | | | 3.2.2.5 Intensity of Rivalry
      14. | | 3.2.3 COVID-19 Impact Analysis
      15. | | | 3.2.3.1 Market Impact Analysis
      16. | | | 3.2.3.2 Regional Impact
      17. | | | 3.2.3.3 Opportunity and Threat Analysis
    4. SECTION IV: QUANTITATIVE ANALYSIS
      1. | 4.1 Food, Beverages & Nutrition, BY Product Type (USD Billion)
      2. | | 4.1.1 Ice Cream
      3. | | 4.1.2 Yogurts
      4. | | 4.1.3 Cakes
      5. | | 4.1.4 Others
      6. | 4.2 Food, Beverages & Nutrition, BY Category (USD Billion)
      7. | | 4.2.1 Conventional
      8. | | 4.2.2 Sugar-Free
      9. | 4.3 Food, Beverages & Nutrition, BY Distribution Channel (USD Billion)
      10. | | 4.3.1 Store-Based
      11. | | 4.3.2 Non-Store Based
      12. | 4.4 Food, Beverages & Nutrition, BY Region (USD Billion)
      13. | | 4.4.1 North America
      14. | | | 4.4.1.1 US
      15. | | | 4.4.1.2 Canada
      16. | | 4.4.2 Europe
      17. | | | 4.4.2.1 Germany
      18. | | | 4.4.2.2 UK
      19. | | | 4.4.2.3 France
      20. | | | 4.4.2.4 Russia
      21. | | | 4.4.2.5 Italy
      22. | | | 4.4.2.6 Spain
      23. | | | 4.4.2.7 Rest of Europe
      24. | | 4.4.3 APAC
      25. | | | 4.4.3.1 China
      26. | | | 4.4.3.2 India
      27. | | | 4.4.3.3 Japan
      28. | | | 4.4.3.4 South Korea
      29. | | | 4.4.3.5 Malaysia
      30. | | | 4.4.3.6 Thailand
      31. | | | 4.4.3.7 Indonesia
      32. | | | 4.4.3.8 Rest of APAC
      33. | | 4.4.4 South America
      34. | | | 4.4.4.1 Brazil
      35. | | | 4.4.4.2 Mexico
      36. | | | 4.4.4.3 Argentina
      37. | | | 4.4.4.4 Rest of South America
      38. | | 4.4.5 MEA
      39. | | | 4.4.5.1 GCC Countries
      40. | | | 4.4.5.2 South Africa
      41. | | | 4.4.5.3 Rest of MEA
    5. SECTION V: COMPETITIVE ANALYSIS
      1. | 5.1 Competitive Landscape
      2. | | 5.1.1 Overview
      3. | | 5.1.2 Competitive Analysis
      4. | | 5.1.3 Market share Analysis
      5. | | 5.1.4 Major Growth Strategy in the Food, Beverages & Nutrition
      6. | | 5.1.5 Competitive Benchmarking
      7. | | 5.1.6 Leading Players in Terms of Number of Developments in the Food, Beverages & Nutrition
      8. | | 5.1.7 Key developments and growth strategies
      9. | | | 5.1.7.1 New Product Launch/Service Deployment
      10. | | | 5.1.7.2 Merger & Acquisitions
      11. | | | 5.1.7.3 Joint Ventures
      12. | | 5.1.8 Major Players Financial Matrix
      13. | | | 5.1.8.1 Sales and Operating Income
      14. | | | 5.1.8.2 Major Players R&D Expenditure. 2023
      15. | 5.2 Company Profiles
      16. | | 5.2.1 Unilever (GB)
      17. | | | 5.2.1.1 Financial Overview
      18. | | | 5.2.1.2 Products Offered
      19. | | | 5.2.1.3 Key Developments
      20. | | | 5.2.1.4 SWOT Analysis
      21. | | | 5.2.1.5 Key Strategies
      22. | | 5.2.2 Nestle (CH)
      23. | | | 5.2.2.1 Financial Overview
      24. | | | 5.2.2.2 Products Offered
      25. | | | 5.2.2.3 Key Developments
      26. | | | 5.2.2.4 SWOT Analysis
      27. | | | 5.2.2.5 Key Strategies
      28. | | 5.2.3 General Mills (US)
      29. | | | 5.2.3.1 Financial Overview
      30. | | | 5.2.3.2 Products Offered
      31. | | | 5.2.3.3 Key Developments
      32. | | | 5.2.3.4 SWOT Analysis
      33. | | | 5.2.3.5 Key Strategies
      34. | | 5.2.4 Mars, Incorporated (US)
      35. | | | 5.2.4.1 Financial Overview
      36. | | | 5.2.4.2 Products Offered
      37. | | | 5.2.4.3 Key Developments
      38. | | | 5.2.4.4 SWOT Analysis
      39. | | | 5.2.4.5 Key Strategies
      40. | | 5.2.5 Kraft Heinz (US)
      41. | | | 5.2.5.1 Financial Overview
      42. | | | 5.2.5.2 Products Offered
      43. | | | 5.2.5.3 Key Developments
      44. | | | 5.2.5.4 SWOT Analysis
      45. | | | 5.2.5.5 Key Strategies
      46. | | 5.2.6 Dreyer's Grand Ice Cream (US)
      47. | | | 5.2.6.1 Financial Overview
      48. | | | 5.2.6.2 Products Offered
      49. | | | 5.2.6.3 Key Developments
      50. | | | 5.2.6.4 SWOT Analysis
      51. | | | 5.2.6.5 Key Strategies
      52. | | 5.2.7 Blue Bell Creameries (US)
      53. | | | 5.2.7.1 Financial Overview
      54. | | | 5.2.7.2 Products Offered
      55. | | | 5.2.7.3 Key Developments
      56. | | | 5.2.7.4 SWOT Analysis
      57. | | | 5.2.7.5 Key Strategies
      58. | | 5.2.8 Häagen-Dazs (US)
      59. | | | 5.2.8.1 Financial Overview
      60. | | | 5.2.8.2 Products Offered
      61. | | | 5.2.8.3 Key Developments
      62. | | | 5.2.8.4 SWOT Analysis
      63. | | | 5.2.8.5 Key Strategies
      64. | | 5.2.9 Breyers (US)
      65. | | | 5.2.9.1 Financial Overview
      66. | | | 5.2.9.2 Products Offered
      67. | | | 5.2.9.3 Key Developments
      68. | | | 5.2.9.4 SWOT Analysis
      69. | | | 5.2.9.5 Key Strategies
      70. | 5.3 Appendix
      71. | | 5.3.1 References
      72. | | 5.3.2 Related Reports
    6. LIST OF FIGURES
      1. | 6.1 MARKET SYNOPSIS
      2. | 6.2 NORTH AMERICA MARKET ANALYSIS
      3. | 6.3 US MARKET ANALYSIS BY PRODUCT TYPE
      4. | 6.4 US MARKET ANALYSIS BY CATEGORY
      5. | 6.5 US MARKET ANALYSIS BY DISTRIBUTION CHANNEL
      6. | 6.6 CANADA MARKET ANALYSIS BY PRODUCT TYPE
      7. | 6.7 CANADA MARKET ANALYSIS BY CATEGORY
      8. | 6.8 CANADA MARKET ANALYSIS BY DISTRIBUTION CHANNEL
      9. | 6.9 EUROPE MARKET ANALYSIS
      10. | 6.10 GERMANY MARKET ANALYSIS BY PRODUCT TYPE
      11. | 6.11 GERMANY MARKET ANALYSIS BY CATEGORY
      12. | 6.12 GERMANY MARKET ANALYSIS BY DISTRIBUTION CHANNEL
      13. | 6.13 UK MARKET ANALYSIS BY PRODUCT TYPE
      14. | 6.14 UK MARKET ANALYSIS BY CATEGORY
      15. | 6.15 UK MARKET ANALYSIS BY DISTRIBUTION CHANNEL
      16. | 6.16 FRANCE MARKET ANALYSIS BY PRODUCT TYPE
      17. | 6.17 FRANCE MARKET ANALYSIS BY CATEGORY
      18. | 6.18 FRANCE MARKET ANALYSIS BY DISTRIBUTION CHANNEL
      19. | 6.19 RUSSIA MARKET ANALYSIS BY PRODUCT TYPE
      20. | 6.20 RUSSIA MARKET ANALYSIS BY CATEGORY
      21. | 6.21 RUSSIA MARKET ANALYSIS BY DISTRIBUTION CHANNEL
      22. | 6.22 ITALY MARKET ANALYSIS BY PRODUCT TYPE
      23. | 6.23 ITALY MARKET ANALYSIS BY CATEGORY
      24. | 6.24 ITALY MARKET ANALYSIS BY DISTRIBUTION CHANNEL
      25. | 6.25 SPAIN MARKET ANALYSIS BY PRODUCT TYPE
      26. | 6.26 SPAIN MARKET ANALYSIS BY CATEGORY
      27. | 6.27 SPAIN MARKET ANALYSIS BY DISTRIBUTION CHANNEL
      28. | 6.28 REST OF EUROPE MARKET ANALYSIS BY PRODUCT TYPE
      29. | 6.29 REST OF EUROPE MARKET ANALYSIS BY CATEGORY
      30. | 6.30 REST OF EUROPE MARKET ANALYSIS BY DISTRIBUTION CHANNEL
      31. | 6.31 APAC MARKET ANALYSIS
      32. | 6.32 CHINA MARKET ANALYSIS BY PRODUCT TYPE
      33. | 6.33 CHINA MARKET ANALYSIS BY CATEGORY
      34. | 6.34 CHINA MARKET ANALYSIS BY DISTRIBUTION CHANNEL
      35. | 6.35 INDIA MARKET ANALYSIS BY PRODUCT TYPE
      36. | 6.36 INDIA MARKET ANALYSIS BY CATEGORY
      37. | 6.37 INDIA MARKET ANALYSIS BY DISTRIBUTION CHANNEL
      38. | 6.38 JAPAN MARKET ANALYSIS BY PRODUCT TYPE
      39. | 6.39 JAPAN MARKET ANALYSIS BY CATEGORY
      40. | 6.40 JAPAN MARKET ANALYSIS BY DISTRIBUTION CHANNEL
      41. | 6.41 SOUTH KOREA MARKET ANALYSIS BY PRODUCT TYPE
      42. | 6.42 SOUTH KOREA MARKET ANALYSIS BY CATEGORY
      43. | 6.43 SOUTH KOREA MARKET ANALYSIS BY DISTRIBUTION CHANNEL
      44. | 6.44 MALAYSIA MARKET ANALYSIS BY PRODUCT TYPE
      45. | 6.45 MALAYSIA MARKET ANALYSIS BY CATEGORY
      46. | 6.46 MALAYSIA MARKET ANALYSIS BY DISTRIBUTION CHANNEL
      47. | 6.47 THAILAND MARKET ANALYSIS BY PRODUCT TYPE
      48. | 6.48 THAILAND MARKET ANALYSIS BY CATEGORY
      49. | 6.49 THAILAND MARKET ANALYSIS BY DISTRIBUTION CHANNEL
      50. | 6.50 INDONESIA MARKET ANALYSIS BY PRODUCT TYPE
      51. | 6.51 INDONESIA MARKET ANALYSIS BY CATEGORY
      52. | 6.52 INDONESIA MARKET ANALYSIS BY DISTRIBUTION CHANNEL
      53. | 6.53 REST OF APAC MARKET ANALYSIS BY PRODUCT TYPE
      54. | 6.54 REST OF APAC MARKET ANALYSIS BY CATEGORY
      55. | 6.55 REST OF APAC MARKET ANALYSIS BY DISTRIBUTION CHANNEL
      56. | 6.56 SOUTH AMERICA MARKET ANALYSIS
      57. | 6.57 BRAZIL MARKET ANALYSIS BY PRODUCT TYPE
      58. | 6.58 BRAZIL MARKET ANALYSIS BY CATEGORY
      59. | 6.59 BRAZIL MARKET ANALYSIS BY DISTRIBUTION CHANNEL
      60. | 6.60 MEXICO MARKET ANALYSIS BY PRODUCT TYPE
      61. | 6.61 MEXICO MARKET ANALYSIS BY CATEGORY
      62. | 6.62 MEXICO MARKET ANALYSIS BY DISTRIBUTION CHANNEL
      63. | 6.63 ARGENTINA MARKET ANALYSIS BY PRODUCT TYPE
      64. | 6.64 ARGENTINA MARKET ANALYSIS BY CATEGORY
      65. | 6.65 ARGENTINA MARKET ANALYSIS BY DISTRIBUTION CHANNEL
      66. | 6.66 REST OF SOUTH AMERICA MARKET ANALYSIS BY PRODUCT TYPE
      67. | 6.67 REST OF SOUTH AMERICA MARKET ANALYSIS BY CATEGORY
      68. | 6.68 REST OF SOUTH AMERICA MARKET ANALYSIS BY DISTRIBUTION CHANNEL
      69. | 6.69 MEA MARKET ANALYSIS
      70. | 6.70 GCC COUNTRIES MARKET ANALYSIS BY PRODUCT TYPE
      71. | 6.71 GCC COUNTRIES MARKET ANALYSIS BY CATEGORY
      72. | 6.72 GCC COUNTRIES MARKET ANALYSIS BY DISTRIBUTION CHANNEL
      73. | 6.73 SOUTH AFRICA MARKET ANALYSIS BY PRODUCT TYPE
      74. | 6.74 SOUTH AFRICA MARKET ANALYSIS BY CATEGORY
      75. | 6.75 SOUTH AFRICA MARKET ANALYSIS BY DISTRIBUTION CHANNEL
      76. | 6.76 REST OF MEA MARKET ANALYSIS BY PRODUCT TYPE
      77. | 6.77 REST OF MEA MARKET ANALYSIS BY CATEGORY
      78. | 6.78 REST OF MEA MARKET ANALYSIS BY DISTRIBUTION CHANNEL
      79. | 6.79 KEY BUYING CRITERIA OF FOOD, BEVERAGES & NUTRITION
      80. | 6.80 RESEARCH PROCESS OF MRFR
      81. | 6.81 DRO ANALYSIS OF FOOD, BEVERAGES & NUTRITION
      82. | 6.82 DRIVERS IMPACT ANALYSIS: FOOD, BEVERAGES & NUTRITION
      83. | 6.83 RESTRAINTS IMPACT ANALYSIS: FOOD, BEVERAGES & NUTRITION
      84. | 6.84 SUPPLY / VALUE CHAIN: FOOD, BEVERAGES & NUTRITION
      85. | 6.85 FOOD, BEVERAGES & NUTRITION, BY PRODUCT TYPE, 2024 (% SHARE)
      86. | 6.86 FOOD, BEVERAGES & NUTRITION, BY PRODUCT TYPE, 2024 TO 2035 (USD Billion)
      87. | 6.87 FOOD, BEVERAGES & NUTRITION, BY CATEGORY, 2024 (% SHARE)
      88. | 6.88 FOOD, BEVERAGES & NUTRITION, BY CATEGORY, 2024 TO 2035 (USD Billion)
      89. | 6.89 FOOD, BEVERAGES & NUTRITION, BY DISTRIBUTION CHANNEL, 2024 (% SHARE)
      90. | 6.90 FOOD, BEVERAGES & NUTRITION, BY DISTRIBUTION CHANNEL, 2024 TO 2035 (USD Billion)
      91. | 6.91 BENCHMARKING OF MAJOR COMPETITORS
    7. LIST OF TABLES
      1. | 7.1 LIST OF ASSUMPTIONS
      2. | | 7.1.1
      3. | 7.2 North America MARKET SIZE ESTIMATES; FORECAST
      4. | | 7.2.1 BY PRODUCT TYPE, 2025-2035 (USD Billion)
      5. | | 7.2.2 BY CATEGORY, 2025-2035 (USD Billion)
      6. | | 7.2.3 BY DISTRIBUTION CHANNEL, 2025-2035 (USD Billion)
      7. | 7.3 US MARKET SIZE ESTIMATES; FORECAST
      8. | | 7.3.1 BY PRODUCT TYPE, 2025-2035 (USD Billion)
      9. | | 7.3.2 BY CATEGORY, 2025-2035 (USD Billion)
      10. | | 7.3.3 BY DISTRIBUTION CHANNEL, 2025-2035 (USD Billion)
      11. | 7.4 Canada MARKET SIZE ESTIMATES; FORECAST
      12. | | 7.4.1 BY PRODUCT TYPE, 2025-2035 (USD Billion)
      13. | | 7.4.2 BY CATEGORY, 2025-2035 (USD Billion)
      14. | | 7.4.3 BY DISTRIBUTION CHANNEL, 2025-2035 (USD Billion)
      15. | 7.5 Europe MARKET SIZE ESTIMATES; FORECAST
      16. | | 7.5.1 BY PRODUCT TYPE, 2025-2035 (USD Billion)
      17. | | 7.5.2 BY CATEGORY, 2025-2035 (USD Billion)
      18. | | 7.5.3 BY DISTRIBUTION CHANNEL, 2025-2035 (USD Billion)
      19. | 7.6 Germany MARKET SIZE ESTIMATES; FORECAST
      20. | | 7.6.1 BY PRODUCT TYPE, 2025-2035 (USD Billion)
      21. | | 7.6.2 BY CATEGORY, 2025-2035 (USD Billion)
      22. | | 7.6.3 BY DISTRIBUTION CHANNEL, 2025-2035 (USD Billion)
      23. | 7.7 UK MARKET SIZE ESTIMATES; FORECAST
      24. | | 7.7.1 BY PRODUCT TYPE, 2025-2035 (USD Billion)
      25. | | 7.7.2 BY CATEGORY, 2025-2035 (USD Billion)
      26. | | 7.7.3 BY DISTRIBUTION CHANNEL, 2025-2035 (USD Billion)
      27. | 7.8 France MARKET SIZE ESTIMATES; FORECAST
      28. | | 7.8.1 BY PRODUCT TYPE, 2025-2035 (USD Billion)
      29. | | 7.8.2 BY CATEGORY, 2025-2035 (USD Billion)
      30. | | 7.8.3 BY DISTRIBUTION CHANNEL, 2025-2035 (USD Billion)
      31. | 7.9 Russia MARKET SIZE ESTIMATES; FORECAST
      32. | | 7.9.1 BY PRODUCT TYPE, 2025-2035 (USD Billion)
      33. | | 7.9.2 BY CATEGORY, 2025-2035 (USD Billion)
      34. | | 7.9.3 BY DISTRIBUTION CHANNEL, 2025-2035 (USD Billion)
      35. | 7.10 Italy MARKET SIZE ESTIMATES; FORECAST
      36. | | 7.10.1 BY PRODUCT TYPE, 2025-2035 (USD Billion)
      37. | | 7.10.2 BY CATEGORY, 2025-2035 (USD Billion)
      38. | | 7.10.3 BY DISTRIBUTION CHANNEL, 2025-2035 (USD Billion)
      39. | 7.11 Spain MARKET SIZE ESTIMATES; FORECAST
      40. | | 7.11.1 BY PRODUCT TYPE, 2025-2035 (USD Billion)
      41. | | 7.11.2 BY CATEGORY, 2025-2035 (USD Billion)
      42. | | 7.11.3 BY DISTRIBUTION CHANNEL, 2025-2035 (USD Billion)
      43. | 7.12 Rest of Europe MARKET SIZE ESTIMATES; FORECAST
      44. | | 7.12.1 BY PRODUCT TYPE, 2025-2035 (USD Billion)
      45. | | 7.12.2 BY CATEGORY, 2025-2035 (USD Billion)
      46. | | 7.12.3 BY DISTRIBUTION CHANNEL, 2025-2035 (USD Billion)
      47. | 7.13 APAC MARKET SIZE ESTIMATES; FORECAST
      48. | | 7.13.1 BY PRODUCT TYPE, 2025-2035 (USD Billion)
      49. | | 7.13.2 BY CATEGORY, 2025-2035 (USD Billion)
      50. | | 7.13.3 BY DISTRIBUTION CHANNEL, 2025-2035 (USD Billion)
      51. | 7.14 China MARKET SIZE ESTIMATES; FORECAST
      52. | | 7.14.1 BY PRODUCT TYPE, 2025-2035 (USD Billion)
      53. | | 7.14.2 BY CATEGORY, 2025-2035 (USD Billion)
      54. | | 7.14.3 BY DISTRIBUTION CHANNEL, 2025-2035 (USD Billion)
      55. | 7.15 India MARKET SIZE ESTIMATES; FORECAST
      56. | | 7.15.1 BY PRODUCT TYPE, 2025-2035 (USD Billion)
      57. | | 7.15.2 BY CATEGORY, 2025-2035 (USD Billion)
      58. | | 7.15.3 BY DISTRIBUTION CHANNEL, 2025-2035 (USD Billion)
      59. | 7.16 Japan MARKET SIZE ESTIMATES; FORECAST
      60. | | 7.16.1 BY PRODUCT TYPE, 2025-2035 (USD Billion)
      61. | | 7.16.2 BY CATEGORY, 2025-2035 (USD Billion)
      62. | | 7.16.3 BY DISTRIBUTION CHANNEL, 2025-2035 (USD Billion)
      63. | 7.17 South Korea MARKET SIZE ESTIMATES; FORECAST
      64. | | 7.17.1 BY PRODUCT TYPE, 2025-2035 (USD Billion)
      65. | | 7.17.2 BY CATEGORY, 2025-2035 (USD Billion)
      66. | | 7.17.3 BY DISTRIBUTION CHANNEL, 2025-2035 (USD Billion)
      67. | 7.18 Malaysia MARKET SIZE ESTIMATES; FORECAST
      68. | | 7.18.1 BY PRODUCT TYPE, 2025-2035 (USD Billion)
      69. | | 7.18.2 BY CATEGORY, 2025-2035 (USD Billion)
      70. | | 7.18.3 BY DISTRIBUTION CHANNEL, 2025-2035 (USD Billion)
      71. | 7.19 Thailand MARKET SIZE ESTIMATES; FORECAST
      72. | | 7.19.1 BY PRODUCT TYPE, 2025-2035 (USD Billion)
      73. | | 7.19.2 BY CATEGORY, 2025-2035 (USD Billion)
      74. | | 7.19.3 BY DISTRIBUTION CHANNEL, 2025-2035 (USD Billion)
      75. | 7.20 Indonesia MARKET SIZE ESTIMATES; FORECAST
      76. | | 7.20.1 BY PRODUCT TYPE, 2025-2035 (USD Billion)
      77. | | 7.20.2 BY CATEGORY, 2025-2035 (USD Billion)
      78. | | 7.20.3 BY DISTRIBUTION CHANNEL, 2025-2035 (USD Billion)
      79. | 7.21 Rest of APAC MARKET SIZE ESTIMATES; FORECAST
      80. | | 7.21.1 BY PRODUCT TYPE, 2025-2035 (USD Billion)
      81. | | 7.21.2 BY CATEGORY, 2025-2035 (USD Billion)
      82. | | 7.21.3 BY DISTRIBUTION CHANNEL, 2025-2035 (USD Billion)
      83. | 7.22 South America MARKET SIZE ESTIMATES; FORECAST
      84. | | 7.22.1 BY PRODUCT TYPE, 2025-2035 (USD Billion)
      85. | | 7.22.2 BY CATEGORY, 2025-2035 (USD Billion)
      86. | | 7.22.3 BY DISTRIBUTION CHANNEL, 2025-2035 (USD Billion)
      87. | 7.23 Brazil MARKET SIZE ESTIMATES; FORECAST
      88. | | 7.23.1 BY PRODUCT TYPE, 2025-2035 (USD Billion)
      89. | | 7.23.2 BY CATEGORY, 2025-2035 (USD Billion)
      90. | | 7.23.3 BY DISTRIBUTION CHANNEL, 2025-2035 (USD Billion)
      91. | 7.24 Mexico MARKET SIZE ESTIMATES; FORECAST
      92. | | 7.24.1 BY PRODUCT TYPE, 2025-2035 (USD Billion)
      93. | | 7.24.2 BY CATEGORY, 2025-2035 (USD Billion)
      94. | | 7.24.3 BY DISTRIBUTION CHANNEL, 2025-2035 (USD Billion)
      95. | 7.25 Argentina MARKET SIZE ESTIMATES; FORECAST
      96. | | 7.25.1 BY PRODUCT TYPE, 2025-2035 (USD Billion)
      97. | | 7.25.2 BY CATEGORY, 2025-2035 (USD Billion)
      98. | | 7.25.3 BY DISTRIBUTION CHANNEL, 2025-2035 (USD Billion)
      99. | 7.26 Rest of South America MARKET SIZE ESTIMATES; FORECAST
      100. | | 7.26.1 BY PRODUCT TYPE, 2025-2035 (USD Billion)
      101. | | 7.26.2 BY CATEGORY, 2025-2035 (USD Billion)
      102. | | 7.26.3 BY DISTRIBUTION CHANNEL, 2025-2035 (USD Billion)
      103. | 7.27 MEA MARKET SIZE ESTIMATES; FORECAST
      104. | | 7.27.1 BY PRODUCT TYPE, 2025-2035 (USD Billion)
      105. | | 7.27.2 BY CATEGORY, 2025-2035 (USD Billion)
      106. | | 7.27.3 BY DISTRIBUTION CHANNEL, 2025-2035 (USD Billion)
      107. | 7.28 GCC Countries MARKET SIZE ESTIMATES; FORECAST
      108. | | 7.28.1 BY PRODUCT TYPE, 2025-2035 (USD Billion)
      109. | | 7.28.2 BY CATEGORY, 2025-2035 (USD Billion)
      110. | | 7.28.3 BY DISTRIBUTION CHANNEL, 2025-2035 (USD Billion)
      111. | 7.29 South Africa MARKET SIZE ESTIMATES; FORECAST
      112. | | 7.29.1 BY PRODUCT TYPE, 2025-2035 (USD Billion)
      113. | | 7.29.2 BY CATEGORY, 2025-2035 (USD Billion)
      114. | | 7.29.3 BY DISTRIBUTION CHANNEL, 2025-2035 (USD Billion)
      115. | 7.30 Rest of MEA MARKET SIZE ESTIMATES; FORECAST
      116. | | 7.30.1 BY PRODUCT TYPE, 2025-2035 (USD Billion)
      117. | | 7.30.2 BY CATEGORY, 2025-2035 (USD Billion)
      118. | | 7.30.3 BY DISTRIBUTION CHANNEL, 2025-2035 (USD Billion)
      119. | 7.31 PRODUCT LAUNCH/PRODUCT DEVELOPMENT/APPROVAL
      120. | | 7.31.1
      121. | 7.32 ACQUISITION/PARTNERSHIP
      122. | | 7.32.1

    Frozen Desserts Market Segmentation

    Frozen Desserts Product Type Outlook (USD Billion, 2019-2030)

    Ice Cream

    Yogurts

    Cakes

    Others

    Frozen Desserts Category Outlook (USD Billion, 2019-2030)

    Conventional

    Sugar-Free

    Frozen Desserts Application Outlook (USD Billion, 2019-2030)

    Store-Based

    Non-Store Based

    Frozen Desserts Regional Outlook (USD Billion, 2019-2030)

    North America Outlook (USD Billion, 2019-2030)

    North America Frozen Desserts by Product Type

    Ice Cream

    Yogurts

    Cakes

    Others

    North America Frozen Desserts by Category

    Conventional

    Sugar-Free

    North America Frozen Desserts by Application

    Store-Based

    Non-Store Based

    US Outlook (USD Billion, 2019-2030)

    US Frozen Desserts by Product Type

    Ice Cream

    Yogurts

    Cakes

    Others

    US Frozen Desserts by Category

    Conventional

    Sugar-Free

    US Frozen Desserts by Application

    Store-Based

    Non-Store Based

    CANADA Outlook (USD Billion, 2019-2030)

    CANADA Frozen Desserts by Product Type

    Ice Cream

    Yogurts

    Cakes

    Others

    CANADA Frozen Desserts by Category

    Conventional

    Sugar-Free

    CANADA Frozen Desserts by Application

    Store-Based

    Non-Store Based

    Europe Outlook (USD Billion, 2019-2030)

    Europe Frozen Desserts by Product Type

    Ice Cream

    Yogurts

    Cakes

    Others

    Europe Frozen Desserts by Category

    Conventional

    Sugar-Free

    Europe Frozen Desserts by Application

    Store-Based

    Non-Store Based

    Germany Outlook (USD Billion, 2019-2030)

    Germany Frozen Desserts by Product Type

    Ice Cream

    Yogurts

    Cakes

    Others

    Germany Frozen Desserts by Category

    Conventional

    Sugar-Free

    Germany Frozen Desserts by Application

    Store-Based

    Non-Store Based

    France Outlook (USD Billion, 2019-2030)

    France Frozen Desserts by Product Type

    Ice Cream

    Yogurts

    Cakes

    Others

    France Frozen Desserts by Category

    Conventional

    Sugar-Free

    France Frozen Desserts by Application

    Store-Based

    Non-Store Based

    UK Outlook (USD Billion, 2019-2030)

    UK Frozen Desserts by Product Type

    Ice Cream

    Yogurts

    Cakes

    Others

    UK Frozen Desserts by Category

    Conventional

    Sugar-Free

    UK Frozen Desserts by Application

    Store-Based

    Non-Store Based

    ITALY Outlook (USD Billion, 2019-2030)

    ITALY Frozen Desserts by Product Type

    Ice Cream

    Yogurts

    Cakes

    Others

    ITALY Frozen Desserts by Category

    Conventional

    Sugar-Free

    ITALY Frozen Desserts by Application

    Store-Based

    Non-Store Based

    SPAIN Outlook (USD Billion, 2019-2030)

    Spain Frozen Desserts by Product Type

    Ice Cream

    Yogurts

    Cakes

    Others

    Spain Frozen Desserts by Category

    Conventional

    Sugar-Free

    Spain Frozen Desserts by Application

    Store-Based

    Non-Store Based

    Rest Of Europe Outlook (USD Billion, 2019-2030)

    Rest Of Europe Frozen Desserts by Product Type

    Ice Cream

    Yogurts

    Cakes

    Others

    REST OF EUROPE Frozen Desserts by Category

    Conventional

    Sugar-Free

    REST OF EUROPE Frozen Desserts by Application

    Store-Based

    Non-Store Based

    Asia-Pacific Outlook (USD Billion, 2019-2030)

    Asia-Pacific Frozen Desserts by Product Type

    Ice Cream

    Yogurts

    Cakes

    Others

    Asia-Pacific Frozen Desserts by Category

    Conventional

    Sugar-Free

    Asia-Pacific Frozen Desserts by Application

    Store-Based

    Non-Store Based

    China Outlook (USD Billion, 2019-2030)

    China Frozen Desserts by Product Type

    Ice Cream

    Yogurts

    Cakes

    Others

    China Frozen Desserts by Category

    Conventional

    Sugar-Free

    China Frozen Desserts by Application

    Store-Based

    Non-Store Based

    Japan Outlook (USD Billion, 2019-2030)

    Japan Frozen Desserts by Product Type

    Ice Cream

    Yogurts

    Cakes

    Others

    Japan Frozen Desserts by Category

    Conventional

    Sugar-Free

    Japan Frozen Desserts by Application

    Store-Based

    Non-Store Based

    India Outlook (USD Billion, 2019-2030)

    India Frozen Desserts by Product Type

    Ice Cream

    Yogurts

    Cakes

    Others

    India Frozen Desserts by Category

    Conventional

    Sugar-Free

    India Frozen Desserts by Application

    Store-Based

    Non-Store Based

    Australia Outlook (USD Billion, 2019-2030)

    Australia Frozen Desserts by Product Type

    Ice Cream

    Yogurts

    Cakes

    Others

    Australia Frozen Desserts by Category

    Conventional

    Sugar-Free

    Australia Frozen Desserts by Application

    Store-Based

    Non-Store Based

    Rest of Asia-Pacific Outlook (USD Billion, 2019-2030)

    Rest of Asia-Pacific Frozen Desserts by Product Type

    Ice Cream

    Yogurts

    Cakes

    Others

    Rest of Asia-Pacific Frozen Desserts by Category

    Conventional

    Sugar-Free

    Rest of Asia-Pacific Frozen Desserts by Application

    Store-Based

    Non-Store Based

    Rest of the World Outlook (USD Billion, 2019-2030)

    Rest of the World Frozen Desserts by Product Type

    Ice Cream

    Yogurts

    Cakes

    Others

    Rest of the World Frozen Desserts by Category

    Conventional

    Sugar-Free

    Rest of the World Frozen Desserts by Application

    Store-Based

    Non-Store Based

    Middle East Outlook (USD Billion, 2019-2030)

    Middle East Frozen Desserts by Product Type

    Ice Cream

    Yogurts

    Cakes

    Others

    Middle East Frozen Desserts by Category

    Conventional

    Sugar-Free

    Middle East Frozen Desserts by Application

    Store-Based

    Non-Store Based

    Africa Outlook (USD Billion, 2019-2030)

    Africa Frozen Desserts by Product Type

    Ice Cream

    Yogurts

    Cakes

    Others

    Africa Frozen Desserts by Category

    Conventional

    Sugar-Free

    Africa Frozen Desserts by Application

    Store-Based

    Non-Store Based

    Latin America Outlook (USD Billion, 2019-2030)

    Latin America Frozen Desserts by Product Type

    Ice Cream

    Yogurts

    Cakes

    Others

    Latin America Frozen Desserts by Category

    Conventional

    Sugar-Free

    Latin America Frozen Desserts by Application

    Store-Based

    Non-Store Based


    Infographic

    Free Sample Request

    Kindly complete the form below to receive a free sample of this Report

    Get Free Sample

    Customer Strories

    “I am very pleased with how market segments have been defined in a relevant way for my purposes (such as "Portable Freezers & refrigerators" and "last-mile"). In general the report is well structured. Thanks very much for your efforts.”

    Victoria Milne

    Founder
    Case Study
    Chemicals and Materials

    Compare Licence

    ×
    Features License Type
    Single User Multiuser License Enterprise User
    Price $4,950 $5,950 $7,250
    Maximum User Access Limit 1 User Upto 10 Users Unrestricted Access Throughout the Organization
    Free Customization
    Direct Access to Analyst
    Deliverable Format
    Platform Access
    Discount on Next Purchase 10% 15% 15%
    Printable Versions