Download Free Sample
Kindly complete the form below to receive a free sample of this Report
Fused Deposition Modeling (FDM) 3D Printing Services Market Research Report: Size, Share, Trend Analysis By Technology Outlook (Fused Deposition Modeling, Multi-Material Printing, Hybrid Printing, Continuous Filament Fabrication, Direct Ink Writing) By Application Outlook (Prototyping, Manufacturing, Tooling, Education, Research and Development) By Service Type Outlook (Design Services, Printing Services, Post-Processing Services, Consultation Services, Maintenance Services) By Material Type Outlook (Thermoplastics, Composites, Metals, Biomaterials, Ceramics) By End Use Industry Outlook (Aerospace, Automotive, Healthcare, Consumer Goods, Electronics) By Region (North America, Europe, APAC, South America, MEA) – Growth Outlook & Industry Forecast To 2035
As per MRFR analysis, the Fused Deposition Modeling (FDM) 3D Printing Services Market was estimated at 2.5 USD Billion in 2024. The FDM 3D printing services industry is projected to grow from 2.74 in 2025 to 6.8 by 2035, exhibiting a compound annual growth rate (CAGR) of 9.52% during the forecast period 2025 - 2035.
The Fused Deposition Modeling (FDM) 3D Printing Services Market is experiencing robust growth driven by customization and technological advancements.
| 2024 Market Size | 2.5 (USD Billion) |
| 2035 Market Size | 6.8 (USD Billion) |
| CAGR (2025 - 2035) | 9.52% |
Stratasys (US), 3D Systems (US), Ultimaker (NL), MakerBot (US), Prusa Research (CZ), Raise3D (US), FlashForge (CN), Anycubic (CN), Formlabs (US)
Our Impact
Enabled $4.3B Revenue Impact for Fortune 500 and Leading Multinationals
Partnering with 2000+ Global Organizations Each Year
30K+ Citations by Top-Tier Firms in the Industry
The Fused Deposition Modeling (FDM) 3D Printing Services Market is currently experiencing a notable evolution, driven by advancements in technology and increasing demand across various sectors. This market appears to be characterized by a growing interest in customized manufacturing solutions, which enable businesses to produce tailored products efficiently. As industries such as automotive, aerospace, and healthcare continue to explore the potential of additive manufacturing, the FDM market is likely to expand further. Moreover, the integration of sustainable materials into the printing process suggests a shift towards environmentally friendly practices, which may enhance the appeal of FDM services. In addition, the rise of small and medium-sized enterprises adopting FDM technology indicates a democratization of access to advanced manufacturing capabilities. These businesses are leveraging FDM services to innovate and streamline their production processes, thereby fostering a competitive landscape. The ongoing development of software tools that facilitate design and production processes also seems to play a crucial role in enhancing the efficiency of FDM services. Overall, the Fused Deposition Modeling (FDM) 3D Printing Services Market appears poised for continued growth, driven by technological advancements and evolving consumer preferences.
The demand for customized products is on the rise, leading to an increased focus on personalization within the Fused Deposition Modeling (FDM) 3D Printing Services Market. Businesses are increasingly seeking solutions that allow them to tailor products to specific customer needs, enhancing user satisfaction and engagement.
There is a growing emphasis on sustainability within the Fused Deposition Modeling (FDM) 3D Printing Services Market. Companies are exploring the use of eco-friendly materials and processes, which not only reduce environmental impact but also appeal to a more environmentally conscious consumer base.
Ongoing technological innovations are shaping the Fused Deposition Modeling (FDM) 3D Printing Services Market. Developments in software and hardware are enhancing the capabilities of FDM printers, allowing for greater precision, speed, and efficiency in production processes.
Customization is a key driver in the Fused Deposition Modeling (FDM) 3D Printing Services Market. The ability to produce tailored products that meet specific customer requirements is becoming increasingly important across various sectors. FDM technology allows for the creation of unique designs and personalized items, ranging from medical implants to consumer products. This capability not only enhances customer satisfaction but also opens new revenue streams for businesses. As consumers increasingly seek personalized solutions, the demand for FDM services that offer customization is likely to grow. Companies that leverage FDM technology to provide bespoke products may gain a competitive edge in their respective markets.
The Fused Deposition Modeling (FDM) 3D Printing Services Market is experiencing a notable increase in demand for rapid prototyping across various sectors. Industries such as automotive, aerospace, and consumer goods are leveraging FDM technology to create prototypes quickly and cost-effectively. This trend is driven by the need for faster product development cycles and the ability to test designs before mass production. According to recent data, the prototyping segment is projected to account for a significant share of the FDM market, as companies seek to reduce time-to-market and enhance innovation. The ability to produce complex geometries and functional prototypes with FDM technology further solidifies its position as a preferred choice for manufacturers.
The Fused Deposition Modeling (FDM) 3D Printing Services Market is witnessing a surge in adoption within educational institutions. Schools and universities are integrating FDM technology into their curricula to enhance learning experiences in fields such as engineering, design, and architecture. This trend is supported by the growing recognition of 3D printing as a valuable tool for fostering creativity and innovation among students. Educational institutions are investing in FDM printers to provide hands-on experience, enabling students to bring their ideas to life. As educational programs increasingly emphasize STEM (Science, Technology, Engineering, and Mathematics) education, the demand for FDM 3D printing services is expected to rise, further expanding the market.
Cost considerations play a pivotal role in the Fused Deposition Modeling (FDM) 3D Printing Services Market. FDM technology is often regarded as one of the most economical 3D printing methods, particularly for small to medium-sized production runs. The materials used in FDM, such as thermoplastics, are generally less expensive compared to other 3D printing materials. This affordability allows businesses to explore 3D printing without incurring substantial upfront costs. Furthermore, the reduction in material waste associated with FDM processes contributes to overall cost savings. As companies increasingly seek budget-friendly manufacturing solutions, the cost-effectiveness of FDM technology is likely to drive its adoption across various industries.
Sustainability is emerging as a crucial factor in the Fused Deposition Modeling (FDM) 3D Printing Services Market. As environmental concerns continue to rise, companies are increasingly seeking eco-friendly manufacturing solutions. FDM technology, which often utilizes recyclable materials, aligns well with sustainability initiatives. The ability to minimize waste and energy consumption during the printing process further enhances its appeal. Many businesses are adopting FDM 3D printing as part of their commitment to sustainable practices, which not only helps reduce their carbon footprint but also resonates with environmentally conscious consumers. This growing emphasis on sustainability is likely to drive the adoption of FDM services in various industries.
The Fused Deposition Modeling (FDM) 3D Printing Services Market has seen a significant distribution of market share across various applications. Prototyping holds the largest share as businesses leverage FDM technology for rapid and cost-effective prototyping of products. This segment attracts numerous users due to its ability to facilitate faster design iterations while reducing material waste. Manufacturing, while currently smaller than prototyping, is emerging as a key area where FDM technology is gaining traction. Growth trends indicate that manufacturing is the fastest-growing application within the FDM sector, spurred by advancements in printing materials and technology developments. This expansion comes as more organizations recognize the advantages of additive manufacturing in producing low-volume parts with customized specifications. Furthermore, increased focus on sustainability in manufacturing processes is likely to accelerate the adoption of FDM for manufacturing applications.
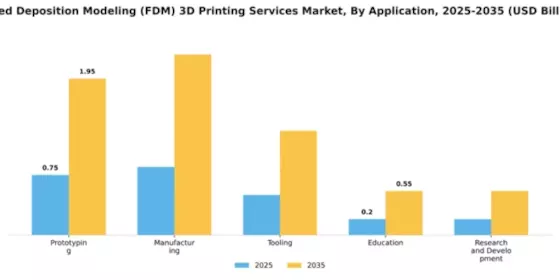
Prototyping (Dominant) vs. Manufacturing (Emerging)
Prototyping remains the dominant application in the Fused Deposition Modeling (FDM) 3D Printing Services Market due to its established utility in product design and development across various industries. This segment’s strength lies in its ability to deliver quick turnaround times for design verification, which allows businesses to bring products to market faster. In contrast, the manufacturing application is emerging as a formidable player, driven by innovations in materials and the capability of FDM technology to produce complex geometries that traditional manufacturing methods cannot achieve. As companies look to streamline production processes and reduce costs, the shift towards FDM for manufacturing is gaining momentum, creating a vibrant and competitive landscape.
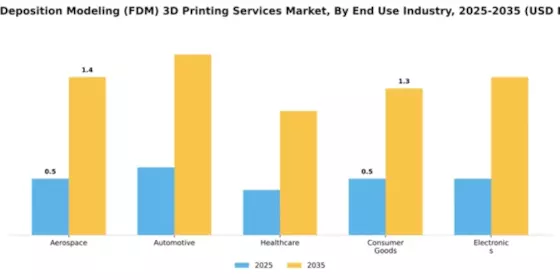
The Fused Deposition Modeling (FDM) 3D Printing Services Market is predominantly shaped by the aerospace industry, which is the largest segment and leverages FDM technologies for producing lightweight components and prototypes. Aerospace’s requirements for precision and custom parts contribute significantly to its market share, with manufacturers increasingly adopting 3D printing to streamline production processes and enhance innovation. In comparison, the healthcare segment, known for its rapid growth, is capitalizing on FDM's versatility to create patient-specific medical devices and prosthetics, thus paving the way for advanced medical solutions.
Aerospace: Dominant vs. Healthcare: Emerging
Aerospace stands as the dominant force in the Fused Deposition Modeling (FDM) 3D printing services market, leveraging advanced technologies to produce complex and tailored components for aircraft and spacecraft. The sector prioritizes innovation, focusing on reducing weight and improving fuel efficiency through optimally designed parts. In contrast, healthcare is emerging as a dynamic player, driven by the increasing demand for personalized medical solutions. The rapid evolution of biocompatible materials and the ability to create intricate designs make FDM a vital technology in developing custom implants and devices. Both sectors exhibit unique characteristics, yet they reflect the immense potential and adaptability of FDM in addressing specific industry challenges.
The Fused Deposition Modeling (FDM) 3D printing services market is prominently shaped by various material types. Among these, thermoplastics hold the largest share, widely adopted for their versatility and ease of use. Major thermoplastic materials such as ABS and PLA are favored for their strong mechanical properties and availability, making them essential in prototyping and production. In contrast, composites, which combine materials for enhanced performance, are rapidly gaining traction as an emerging segment due to their lightweight and durability advantages. Their ability to be tailored for specific applications positions them as a vital contender in the market.
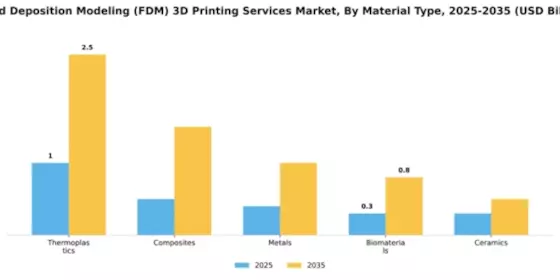
Thermoplastics (Dominant) vs. Composites (Emerging)
Thermoplastics dominate the FDM 3D printing market, known for their excellent thermal stability and adaptability in various applications. They are used in consumer products, automotive components, and medical devices, primarily due to their reliability and ease of processing. Conversely, composites represent an emerging category, integrating fibers within polymer matrices to achieve superior properties. They're particularly valuable in sectors prioritizing light weight and strength, such as aerospace and automotive. As technology advances, composites are expected to expand their presence in FDM services, driven by increasing demand for high-performance materials.
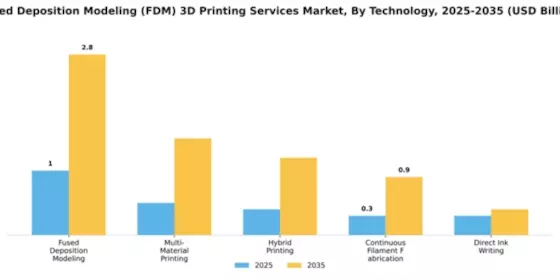
In the Fused Deposition Modeling (FDM) 3D Printing Services Market, Fused Deposition Modeling (FDM) holds the largest market share due to its widespread application across various industries, including automotive, aerospace, and consumer goods. Multi-Material Printing, while still emerging, is increasingly capturing attention for its ability to produce complex geometries and combine different materials in a single print, allowing for enhanced functionality and aesthetics. The diversification within the technology segment indicates a robust interest in innovative solutions that FDM provides. The growth trends within the technology segment are driven by the increasing demand for customized solutions and the evolution of materials used in 3D printing. Advances in Multi-Material Printing technology are particularly noteworthy, as industries look for methods to create parts that require different material properties, such as flexibility, strength, and thermal resistance. Additionally, Hybrid Printing and Continuous Filament Fabrication are gaining traction, catering to niche markets and specialized applications, further driving growth as businesses seek competitive advantages through advanced manufacturing techniques.
Technology: Fused Deposition Modeling (Dominant) vs. Multi-Material Printing (Emerging)
Fused Deposition Modeling (FDM) is widely regarded as the dominant technology in the FDM 3D Printing Services Market due to its efficiency, accessibility, and versatility. It allows for the production of durable prototypes and end-use parts from a variety of thermoplastics, making it a preferred choice for many industries. Meanwhile, Multi-Material Printing represents an emerging technology that stands out for its ability to layer different materials simultaneously, enabling the creation of complex parts that can integrate various properties and functions. As industries seek to innovate and produce more sophisticated products, the rise of Multi-Material Printing signifies a shift towards advanced manufacturing capabilities, positioning it as a critical technology for future developments in the 3D printing landscape.
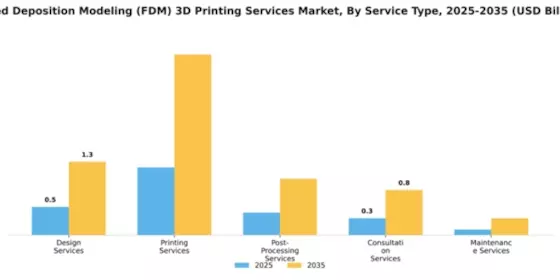
The Fused Deposition Modeling (FDM) 3D Printing Services Market exhibits a diverse spectrum of service types. Among these, Printing Services holds a commanding position, showcasing the highest market share. This segment remains pivotal as it encompasses the core of FDM processes, providing essential services that cater to a broad range of industries. On the other hand, Post-Processing Services are quickly gaining traction, driven by the demand for enhanced finish quality and precision in printed parts. As manufacturers increasingly recognize the importance of surface treatment and assembly processes, this service type is on the rise, carving out a significant niche within the market.
Printing Services (Dominant) vs. Design Services (Emerging)
Printing Services is the dominant player in the FDM 3D Printing Services Market, providing foundational capabilities essential for transforming digital models into physical prototypes. This segment is characterized by its ability to cater to a wide array of applications, from rapid prototyping to small-scale production runs. Conversely, Design Services, while currently classified as emerging, are increasingly sought after as customers strive for tailored solutions that require expert input. This segment is witnessing a surge in demand driven by technological advancements and a growing emphasis on customization, placing it in a significant position for future growth. Both service types reflect a robust relationship where efficiency, innovation, and quality drive market dynamics.
Get more detailed insights about Fused Deposition Modeling (FDM) 3D Printing Services Market Request Free Sample
North America dominates the Fused Deposition Modeling (FDM) 3D printing services market, holding a market size of $1.25B in 2025. The region's growth is driven by advancements in technology, increasing adoption across various industries, and supportive government initiatives. The demand for rapid prototyping and customized manufacturing solutions is on the rise, further propelling market expansion. Regulatory frameworks are also evolving to support innovation in additive manufacturing. The competitive landscape in North America is robust, featuring key players such as Stratasys, 3D Systems, and MakerBot. The U.S. is the leading country, accounting for a significant share of the market, while Canada is also emerging as a notable player. The presence of established companies and a strong focus on R&D contribute to the region's leadership in FDM technology, ensuring continued growth and innovation.
Europe is witnessing significant growth in the Fused Deposition Modeling (FDM) 3D printing services market, with a market size of $0.75B in 2025. The region benefits from a strong manufacturing base, increasing investments in R&D, and a growing emphasis on sustainability. Regulatory support for additive manufacturing is also a key driver, as governments promote innovation and efficiency in production processes. Leading countries in Europe include Germany, the Netherlands, and the Czech Republic, where companies like Ultimaker and Prusa Research are making strides. The competitive landscape is characterized by a mix of established firms and startups, fostering innovation. The European market is poised for growth as industries adopt FDM technology for various applications, from automotive to healthcare.
The Asia-Pacific region is rapidly emerging in the Fused Deposition Modeling (FDM) 3D printing services market, with a market size of $0.4B in 2025. Key growth drivers include increasing industrialization, a surge in demand for customized products, and the expansion of the e-commerce sector. Governments are also implementing policies to support the adoption of advanced manufacturing technologies, which is expected to further boost market growth. China and Japan are leading the way in FDM technology adoption, with companies like FlashForge and Anycubic gaining traction. The competitive landscape is evolving, with both local and international players vying for market share. As the region continues to invest in technology and infrastructure, the FDM market is set to expand significantly, catering to diverse industries such as education, healthcare, and consumer goods.
The Middle East and Africa region is in the nascent stages of developing its Fused Deposition Modeling (FDM) 3D printing services market, currently valued at $0.1B in 2025. The growth potential is significant, driven by increasing awareness of 3D printing applications and the need for localized manufacturing solutions. Governments are beginning to recognize the importance of additive manufacturing in diversifying their economies and enhancing industrial capabilities. Countries like South Africa and the UAE are at the forefront of adopting FDM technology, with initiatives aimed at fostering innovation and entrepreneurship. The competitive landscape is still developing, with a mix of local startups and international firms entering the market. As investments in technology and infrastructure grow, the region is expected to see a gradual increase in FDM adoption across various sectors, including construction and healthcare.
The Fused Deposition Modeling (FDM) 3D Printing Services Market is characterized by a dynamic competitive landscape, driven by technological advancements and increasing demand across various sectors. Key players such as Stratasys (US), 3D Systems (US), and Ultimaker (NL) are at the forefront, each adopting distinct strategies to enhance their market positioning. Stratasys (US) focuses on innovation through continuous product development, particularly in materials and software integration, which appears to bolster its competitive edge. Meanwhile, 3D Systems (US) emphasizes strategic partnerships and acquisitions to expand its service offerings and market reach, thereby enhancing its operational capabilities. Ultimaker (NL) is concentrating on regional expansion and localized manufacturing, which seems to cater to the growing demand for customized solutions in Europe and beyond.The market structure is moderately fragmented, with numerous players vying for market share. This fragmentation is indicative of a competitive environment where localized manufacturing and supply chain optimization are becoming increasingly vital. Companies are adopting various tactics to streamline operations and reduce costs, which collectively influences the market dynamics. The presence of both established firms and emerging startups contributes to a diverse competitive landscape, fostering innovation and driving growth.In November Stratasys (US) announced a partnership with a leading aerospace manufacturer to develop advanced composite materials for FDM applications. This collaboration is strategically significant as it not only enhances Stratasys's material portfolio but also positions the company as a key player in the aerospace sector, which is increasingly adopting 3D printing technologies for lightweight components.In October 3D Systems (US) launched a new subscription-based service model aimed at small and medium-sized enterprises (SMEs). This initiative is noteworthy as it democratizes access to advanced 3D printing technologies, potentially expanding the customer base and fostering innovation among SMEs, which are often constrained by high upfront costs.In September Ultimaker (NL) unveiled a new line of eco-friendly filaments made from recycled materials. This move aligns with the growing trend towards sustainability in manufacturing and positions Ultimaker as a leader in environmentally conscious 3D printing solutions. The strategic importance of this initiative lies in its potential to attract environmentally aware customers and enhance brand loyalty.As of December the competitive trends in the FDM 3D printing services market are increasingly defined by digitalization, sustainability, and the integration of artificial intelligence (AI). Strategic alliances are shaping the landscape, enabling companies to leverage complementary strengths and enhance their technological capabilities. The shift from price-based competition to a focus on innovation, technology, and supply chain reliability is evident, suggesting that future competitive differentiation will hinge on the ability to deliver unique, high-quality solutions that meet evolving customer demands.






The FDM 3D Printing Services Market is projected to grow at a 9.52% CAGR from 2025 to 2035, driven by technological advancements, increased adoption in manufacturing, and customization demands.
New opportunities lie in:
By 2035, the FDM 3D Printing Services Market is expected to be robust and diversified.
| MARKET SIZE 2024 | 2.5(USD Billion) |
| MARKET SIZE 2025 | 2.74(USD Billion) |
| MARKET SIZE 2035 | 6.8(USD Billion) |
| COMPOUND ANNUAL GROWTH RATE (CAGR) | 9.52% (2025 - 2035) |
| REPORT COVERAGE | Revenue Forecast, Competitive Landscape, Growth Factors, and Trends |
| BASE YEAR | 2024 |
| Market Forecast Period | 2025 - 2035 |
| Historical Data | 2019 - 2024 |
| Market Forecast Units | USD Billion |
| Key Companies Profiled | Stratasys (US), 3D Systems (US), Ultimaker (NL), MakerBot (US), Prusa Research (CZ), Raise3D (US), FlashForge (CN), Anycubic (CN), Formlabs (US) |
| Segments Covered | Application, End Use Industry, Material Type, Technology, Service Type |
| Key Market Opportunities | Integration of sustainable materials in Fused Deposition Modeling (FDM) 3D Printing Services Market presents growth potential. |
| Key Market Dynamics | Technological advancements and competitive pressures drive innovation in Fused Deposition Modeling 3D printing services. |
| Countries Covered | North America, Europe, APAC, South America, MEA |
The projected market valuation for the FDM 3D printing services market in 2035 is 6.8 USD Billion.
The overall market valuation of the FDM 3D printing services market in 2024 was 2.5 USD Billion.
The expected CAGR for the FDM 3D printing services market during the forecast period 2025 - 2035 is 9.52%.
Key players in the FDM 3D printing services market include Stratasys, 3D Systems, Ultimaker, MakerBot, Prusa Research, Raise3D, FlashForge, Anycubic, and Formlabs.
The projected revenues for the prototyping application segment are expected to reach 1.95 USD Billion by 2035.
The healthcare end-use industry segment is projected to generate 1.1 USD Billion by 2035.
The expected revenue for thermoplastics as a material type is anticipated to be 2.5 USD Billion by 2035.
The revenue projected for printing services is expected to reach 3.2 USD Billion by 2035.
The anticipated growth for the automotive end-use industry segment is expected to reach 1.6 USD Billion by 2035.
The projected revenue for multi-material printing technology is expected to be 1.5 USD Billion by 2035.


Kindly complete the form below to receive a free sample of this Report

“This is really good guys. Excellent work on a tight deadline. I will continue to use you going forward and recommend you to others. Nice job”


“Thanks. It’s been a pleasure working with you, please use me as reference with any other Intel employees.”


“Thanks for sending the report it gives us a good global view of the Betaïne market.”


“Thank you, this will be very helpful for OQS.”


“We found the report very insightful! we found your research firm very helpful. I'm sending this email to secure our future business.”


“I am very pleased with how market segments have been defined in a relevant way for my purposes (such as "Portable Freezers & refrigerators" and "last-mile"). In general the report is well structured. Thanks very much for your efforts.”


“I have been reading the first document or the study, ,the Global HVAC and FP market report 2021 till 2026. Must say, good info! I have not gone in depth at all parts, but got a good indication of the data inside!”


“We got the report in time, we really thank you for your support in this process. I also thank to all of your team as they did a great job.”


“The Automotive 48V ECU Components Procurement Intelligence Study” was a complex project, but the Market Research Future (MRFR) team handled it with quality, agility, and customer-centricity. They delivered all requested data on time and within the agreed scope. The team, including Shubhendra Anand and Rahul Gotadki, was always readily available to clarify questions and swiftly implement necessary adjustments, driving the project to a successful conclusion within a very demanding timeframe.
I would also like to specifically commend Akshay Agarwal for his responsiveness and support at every stage—from our initial inquiry on May 6th through to final delivery on June 18th. His dedication made the entire process seamless.”



